The document discusses various aspects of agile methodologies and their efficacy, diving into both subjective and objective measures of success through studies and statistics. It emphasizes the importance of factors like psychological safety, team dynamics, and leadership in high-performing agile teams, referencing Google's Project Aristotle as significant evidence. Additionally, it highlights key findings from DevOps reports on team performance, continuous delivery, and the impact of architecture on IT performance.


![Aristotle: 1+1
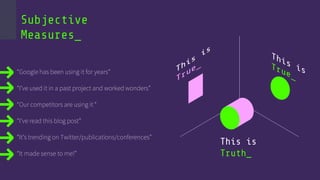
Psychological Safety_
“[Psychological safety is] a sense of
confidence that the team will not embarrass,
reject or punish someone for speaking up,’’
- Amy Edmondson (1999)
TEDx Talk > https://goo.gl/eXbxXn](https://image.slidesharecdn.com/agilenumbersdsmagilev4-171115211010/85/Agile-numbers-26-320.jpg)


![[DEISER Day Conferences] "The Secret Sauce of Successful Teams" - Vlad Caval...](https://cdn.slidesharecdn.com/ss_thumbnails/devopsteams-170705114204-thumbnail.jpg?width=640&height=640&fit=bounds)


