Downloaded 11 times
![Not all data is created equal
Who here thinks surveys are sh*t?
[Nicole should probably turn around]
Who here LOVES the data from their log files?
And who has seen sh*t data in a log file?](https://image.slidesharecdn.com/2016velocitysantaclara2016-stateofdevopsreportdeckfinal-160623203021/75/2016-velocity-santa-clara-state-of-dev-ops-report-deck-final-7-2048.jpg)
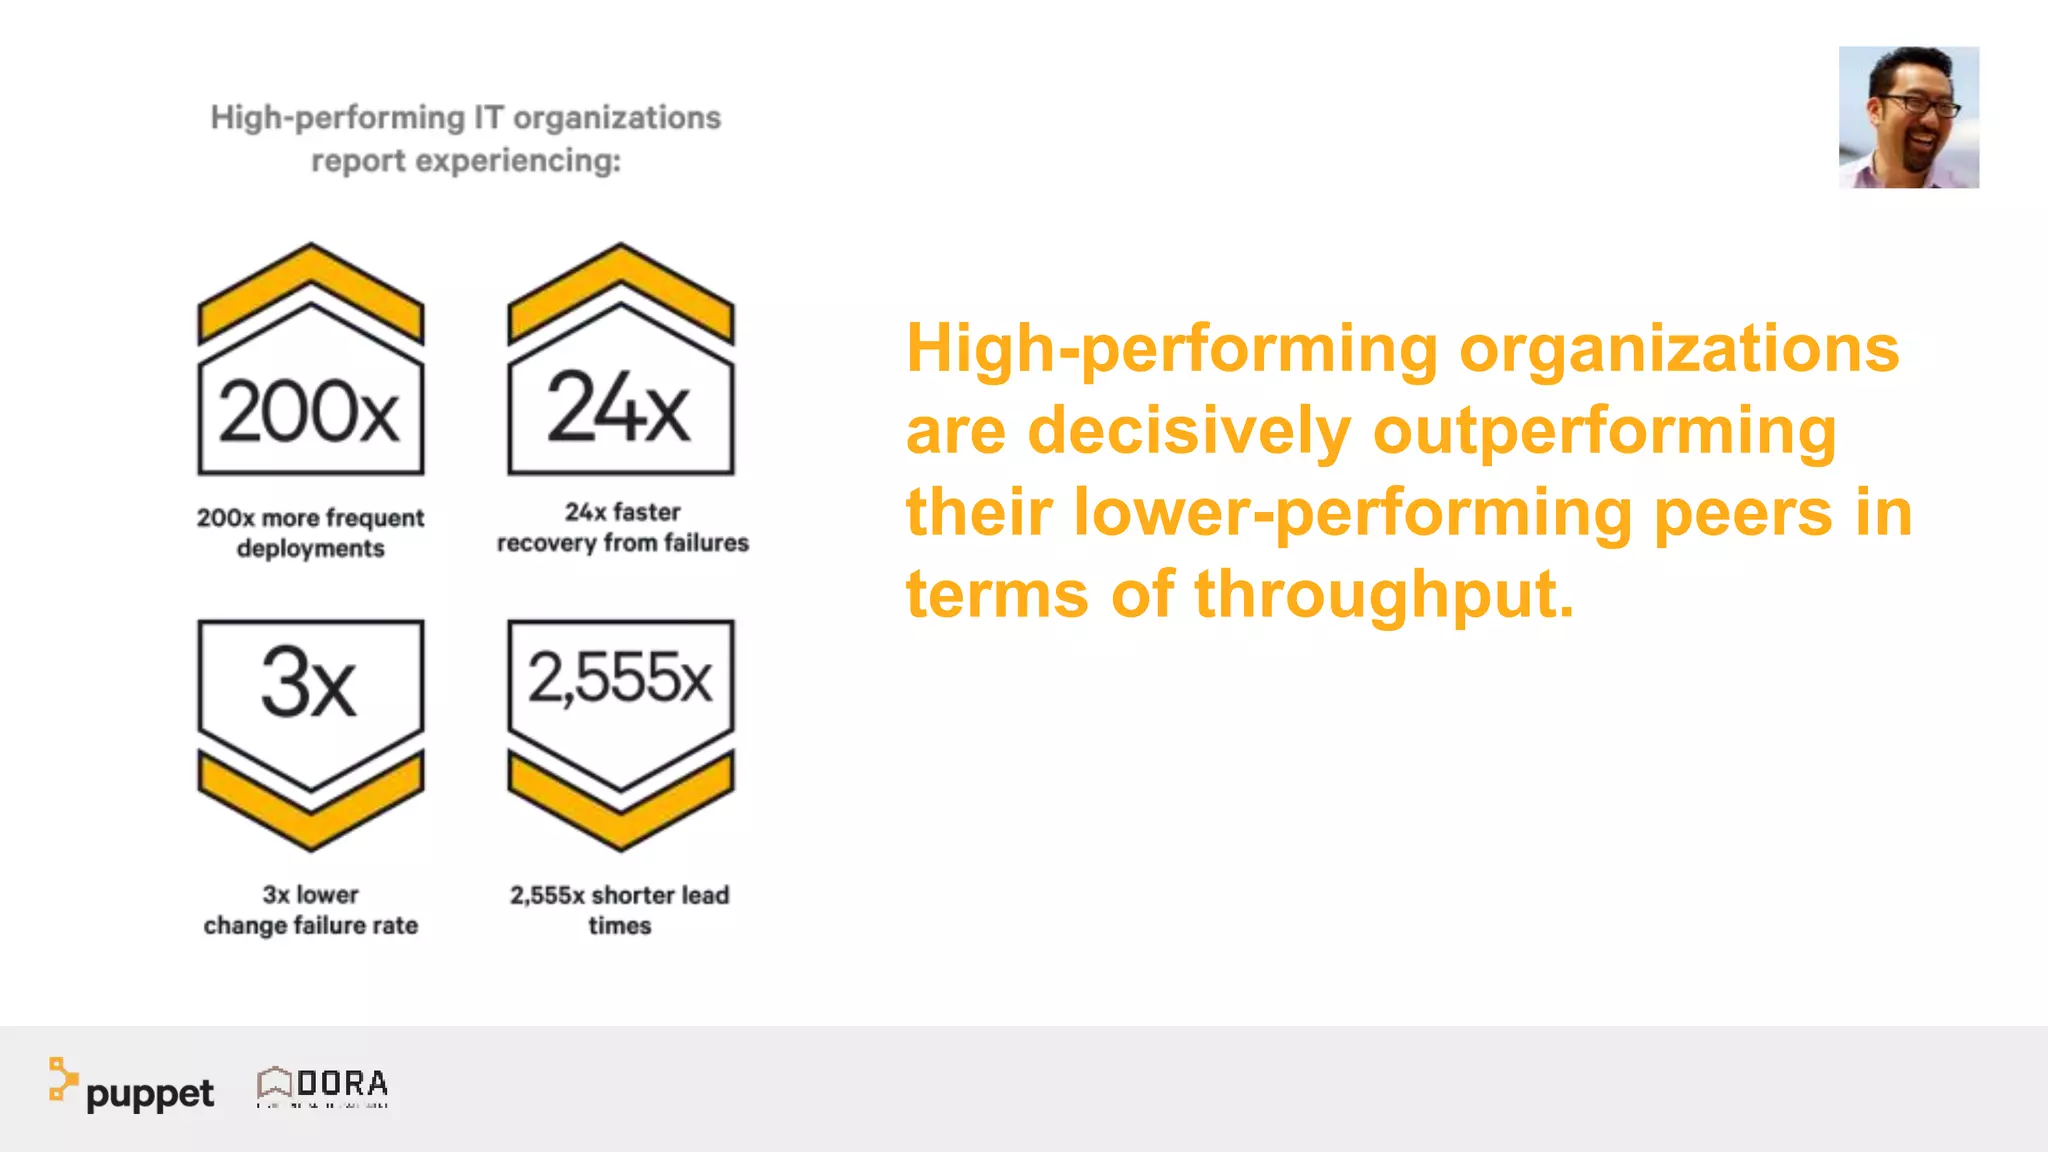
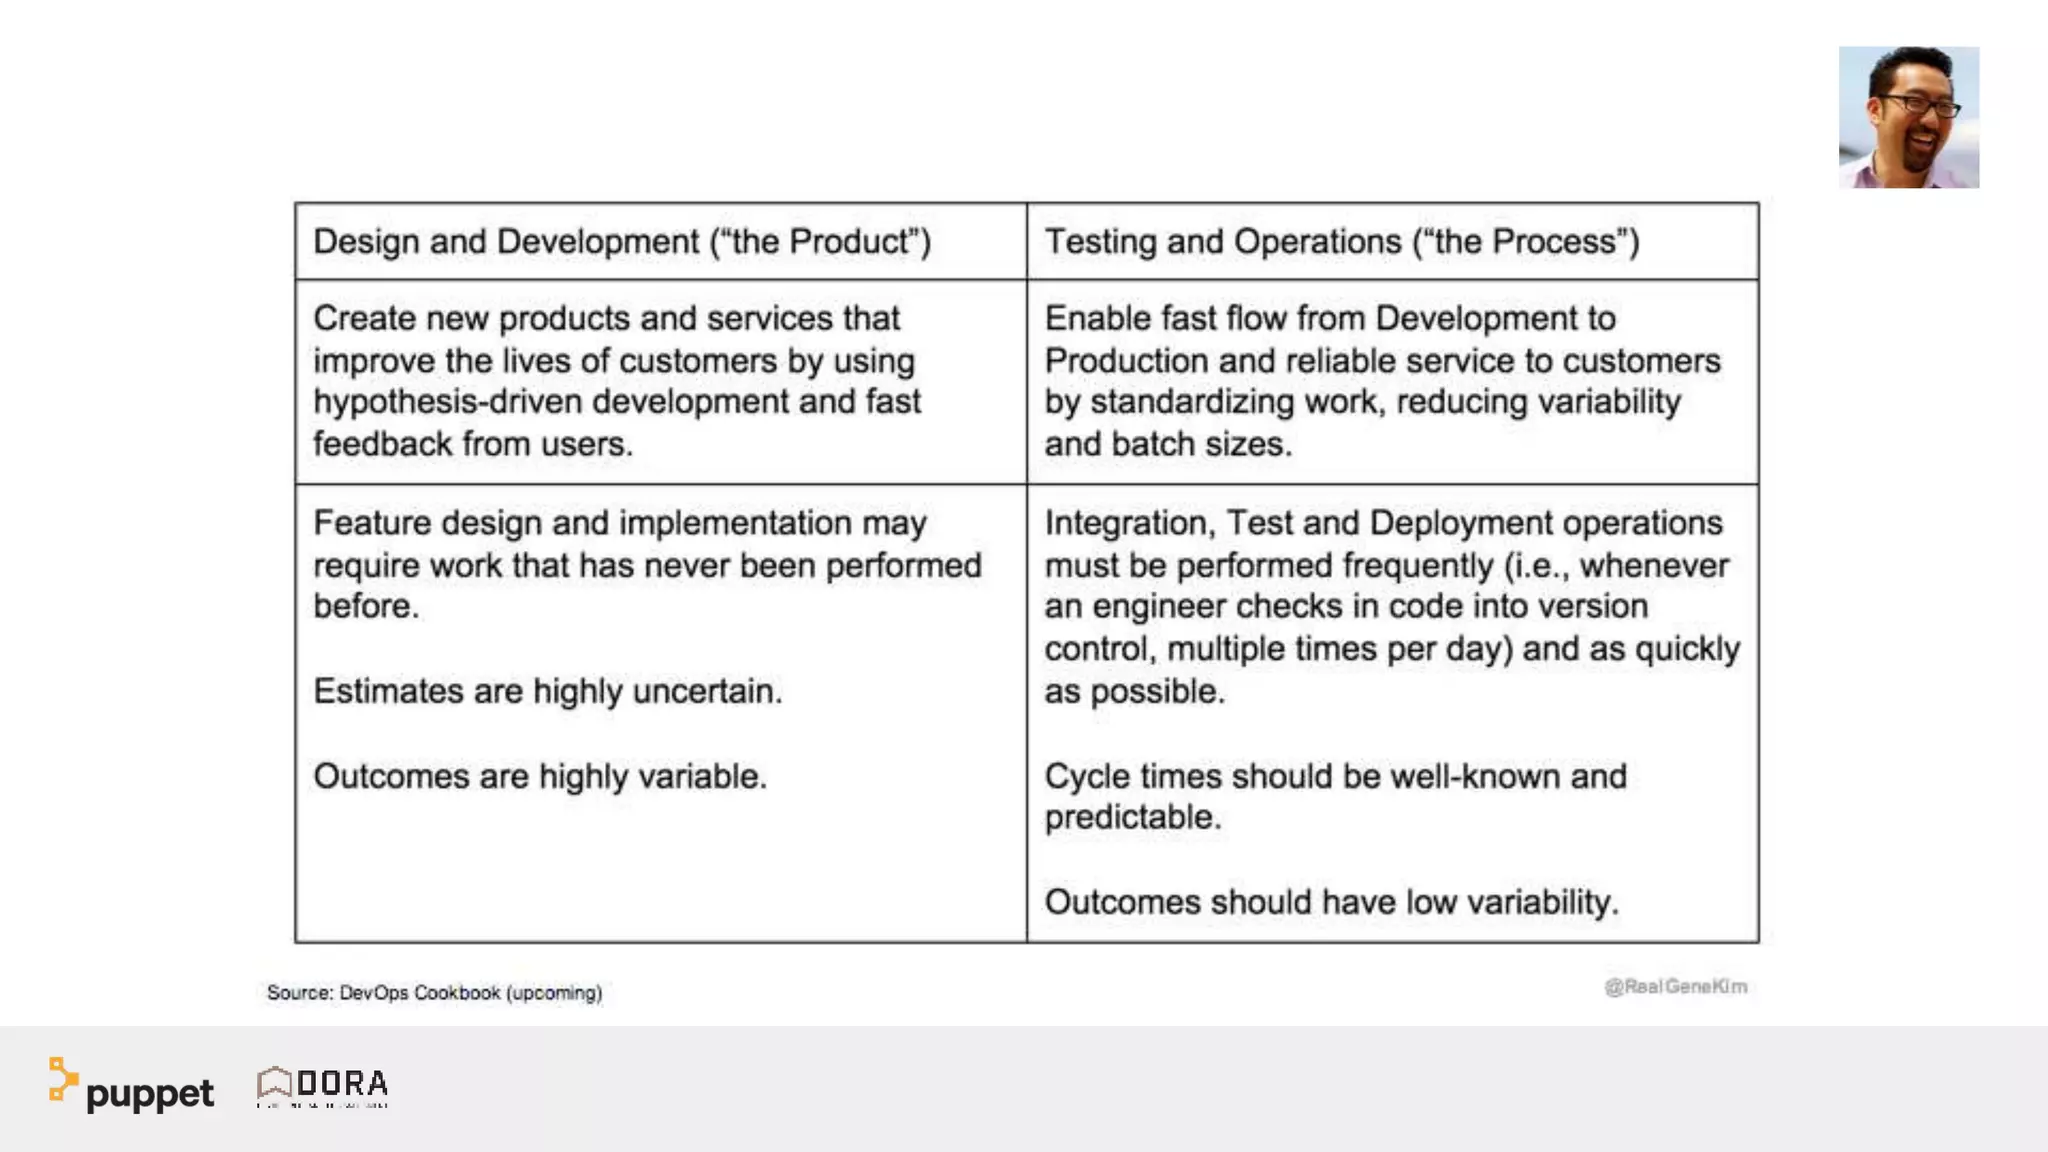
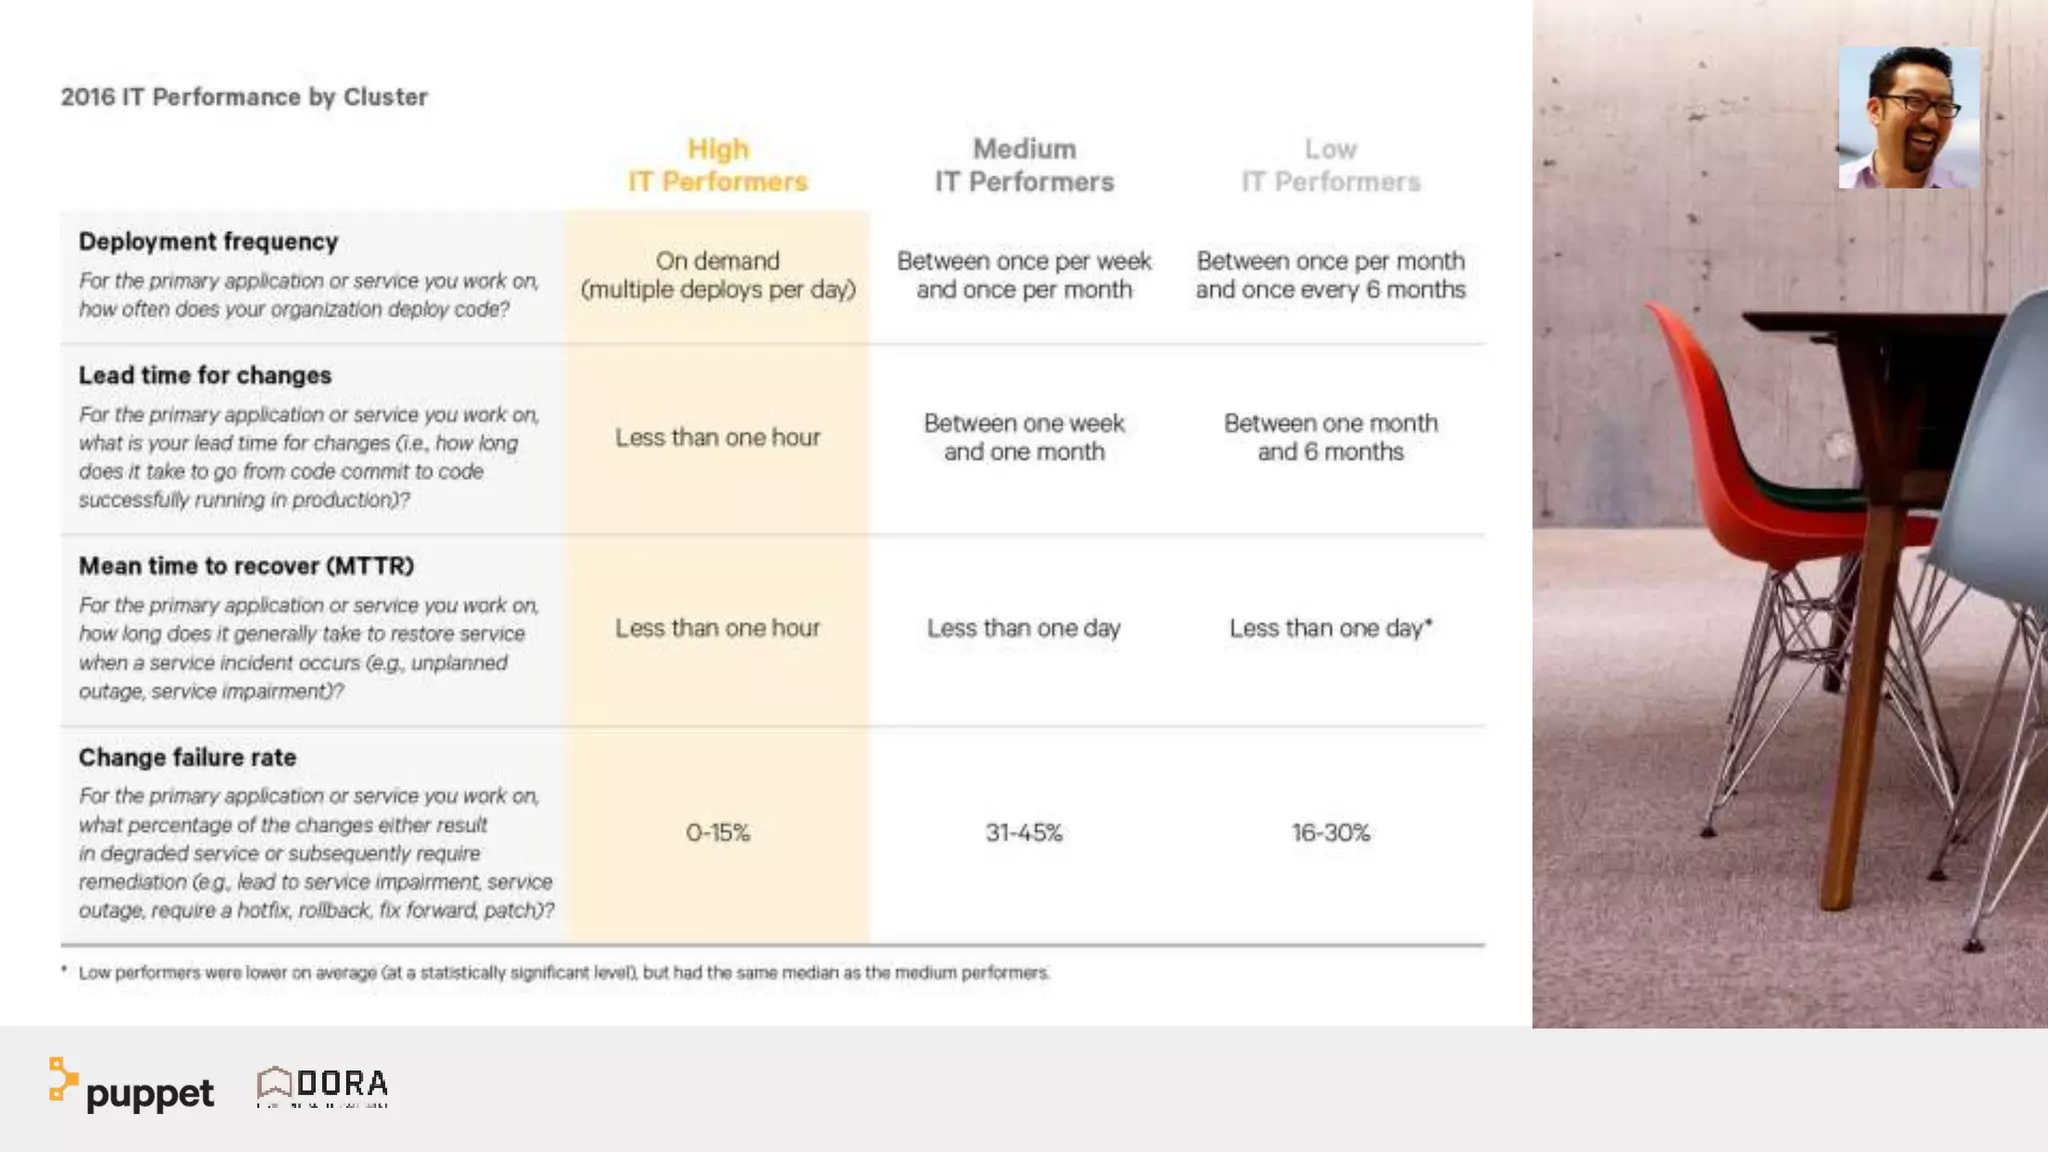
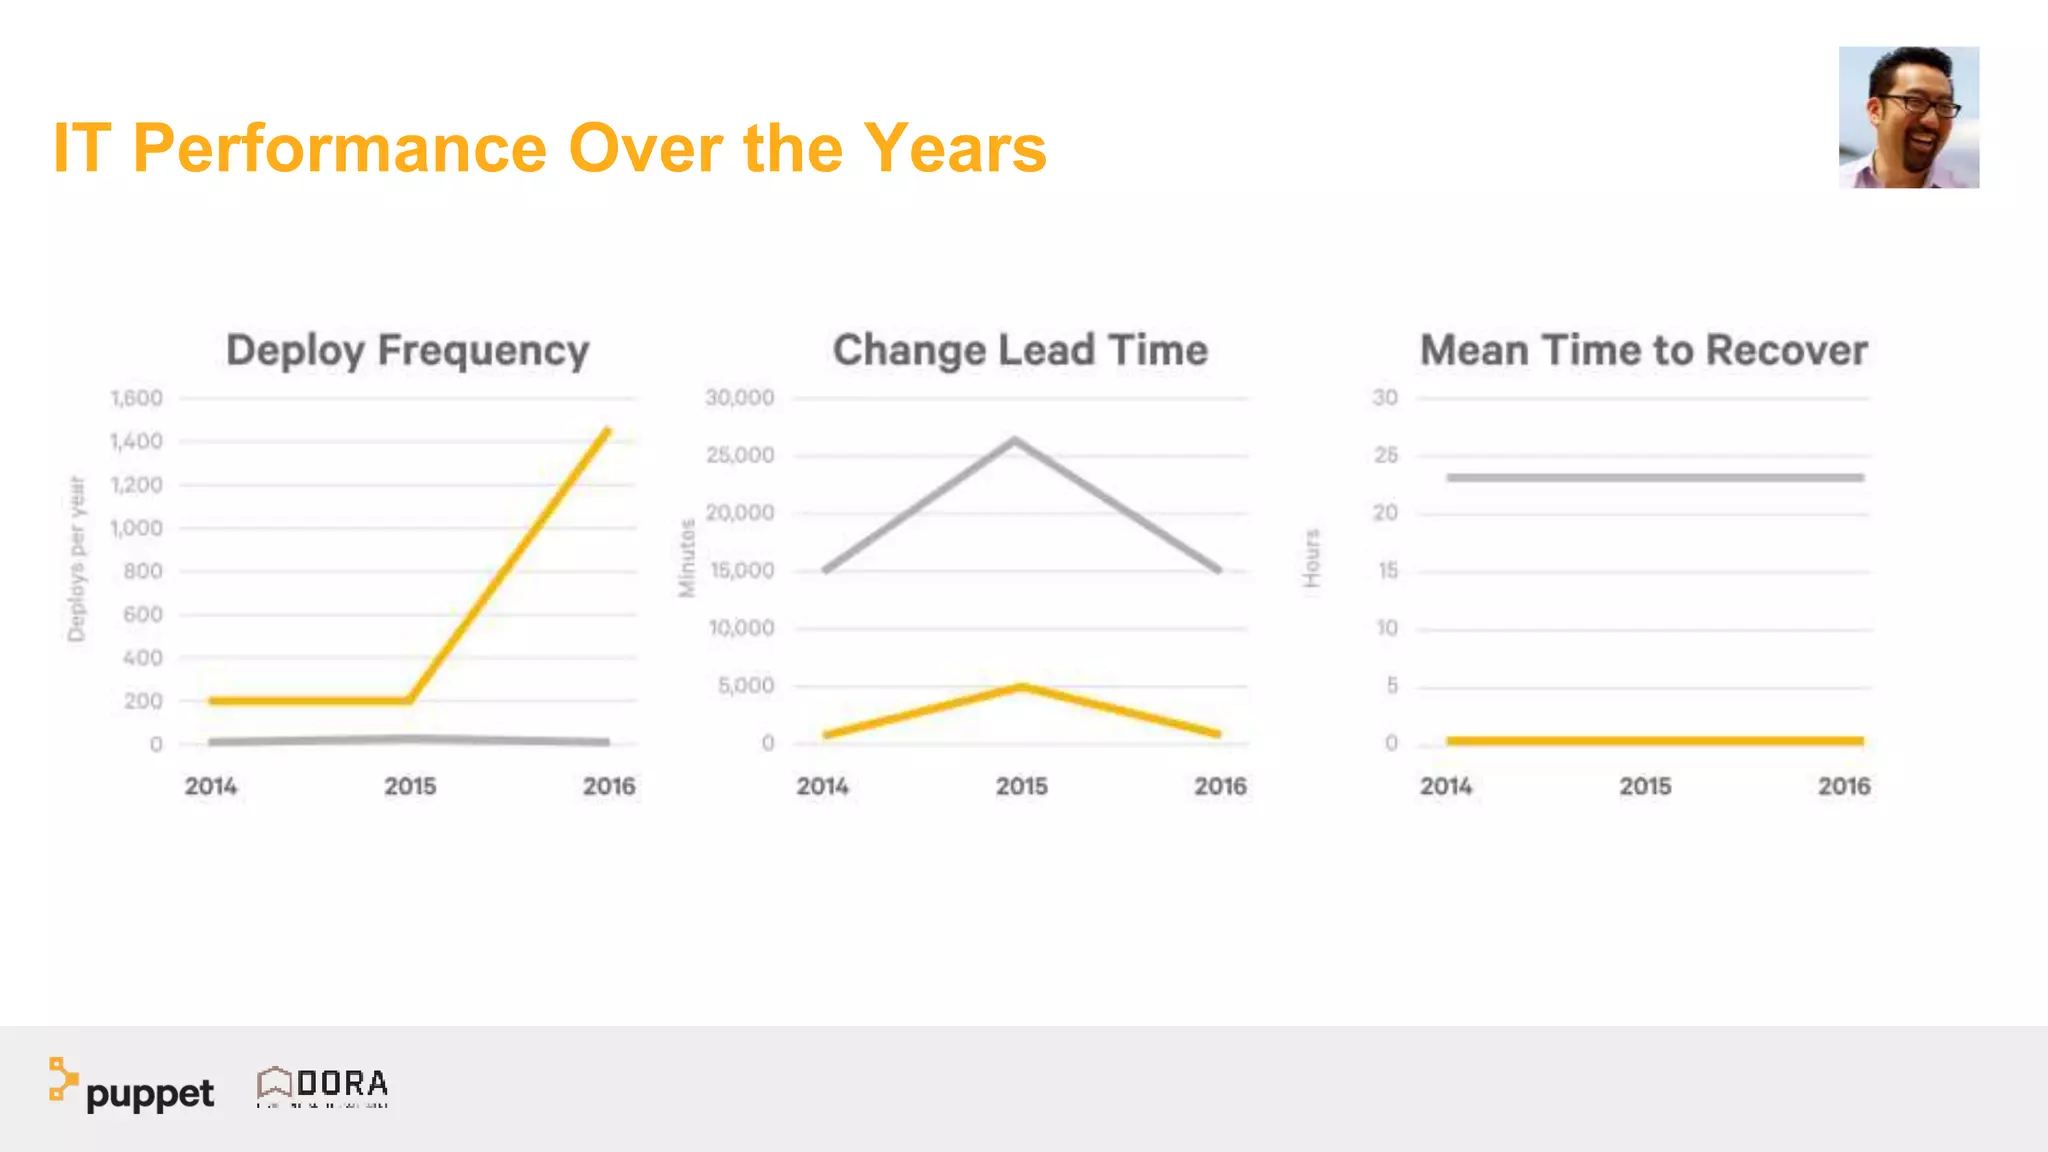
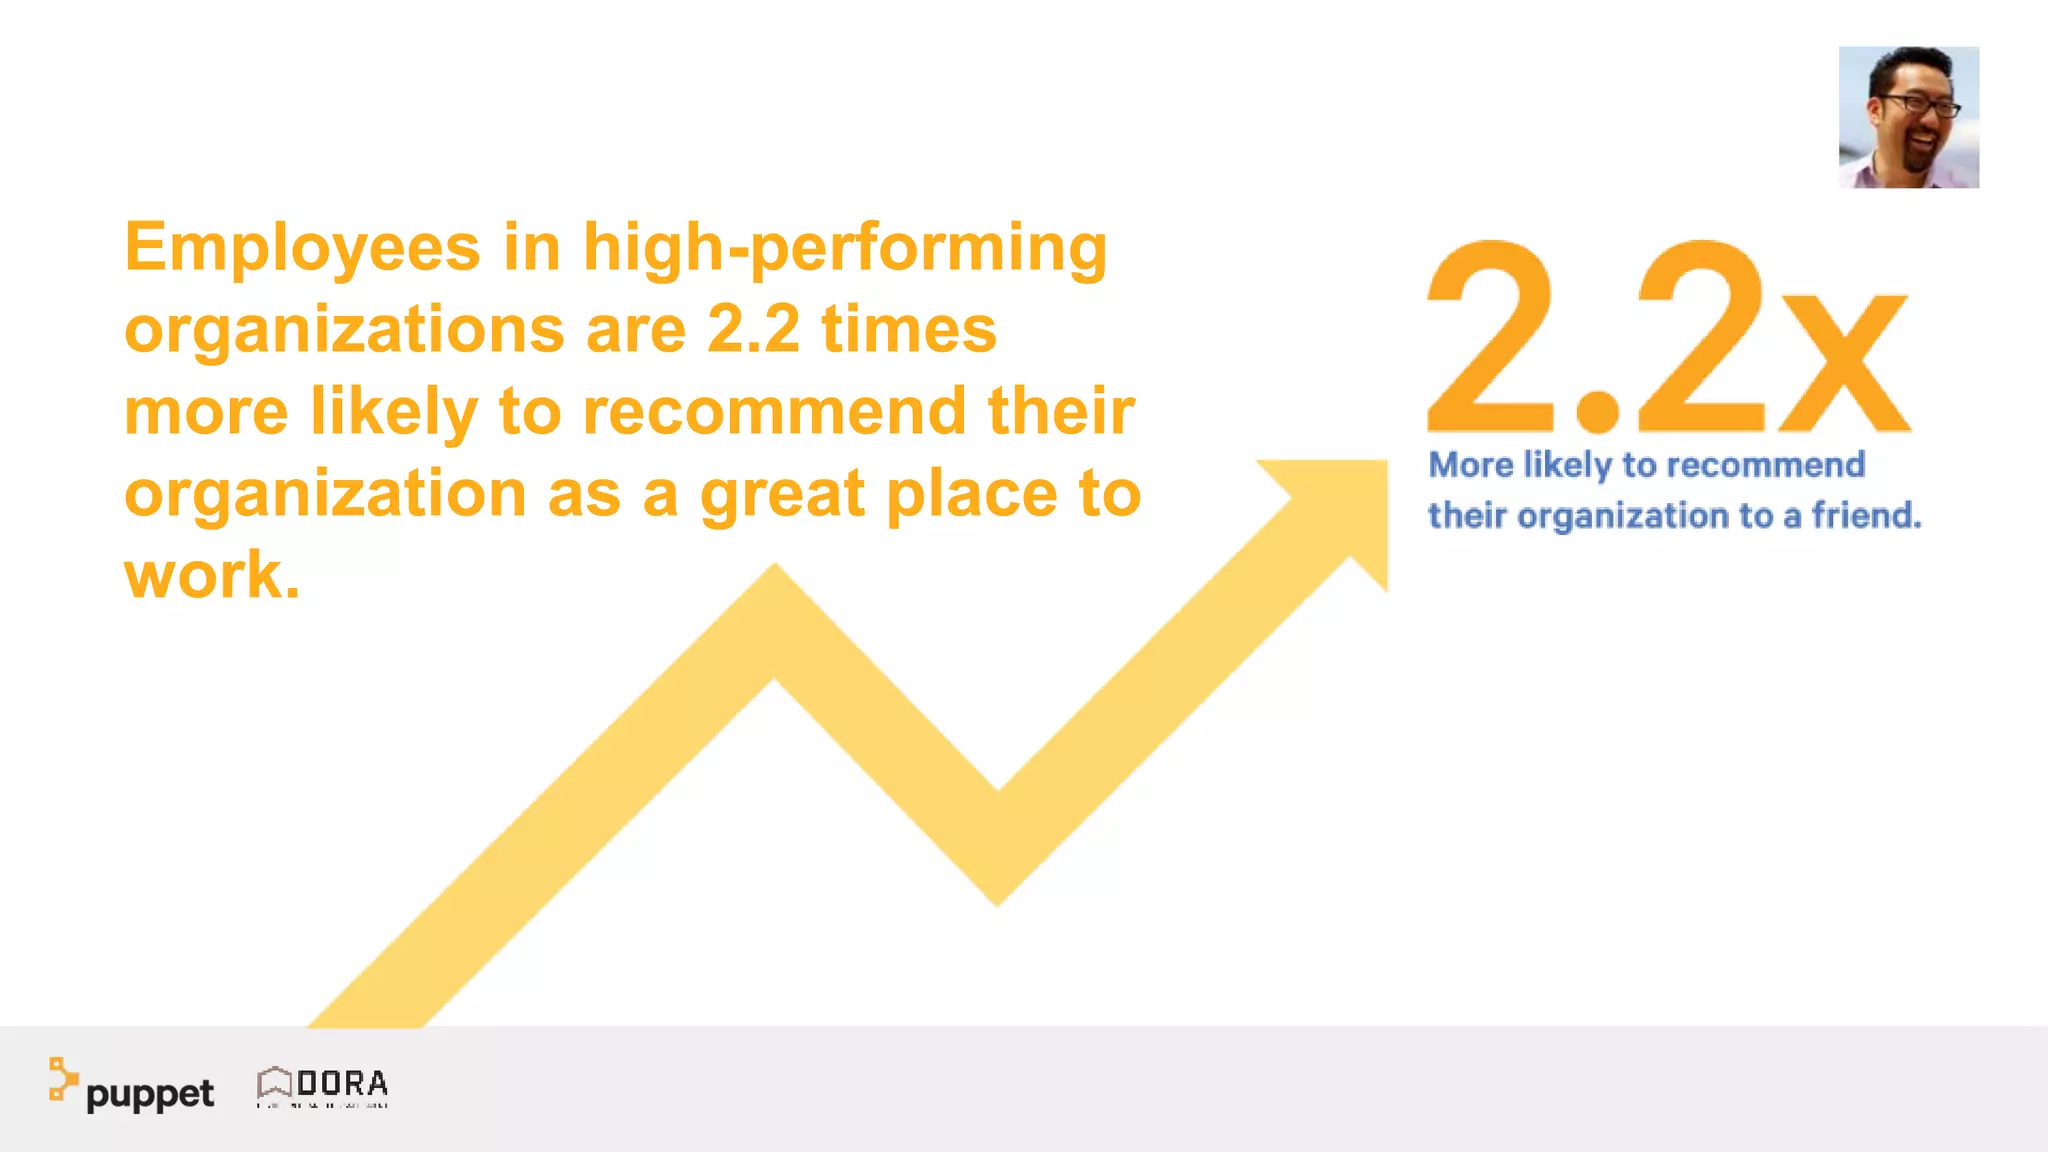
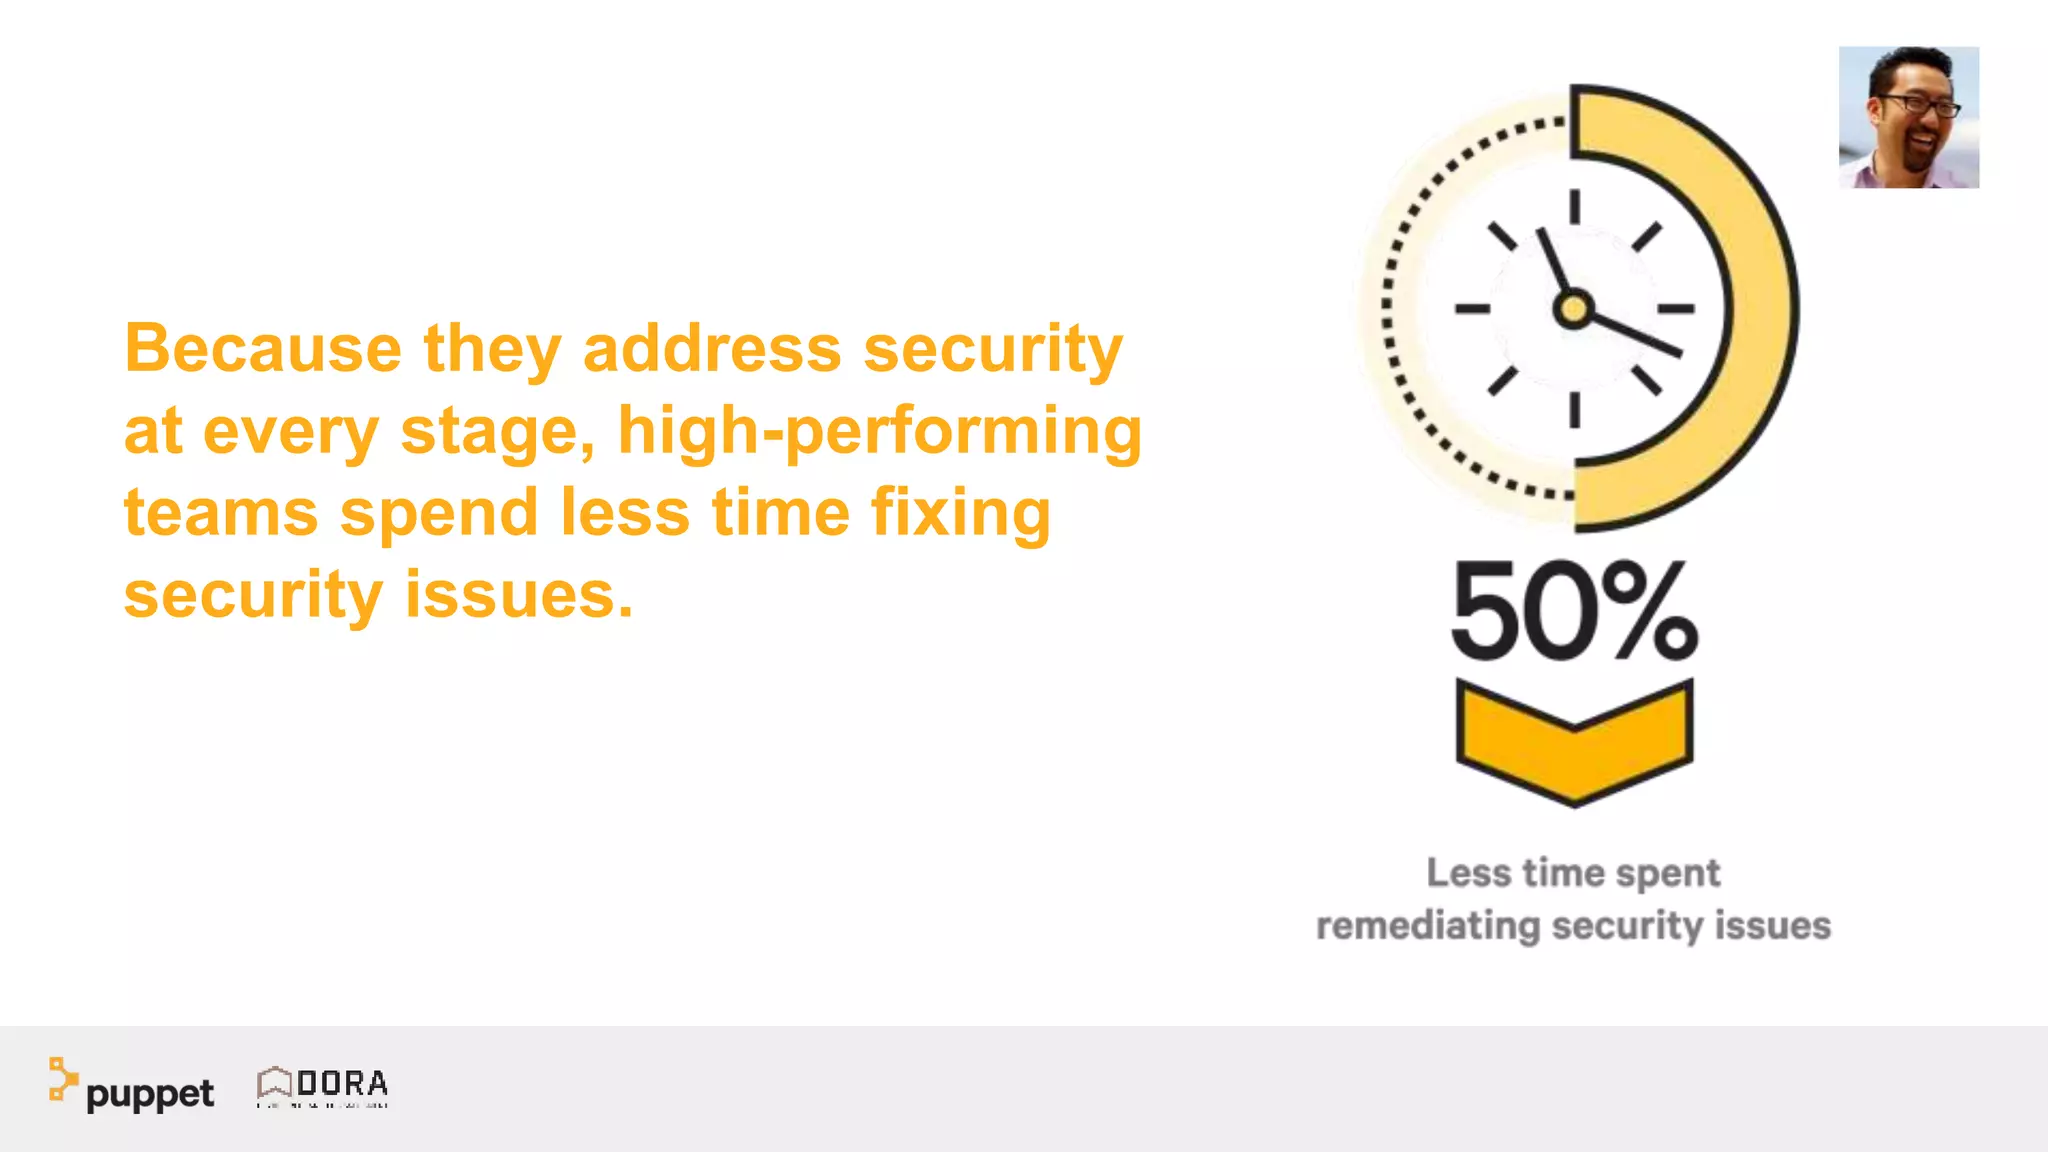
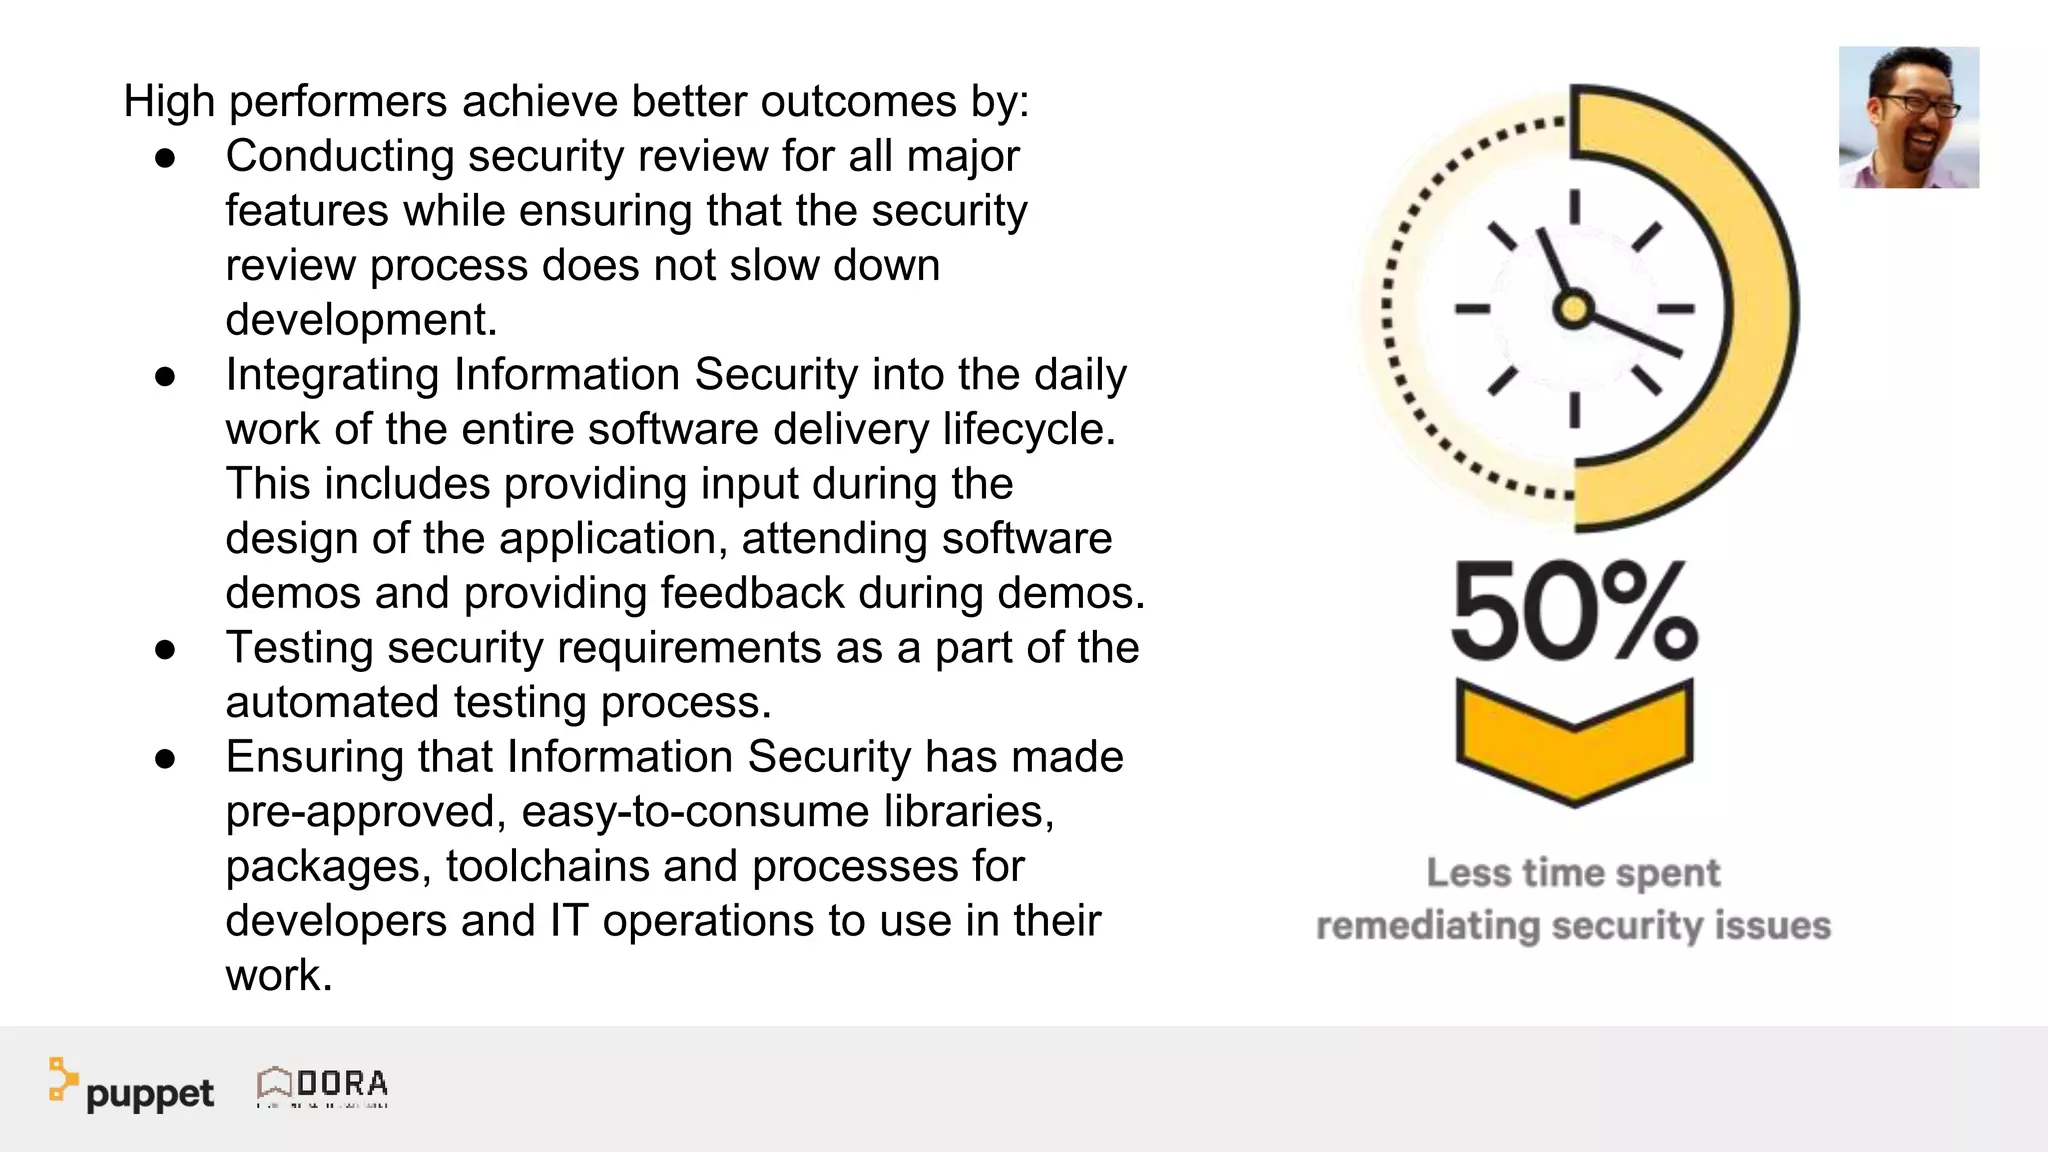
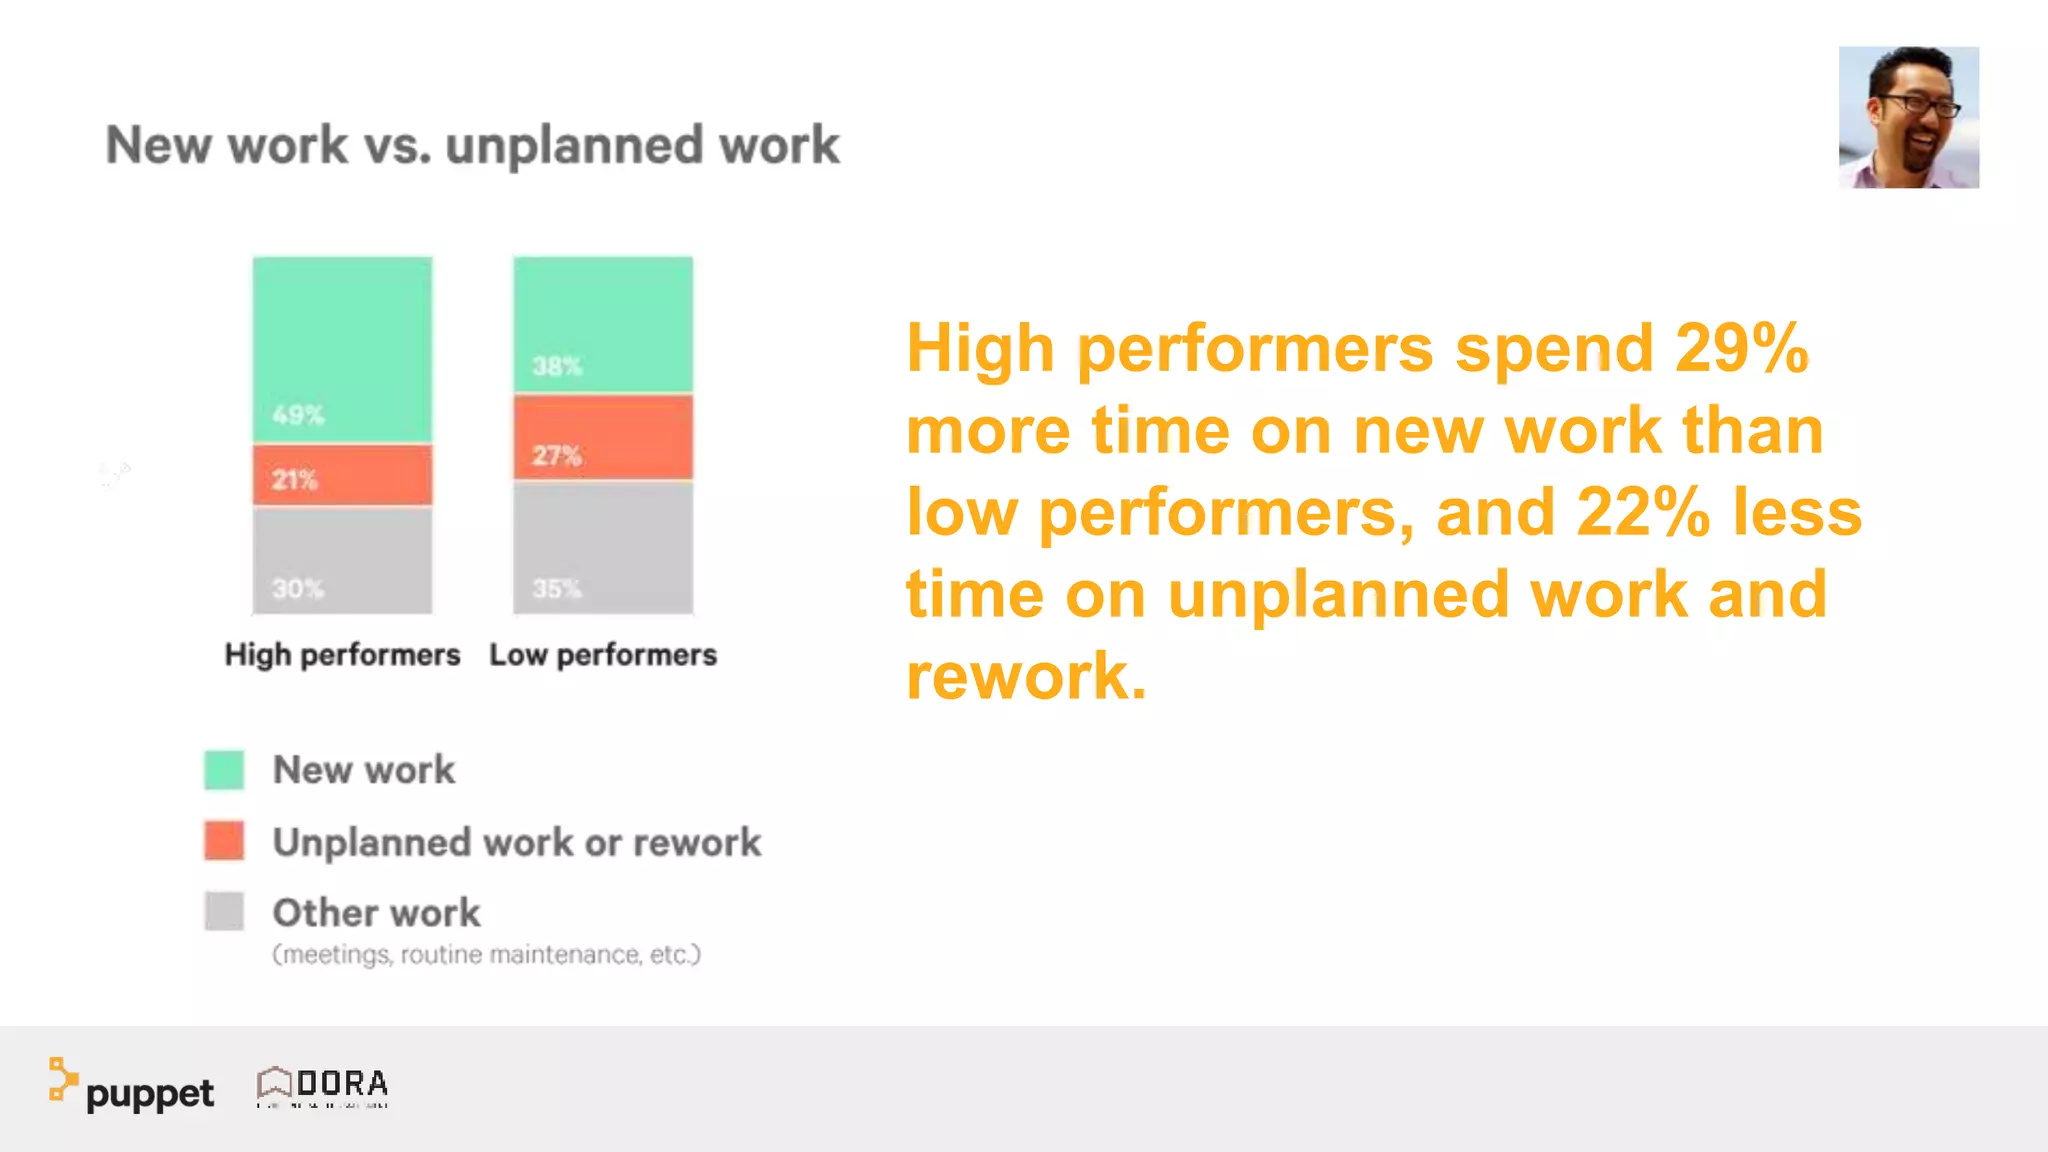
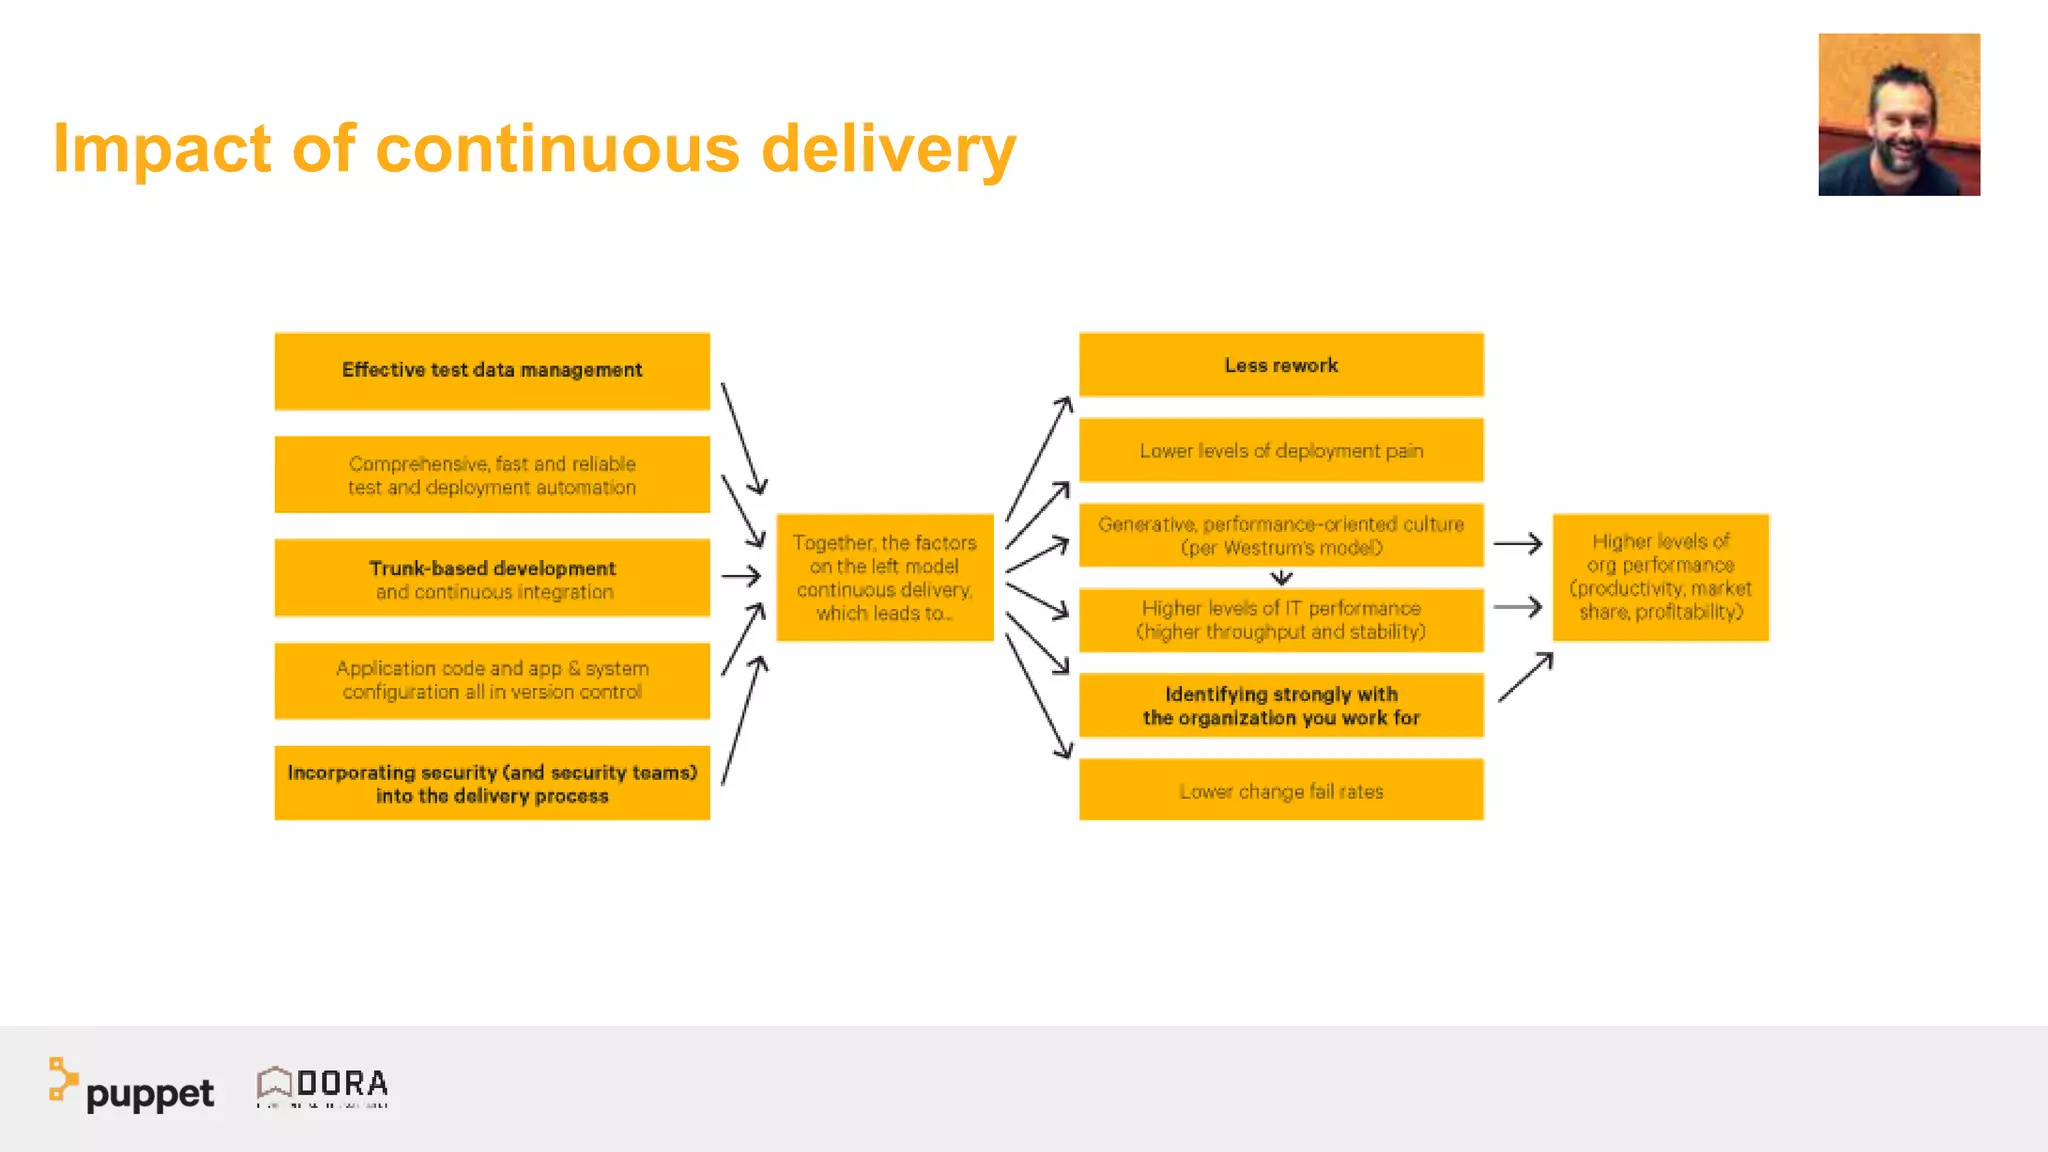
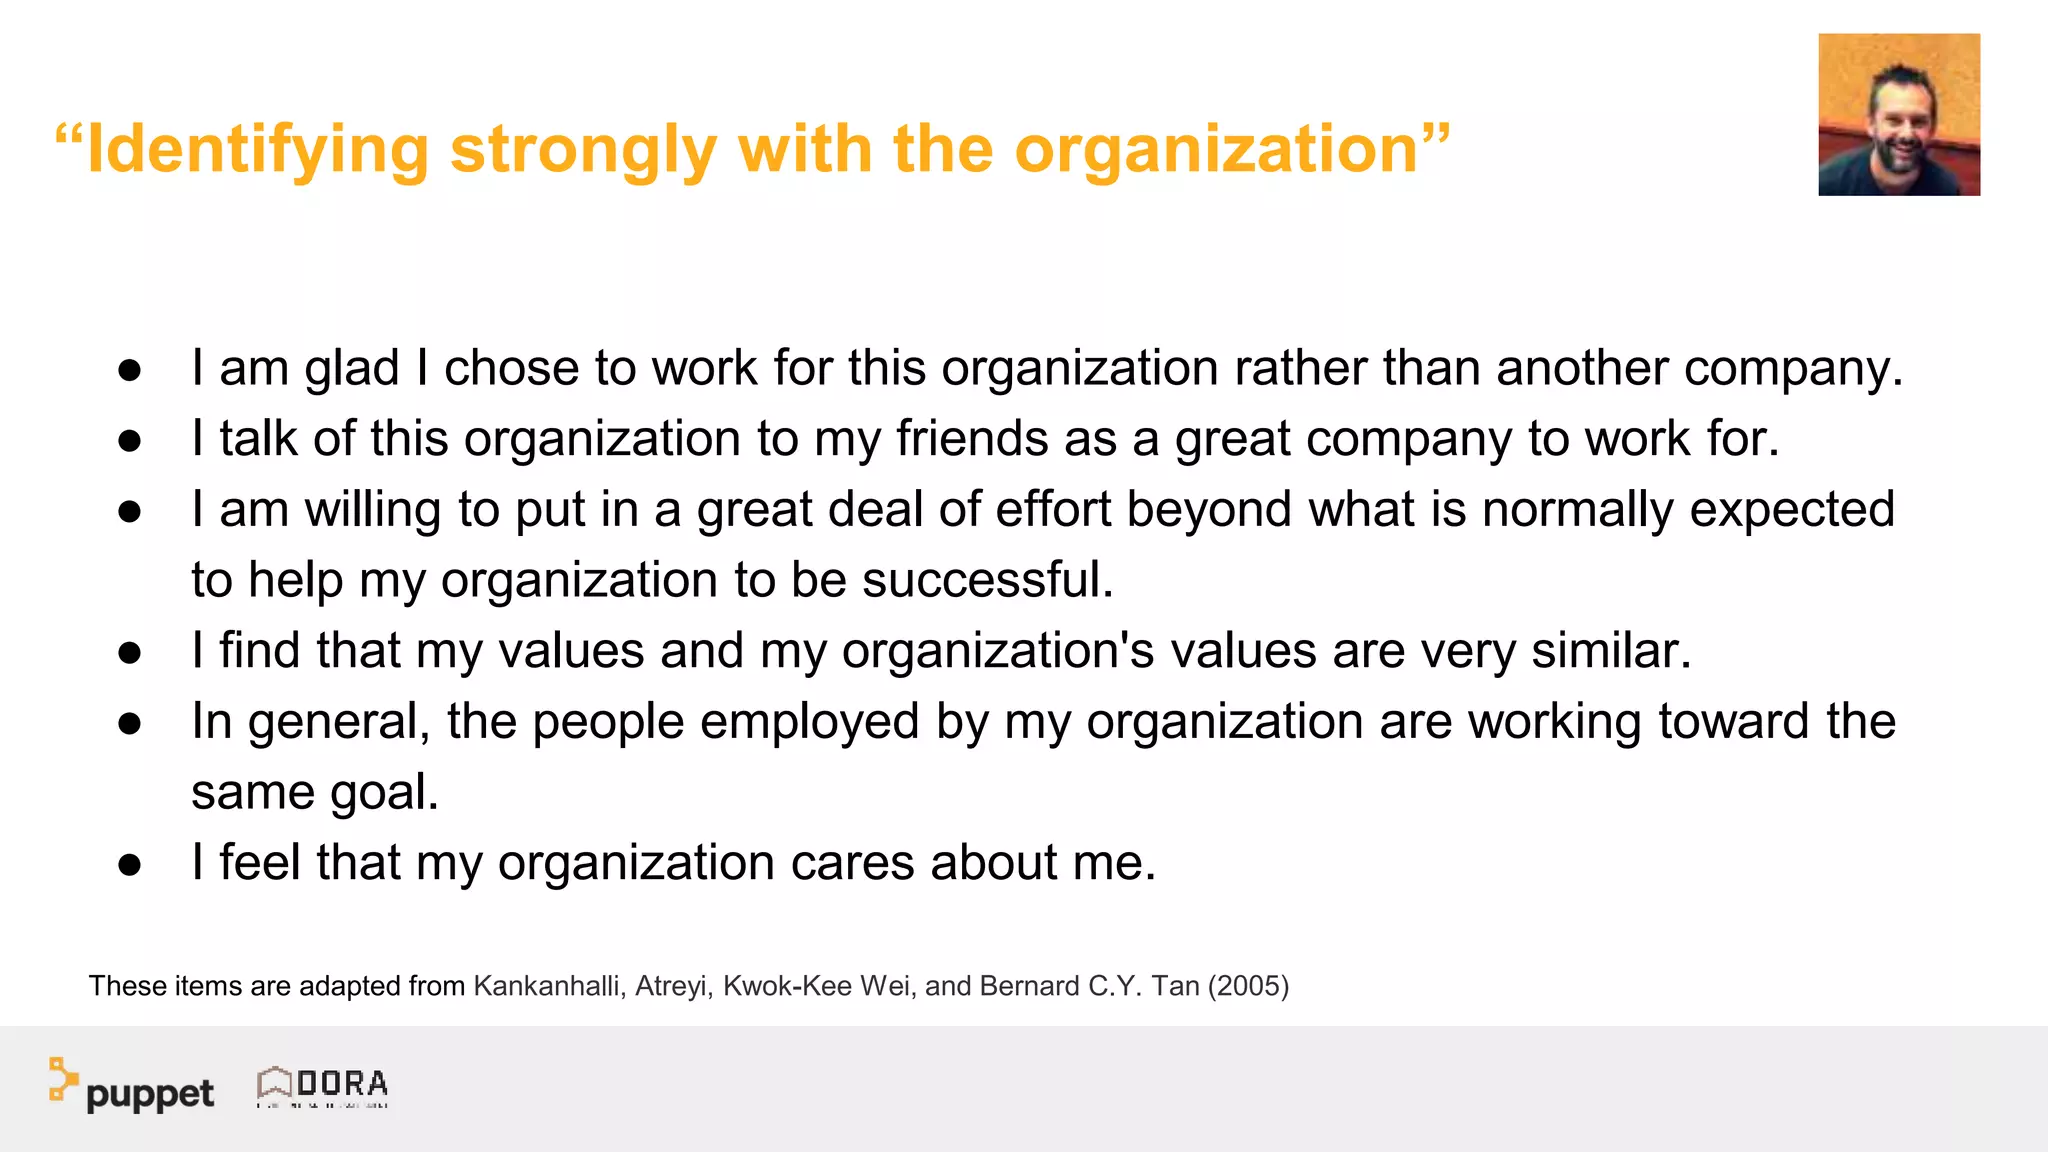
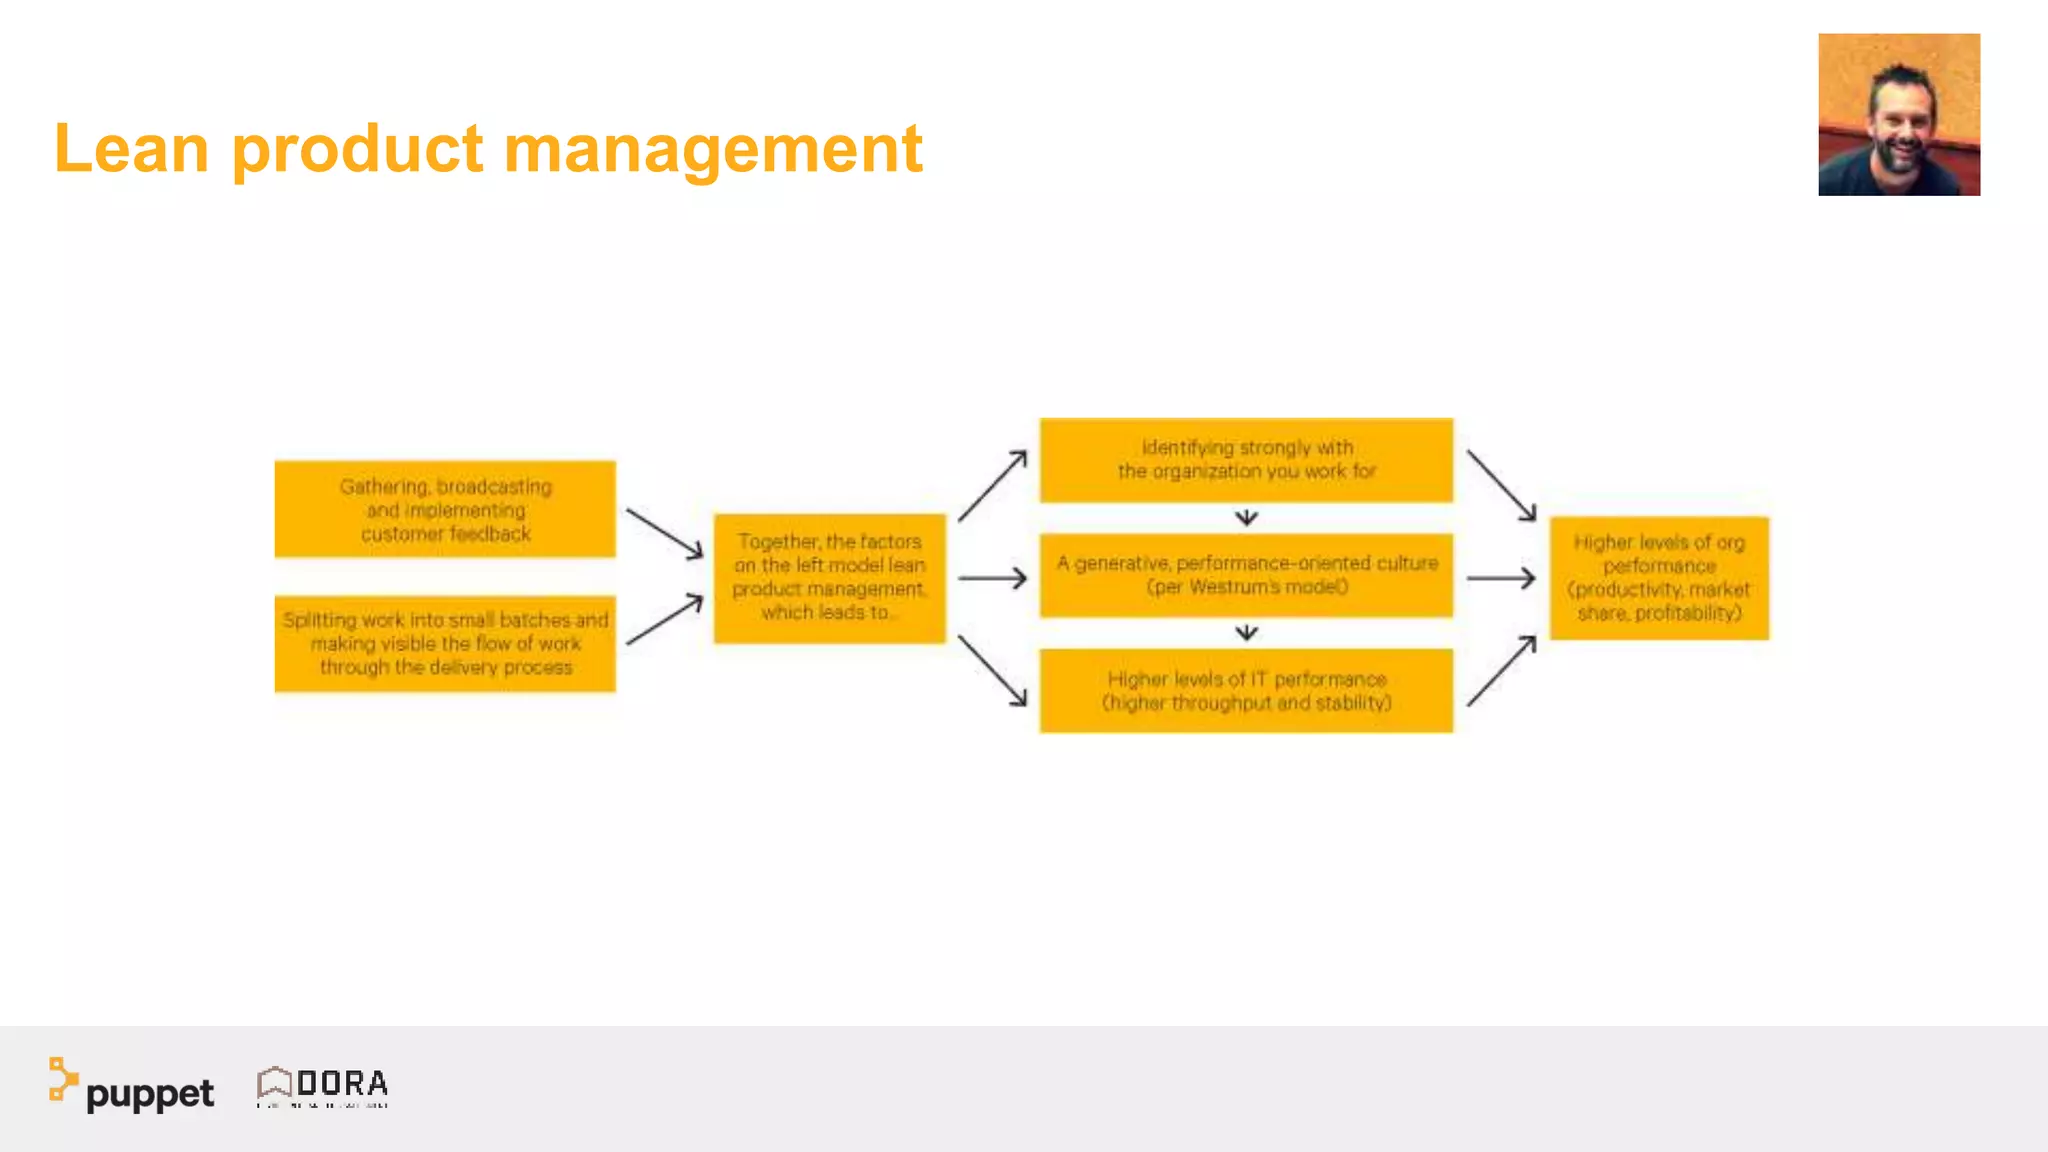


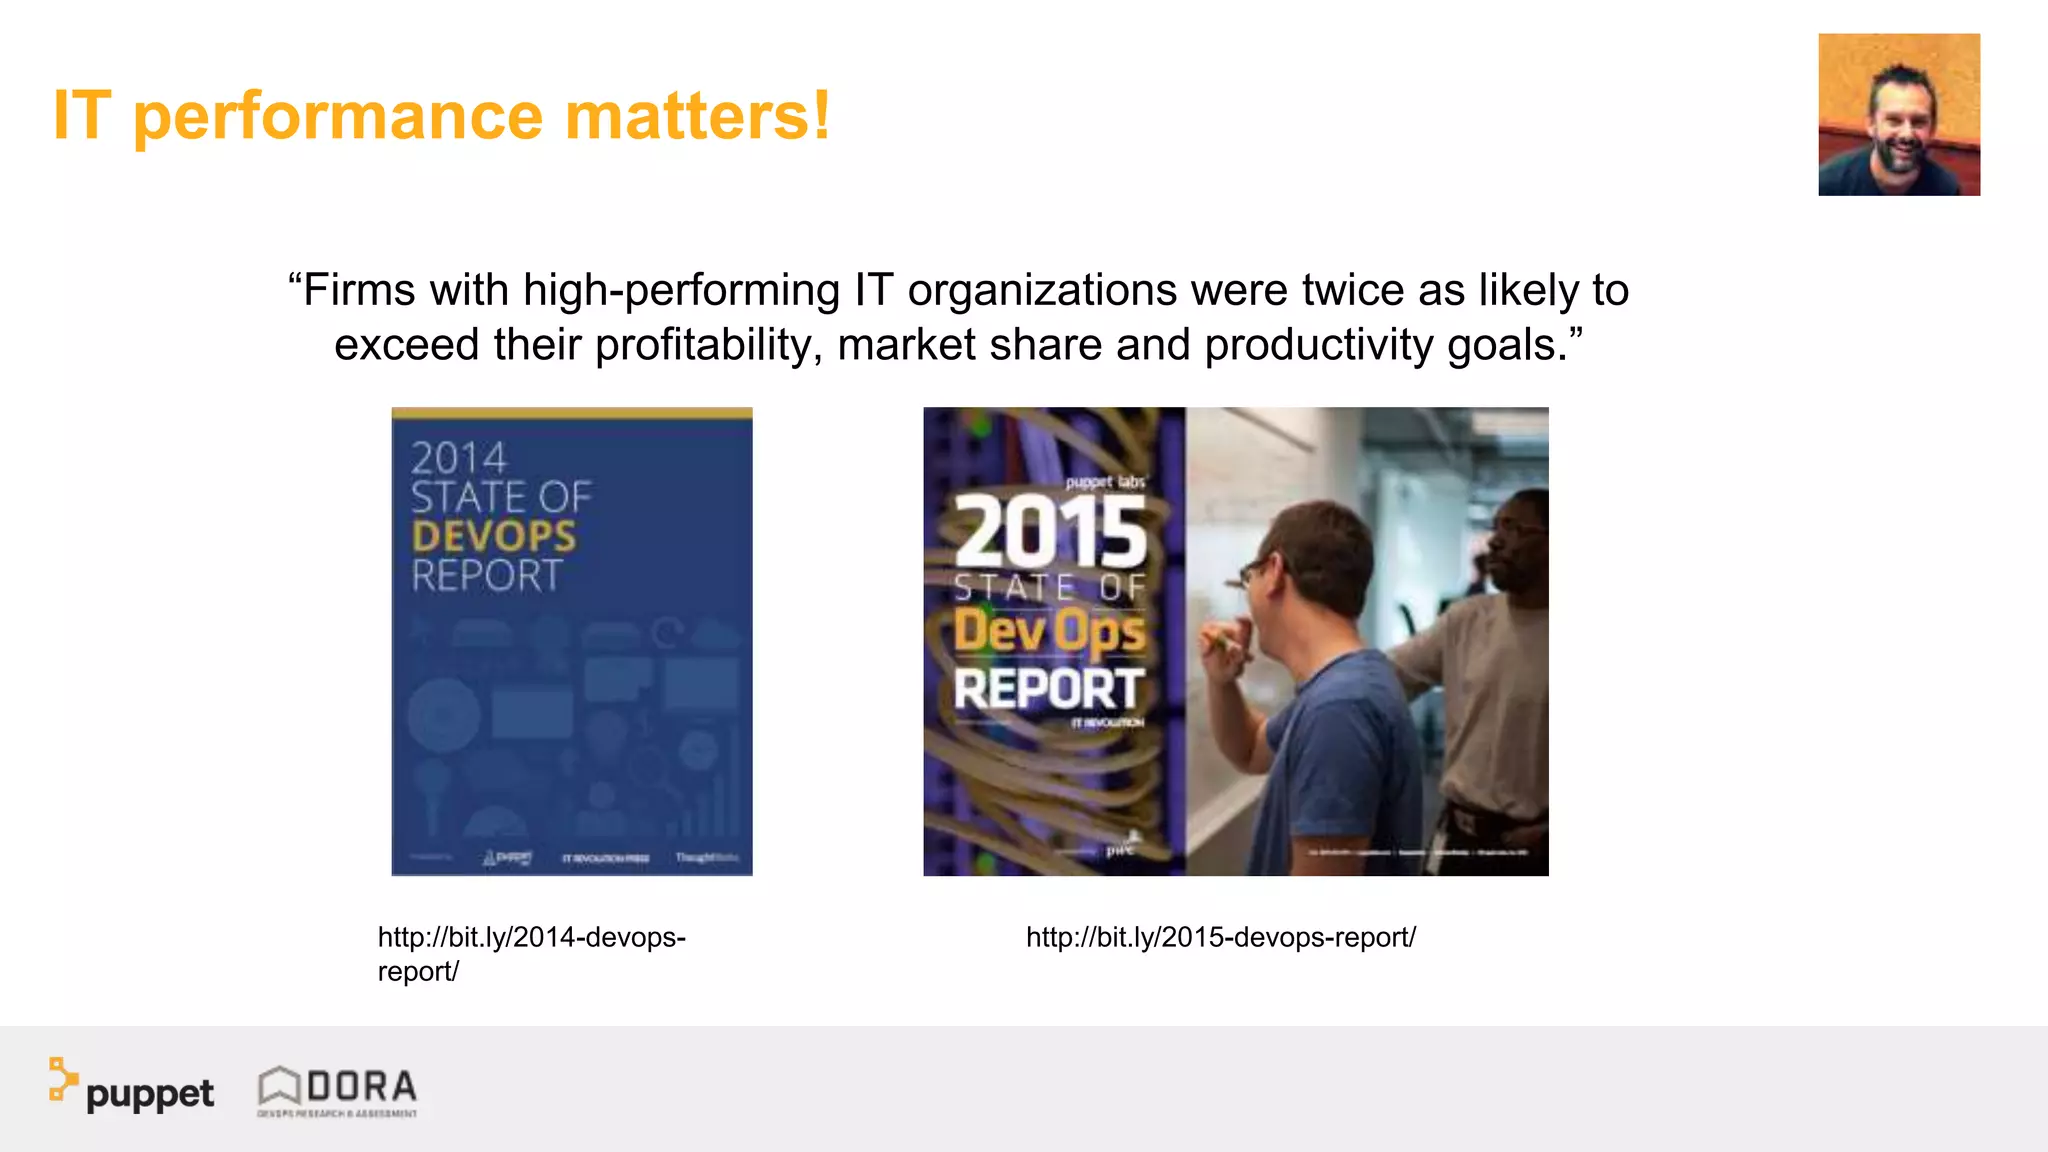
The document summarizes findings from the 2016 State of DevOps Report. It shows that high-performing organizations outperform their peers in terms of throughput and lead time for changes. Employees in high-performing organizations are more likely to recommend their organization as a great place to work. These organizations spend less time fixing security issues by addressing security at every stage of development. The document also discusses how high performers spend more time on new work and less time on unplanned work and rework through the use of continuous delivery practices.


![Vibe Coding vs. Spec-Driven Development [Free Meetup]](https://cdn.slidesharecdn.com/ss_thumbnails/vibecodingvsspecdrivendevelopment-251209105622-43f455e7-thumbnail.jpg?width=640&height=640&fit=bounds)


