Aggregatecreation
•
1 like•727 views

This is a reprinted version of a Power Point found on line. I did not create this but must store it here for quick reference to share with elected officials.

Recommended
Recommended
More Related Content
What's hot
What's hot (20)
Viewers also liked
Similar to Aggregatecreation
Similar to Aggregatecreation (20)
More from louisette lanteigne
More from louisette lanteigne (10)
Recently uploaded
Recently uploaded (20)
Aggregatecreation
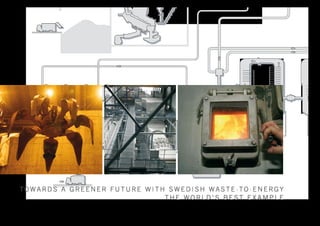
- 1. To w a r d s a g r e e n e r f u t u r e w i t h S w e d i s h W a s t e - to - e n e r g y The world’s best example
- 2. Torsviksverket in Jönköping, which was commissioned in 2006, incinerates 20 tons of waste every hour. Photo: Anders Arvidsson 2
- 3. WAS T E – T O – ENERGY Each Swede produces just over 500 kg or half a ton Waste to energy is a well-established source of energy in of household waste every year. Thanks to the efficient Sweden. The first incineration plant started operation in. waste management in Sweden, the vast majority of this During the later part of the 1940s, the district-heating household waste can be recovered or reused. Only four network was expanded in connection with the exten- per cent is landfilled. sive construction of new buildings following the Second World War. During the 1970s, the major expansion of Just over two millions ton of household waste is treated waste incineration plants started. by waste to energy in Swedish plants every year. These plants incinerate a similar quantity of waste from in- Sweden has had strict standards limiting emissions from dustries as well. Waste incineration provides heat corre- waste incineration since the mid-1980s. Most emissions sponding to the needs of 810,000 homes, around 20 per have fallen by between 90 and 99 per cent since then cent of all the district-heating produced. It also provides thanks to ongoing technical development and better electricity corresponding to the needs of almost 250,000 waste sorting. homes. International comparisons show that Sweden is the global leader in recovering the energy in waste. Swedish waste to energy is an environmental, financial, safe and stable contribution to the country’s energy supply. 3
- 4. EN V IRONMEN T AL BENEFI T S OF WAS T E T O ENERGY Waste to energy is a recovery method that provides a no conflict between the different methods. In Sweden, landfills as a processing method, and emissions of the significant part of Europe’s energy needs. One example just under 50 per cent of household waste is material- greenhouse gas methane from landfills has thus fallen of this is that around 50 million tons of waste are proc- recycled; a slightly smaller proportion goes to waste to dramatically. The waste sector reduced emissions of essed through incineration every year throughout Eu- energy. Only four per cent of household waste is sent to greenhouse gases by 34 per cent during the years 1990- rope. This corresponds to the heat requirements for the landfills. 2006. A forecast from Klimatberedningen (the Climate populations of Sweden, Norway, Iceland, Finland, Den- Committee), appointed by the Swedish parliament and mark, Estonia, Latvia and Lithuania. In Sweden alone, Waste should be managed based on its properties, and government, calculated that emissions will fall by 76 per waste incineration generates as much energy as 1.1 mil- this means that there is no standard solution for choos- cent during the years 1990-2020. lion cubic metres (m³) of oil, which reduces carbon di- ing the treatment method. The different methods – ma- oxide (CO2) emissions by 2.2 million tons per year. This terial recycling, biological treatment, and waste to en- Since the mid-1980s, incineration capacity has trebled is as much CO2 as 680,000 petrol-powered cars emit in ergy – must be combined to achieve the best results. and energy production has increased five-fold, while a year. The choice of treatment method varies based on type of emissions have fallen by almost 99 per cent.. waste, local and geographical conditions and how well The EU’s rules for waste management, the so-called the waste is source separated. When all the factors are waste hierarchy, state that we should initially strive to considered, the objective is the optimum environmental avoid creating waste at all. The following stages are re- and social benefit. use, material recycling, other recycling – e.g. energy recovery – and finally disposal. The waste generated by households, industries and oth- Facts: Environmental permits In order to operate a waste to energy plant, as with other environmentally-hazardous activities, a permit is required in accordance with the Swedish Environmental Code. The permit is issued by the County er activities reflects our consumption habits. Hazardous Administrative Board or the Swedish Environmental The volume of waste produced in society is affected substances found in commodities and products persist Court. This is preceded by an investigation, where by many different factors and is largely dependent on when the products become waste. This places tough de- the municipal environmental councils, local residents the economic situation. By using resources effectively, mands on all waste management, so that harmful sub- and the public are able to offer their opinions. Prior to changing patterns of consumption and prolonging stances are not spread. During incineration, many harm- product lifetimes, it is possible to reduce the volume of ful substances break down and the residual substances waste. are bound in ash, which makes them easier to control, should include issues relating to emissions into the handle and recycle. air and discharges into water, noise and transport. an environmental impact report that describes the environmental impact of the plant in detail. This When assessing the activity, account must be taken Several European studies have shown that countries with a high proportion of material recycling also have a high 4 the investigation, the business operator must submit Landfilling of organic waste has been forbidden in Swe- proportion of energy recovery from waste. Thus, there is den since 2005. Waste incineration has largely replaced of the local situation, alternative solutions and localisations.
- 5. Facts: Less emissions – more energy • Incineration, energy production and dioxin into the air from waste incineration 1985-2006 The waste sector will reduce its emissions of greenhouse gases by 76 per cent during the MWh/tons years 1990-2020, according to the Climate Dioxin gram 14 000 000 90 10 000 000 75 8 000 000 60 6 000 000 45 4 000 000 30 2 000 000 • 105 12 000 000 Committee’s forecast. 15 Waste incineration in Sweden produced as much energy in 2007 as 1.1 million m³ of oil, which reduces CO2 emissions by 2.2 million tons per year, as much as 680,000 petrol-powered cars emit in a year. • Despite waste incineration increasing, emissions have fallen. For example, emissions of heavy metals from waste incineration into the air have fallen by almost 99 per cent since 1985. In addition, the total emissions of dioxins from all of the country’s waste incineration plants have fallen from around 100 g to less than 1 gram during the same period. Reduction in emissions Dust (ton/year) 1985 420 2007 Change 24 - 94.3% HCl (ton/year) 8,400 3,400 196 - 94.2% NOx (ton/year) 3,400 2,101 - 38.2% Hg (kg/year) 3,300 36 - 98.9% Cd (kg/year) 400 6 - 98.5% 25,000 1985 1990 1995 1999 2000 2001 2002 2003 2004 2005 2006 2007 0 60 - 99.3% SOx (ton/year) 0 51 - 99.8% Pb (kg/year) Energy production (MWh) 1,432,100 Incineration, tons Dioxin (into the air), grams 2,800,000 1,2151,270 334.0% Processed waste (ton) Energy production, MWh 4,470,690 212.2% 5
- 6. WHY SWEDEN HAS BEEN SO SU C C ESSFUL Sweden is the global leader when it comes to dealing The Swedish municipalities’ responsibility for household From having been mainly a sanitary problem where waste with and recycling waste. Waste management is being waste constitutes a prerequisite for development of long- would have been disposed of in order not to spread sick- continuously developed and is the result of long-term, term sustainable waste management. During the 2000s, ness and disease, waste management has become a patient work, not least on the part of municipalities and development has been driven by the interplay between symbol of environmental work. In order to reduce the their companies in cooperation with private players. This private, state and municipal companies and plants. Con- presence of waste and the danger associated with it, has required risk-taking in order to develop new tech- structing a new plant involves high investment costs and as well as to increase reuse, recovery and utilisation of nology and the courage to make large, but necessary, there must, therefore, be a market for the heat produced. waste, the responsibility for waste needs to be regulated. infrastructure investments. This has given inhabitants a The developed district-heating network in Sweden has In addition, a number of different controls – financial good level of service and increased recycling. In order to been a guarantee of that. District-heating has a long tra- and informative – are required in order to strive towards bring this about, well-functioning cooperation between dition in Sweden; the first district-heating network was the agreed objectives for waste management. and within municipalities has been necessary. taken into use back in 1948. For some waste categories, special legislation has been Swedish waste management has three categories of Avfall Sverige – Swedish Waste Management has had a issued. The aim has been, among other things, to reduce players with responsibility for waste. It is the local mu- profound influence on the development through joint resource wastage, to limit emissions of hazardous sub- nicipalities who are responsible for household waste, the research and development projects and the exchange of stances or to phase out the use of certain substances producers who are responsible for their respective prod- experience between plants. uct groups, and industry/the business community when responsibility for waste does not fall on the two others. 6
- 7. that have no part in a ecocycle society. Special legislation applies, for instance, to electrical waste and batteries. Treatment methods for household waste 1998-2007 2 500 000 EU decisions determine the framework for Swedish waste management. The Swedish parliament’s environ- 2 000 000 mental objectives provide the overall, governing objectives for the environmental aspect of waste management. A number of laws and other control measures 1 500 000 introduced during the 2000s have deliberately moved waste management away from landfills towards material and energy recovery instead. 1 000 000 500 000 0 1998 1999 2000 2001 2002 2003 2004 2005 2006 2007 Material recycling including biological treatment, tons Waste to Energy, tons Landfill, tons 7
- 8. Some examples of laws and control measures that apply At the same time, a number of other rules to regulate to the waste field: waste incineration have been introduced: • • The Environmental Code, which came into force on 1 January 1999 • The EU landfill directive was adopted in 1999 • in 2002. The tax on waste for landfills (SEK 250/ton) was introduced in 2000 • • Facts: The Waste Framework Directive 2008 An ordinance on waste incineration was introduced • on a strategy for prevention and material recy- An ordinance and regulation about waste incinera- cling of waste. Member states must work to sever tion came into force in 2005. • The EU’s new waste framework directive is based the link between economic growth and increased A tax on household waste for incineration was intro- quantities of waste. The ordinance on landfilling of waste was intro- duced on 1 July 2006. The tax payable is depend- duced in 2001 ent on whether the incineration plant liable to pay A ban on landfilling of sorted combustible waste tax produces electricity, and if so, how effectively. was introduced in 2002 For plants without electricity production, the tax is • The landfill tax was raised to SEK 370/ton in 2003 around SEK 500/ton, which then falls with increas- • A ban on landfilling organic waste was introduced ing electricity production. If electricity production ment option that provides the best environmental in 2005 is effective, the tax is around SEK 100/ton. benefit, but can deviate from the hierarchy for • • • The landfill tax was raised to SEK 435/ton in 2006 • duced in the framework directive. The five stages are waste prevention, reuse, material recycling, other recycling – e.g. energy recovery – and finally disposal. Member states must apply the manage- technical, economic or environmental reasons. • All landfills must have fulfilled the requirements of trols for emissions into the air and discharges into wa- The Framework Directive 2008. ter, and the tax on household waste for incineration was Sweden already has a high level of waste legislation, the effects of the new framework directive will probably be less than in many other EU introduced to increase biological treatment, as well as increase plastics recycling. In addition to these examples, there are over one hundred laws and ordinances that apply to issues related to waste management. 8 Member states must introduce the new framework directive for waste in their legislation. As The legislation involves, among other things, tighter con- tinue to receive waste. The five stages of the waste hierarchy introduced as a priority scheme for handling waste are intro- BREF 2006. the 2008 landfill directive in order to be able to con• • countries. • Efficient energy recovery now counts as recycling.
- 9. T h e r e g u l at i o n s – a f e w e x a m p l e s Landfill tax The waste framework directive Green certificates The waste incineration directive Waste incineration tax Control measures for biological treatment Change in energy and environmental taxes Standardisation of solid recovered fuels Landfill ban on organic waste Waste system The landfill directive Waste incineration Combined heat and power taxation Energy system Green tax reform Landfilling by dispensation Facts: The waste incineration directive The EU’s directive on waste incineration was introduced in Sweden in 2002. It has applied to all member states since 2006. The aim of the directive is to prevent or limit the negative impact on the Facts: Best available technology Waste incineration has its own, extensive BREF docu- In order to guarantee environmentally-sound management, the Best Available Technology (BAT) is a concept often nologies currently available. The document also speci- directive contains a number of requirements in terms of the used in various contexts. The EU has produced de- fies expected normal performance expressed in, for technical design of incineration plants. It also contains a number scriptive reference documents (BREF) on what is con- instance, energy consumption. of emission limit values that must not be exceeded. The technical sidered BAT within various sectors. The documents In order for a technology to be considered a BAT, it requirements and limit values were introduced, in part, to prevent have been produced through the exchange of infor- must not only be efficient, but the costs associated waste being transported to countries within the EU with lower mation between the EU, suppliers, plant owners and with it must also be reasonable in proportion to per- environmental requirements others in a process regulated by EU legislation. Cur- formance. The introduction of this directive also led to a number of Swedish rently, there are around 25 different BREF documents The document can be downloaded from http://eippcb. plants being rebuilt to fulfil the new requirements. linked to various sectors, and a few more are currently jrc.ec.europa.eu/pages/FA ctivities.htm. environment from waste incineration, specifically from pollution due to emissions into the air, ground or water. mentation with a good overview of the various tech- in preparation. 9
- 10. WAS T E AS FUEL Recovering energy from waste exploits a resource that Around 50 per cent of the waste treated in Swedish would otherwise be wasted. At the same time, it is im- waste to energy plants is household waste. The rest is portant that waste has been source separated. It must waste from industries and other commercial activities. not contain hazardous waste, batteries, light bulbs or Waste from industries and other activities often contains other electrical waste. Nor should it contain packaging sorted fractions with a more homogeneous composition, or newspapers. These should be sorted out and left for but the fractions differ significantly from various activi- material recycling. Metal should also be removed, as ties. metal is a raw material with a very high recycling value. Metals can also cause problems in the incineration proc- Household waste sent for incineration varies slightly de- ess with unnecessary wear and unforeseen operational pending on which municipalities the plant has signed stoppages at the plant as a result. Plaster should also agreements with. Normally, waste sent for incineration be removed. Plaster, which is a chemical compound is source-separated combustible household waste. Re- containing calcium and sulphur, provides no energy. The quirements for fuel properties are set for other waste sulphur in waste is a burden on flue-gas cleaning and supplied to the plants. The waste should, for instance, that is, therefore, one reason for not leaving plaster in not have too high a moisture content or contain material combustible waste. that is unsuitable for incineration. Random testing and inspections when the waste is received at the plant help to ensure that the requirements are fulfilled. 10
- 11. Facts: Sorted fuel • Household waste must be source separated. Hazardous waste, batteries, light bulbs and other electronic waste must always be taken to the municipality’s collection point. Take metal, glass, plastic, paper, newspapers and food waste – where possible – for material recycling. Other household waste can best be used for energy recovery through incineration. • 50 per cent of the waste treated in Swedish waste to energy plants is household waste. The rest is waste from industries and other activities. • The plants carry out quality checks of the incoming waste in order to ensure that unsuitable material has not been sent for incineration. In 2006, the combined heat and power (CHP) plant for waste fuel at Korstaverket in Sundsvall became operational. Photo: Torbjörn Bergkvist 11
- 12. T HE WAS T E ROU T E T HROUGH A MODERN PLAN T This is an example of a modern plant. All plants are de- 3. signed according to local conditions. In the furnace, the temperature is normally around 1,000 degrees C, and no fuel other than the waste is required. 1. The waste burns under a stream of air before dropping The waste arriving at the plant must be weighed and onto a bed or grate. The hot flue gases rise upwards. quality-checked. The combustible waste is tipped down There is often also an oil burner in the furnace which is a bunker. This is often designed to hold several days of used to start and stop the furnace. waste deliveries in order, for instance, to be able to cope with long weekends. The bunker in one of Sweden’s larg- 4. est plants contains 12,000 m³ waste. All combustible material is consumed. What is left is known as ’slag’. The slag drops down into a water-filled 2. trough and is transported to be sorted and recycled. An overhead crane controls the grab bucket and the waste is released into the feed hopper, from where it is 5. fed into the furnace. The overhead crane mixes the waste The actual furnace contains long welded pipes. The total in the bunker before transferring it to the feed hopper. In length can be tens of kilometres long. There, the furnace order to ensure even, controlled incineration, it is also water is circulated and heated to steam by the hot flue important that the feed from the feed hopper into the gases. The greater the pressure and temperature of the furnace takes place in a well-controlled way. steam, the greater potential for electricity production. At the same time, increased pressure and temperature also lead to a greater risk of corrosion and increased maintenance costs. 12 1
- 13. 5 2 3 4 13
- 14. 6. Due to the high temperature and steam pressure, it is varies between 70 and 120 degrees, depending on the possible to recover electricity, cooling and heat. The su- external temperature. The water is then transferred back perheated steam is transported to the turbine, which to the plant to be reheated. District-cooling is based on then drives the generator. the same principle as district-heating, but instead of providing heat, it provides cooling. Cold water is distrib- 7. uted in a pipe network and cools the air in the ventila- In the generator, the movement of the turbine is trans- tion system. The water is then transferred back to the formed into electrical power, which is delivered to the production plant to be cooled again. electricity network. 10. 8. Electricity from waste to energy plants in Sweden cor- Once the steam has passed through the turbine, it still responds to the domestic requirements of 250,000 contains a lot of energy, which is used as district-heat- homes. ing. In a heat exchanger, a condenser, heat is transferred from the steam to the water in the district-heating net- 11. work. The steam is condensed into water and pumped Once the energy has been extracted from the waste, back to the furnace. the flue gases are cleaned. First, they pass through an electrostatic percipitator, where most of the dust is re- 9. The heat produced by Swedish waste to energy plants tive electric charge. The particles then stick to large met- corresponds to heat demands of 810,000 homes. The al plates that are positively charged. The dust particles hot district-heating water is distributed via well-isolated are shaken from the plates, collected at the bottom, and pipes out to customers. The temperature of the water 14 moved. Here, electrodes give the dust particles a nega- then transported to an ash silo. 11
- 15. 7 6 8 10 9 This is an example of a modern plant. All plants are designed according to local conditions. 15
- 16. 12-14. The next stage of cleaning involves washing the flue principle in the same way as a catalytic converter in a gases with water. This is done in towers, known as scrub- car. The flue gases pass through a fine porous, ceramic bers. Nozzles spray a fine mist of water over the flue material and, to achieve optimum effect, an ammonia gases. The water contains various substances, such water solution is added. The nitrous oxides, which have as lime, which reacts with the gas and cleans it. In the an acidifying effect, are then converted into nitrogen. 79 first scrubber, heavy metals and acidic substances are per cent of air consists of nitrogen. Another common washed out. The next scrubber removes sulphur dioxide, method is to reduce the nitrous oxides using SNCR or with the third condensing any moisture remaining in the Selective Non Catalytic Reduction. gas. Heat is extracted from the condensed water using heat pumps. 16. The cleaned gas is fed out through the chimney. Harmful 15. substances have been removed, and what is released is, The final stage of the cleaning process is a catalytic con- in principle, only carbon dioxide and water. verter. This reduces the nitrous oxides and functions in 16 12
- 17. 13 15 14 16 This is an example of a modern plant. All plants are designed according to local conditions. 17
- 18. 17. Much of the pollution that was previously contained in the flue gas has ended up in the water from the scrub- Facts: Residues from waste incineration Facts: Fluidised bed boilers During waste incineration, residues form as slag, There are two dominant techniques for waste incin- bers. This water undergoes a number of cleaning treat- also called bottom ash, and there are also residues eration in Sweden, the grate-firing technique, repre- ments. With the help of various chemicals, heavy metals, from flue gas cleaning. The quantities of each residue sented in the plant description here, and the fluidised among other things, are precipitated and form a sludge largely depend on which incineration technique bed technique. There are different types of fluidised that sinks to the bottom of the largest tank, from where is applied – grate-firing or fluidised bed – but the bed boilers. Common to them all is that incineration average in Swedish is around 15 per cent by weight of waste takes place in a sand bed instead of on one of slag and just under 5 per cent by weight of flue or more smaller inclined/moving bases, grates. Air is gas residue. The slag consists of the non-combustible blown in from underneath, causing the sand to lift. 18. material in the waste and contains, among other The waste is then fed in, forms a good mixture and is The pH of the water is adjusted and the water is filtered things, metals that are separated and recycled. incinerated. The sand makes it easier for the air to be through a sand filter and a carbon filter before it is re- Through screening and storage, a fraction known as distributed evenly, which provides better incineration, leased. slag gravel is recovered. This has excellent properties provided the waste is also distributed evenly. In order for construction purposes. The slag gravel can be for the sand not to wear out the flue gas cleaning, it used instead of natural gravel for constructing roads is separated before the flue gas continues on to the and car parks, for instance. Residues from flue gas other cleaning processes. Choice of flue gas clean- The sludge from the water purification process is dealt cleaning consist of ash, which is separated by a filter, ing is independent on whether it is a grate-firing or with and finally stored in a safe way. or sludge, which is separated in the wet cleaning fluidised bed furnace is used. Fluidised bed boiler stages. These residues often have a higher content of are normally characterised by good incineration and heavy metals than slag, but they are hard bound and excellent environmental performance. However, this therefore must normally be dealt with by landfilling. technique is significantly more sensitive to the qual- The residues are basic, as a result of lime being used ity of the waste entering the furnace, which, in turns, during flue gas cleaning, and they can, therefore, also means that it places much greater demands on the be used to neutralise acidic waste. In some cases, fuel being pre-processed before it is incinerated. Ex- the dry residues are also used to refill and stabilise tensive fuel preparation is, therefore, required for a mines. fluidised bed boiler. This involves trying to remove as it is drained. 19. much of the metal as possible, as well as crushing the material so that it has a size of around 10x10 cm. The fuel preparation process can be right next to the boiler, but the waste can also be supplied to the incineration plant pre- treated, as per requirement specification. 18
- 19. 17 18 19 This is an example of a modern plant. All plants are designed according to local conditions. 19
- 20. HEA T , ELE C T RI C I T Y AND C OOLING Energy recovery from waste incineration has increased district-heating pipes are buried in the ground and well- heat and power production (CHP). The steam is fed into dramatically over the last few years. In 2007, almost insulated. The temperature of the hot water entering a steam turbine, which drives an electricity generator. 13.7 TWh energy was recovered through waste to en- the district-heating network normally varies between Once the steam has passed the turbine, there is still ergy, an increase of 19 per cent compared with the year 70 and 80 degrees C, but at low external temperatures, some energy left, which is used as district-heating. before. That energy is divided between 12.2 TWh heat the water temperature may be as high as 100 to 120 Electricity is a high-value form of energy that can easily and 1.5 TWh electricity. That is equivalent to the domes- degrees C. The temperature of the water in the pipe back be used for a number of different jobs. Electricity can tic electricity demands of almost 250,000 normal-sized to the plant is normally between 45 and 55 degrees C. also be transported long distances very easily. homes and heating for 810,000 homes. A small amount A district-heating unit, connected to the district-heating of the energy is now also being used to provide district- network via two pipes, is installed at the user’s end. The District-cooling cooling. unit contains two heat exchangers, one for hot water for District-cooling is based on the same principle as the taps and one for the radiators. The hot water, which district-heating, but instead of providing heat, it provides District-heating is used in the house, and the district-heating water, then cooling. Cold water is distributed in a pipe network and District-heating is produced by heating water and then circulates in two different systems. The cooled district- cools the air in the ventilation system. The water is then pumping it into district-heating pipes to homes, offices, heating water goes back to the district-heating plant to transferred back to the production plant to be cooled hospitals, industries, schools or other premises. The be reheated. again. The temperature of the water being sent out to the properties is around six degrees and the return water Electricity larger properties such as shopping centres, industries, under high pressure, which makes it possible to produce schools, hospitals and workplaces with heat-generating electricity and heat simultaneously, known as combined 20 is around 16 degrees. District-cooling is mainly used in Water is heated to steam at a high temperature and computers and technical equipment.
- 21. The emissions from a larger plant, with high demands for cleaning, are significantly less than these what would be produced if each house was heated by its own boiler without a cleaning system. 21
- 22. T HE FU T URE Sweden in general, and Swedish waste incineration in hierarchy’. Member states must therefore sever the link tons per year. This increased to 4.9 million tons per particular, is at the forefront when it comes to dealing between economic growth and increased waste volumes. year in 2007 and is estimated to reach 5.9 million tons with waste in an effective, environmentally-sound way. However, forecasts currently still point to increased vol- per year in 2012. Of this, incineration accounts for 5.1 In order to retain our leading roll, we will work hard to umes of waste, viewed over the longer term. million tons per year and biological processing for 0.8 further improve management throughout the chain. The million tons per year. The waste to energy contribution improvement work is long-term and ongoing, with the Development and legislation with the EU and within to the country´s electricity supply have increased many overall aim of limiting the negative environmental effects Sweden are important factors for the future. New legisla- times over. caused by today’s consumer society. tion or other control measures may affect the rules of the game for both the energy and waste sector. Flexible How capacity will be developed in the future depends The amount of waste produced in Sweden has increased waste management, with a suitable combination of treat- heavily on the volumes of waste, as well as on develop- over the last 30 years. Total processed household waste ment methods, is the key to effective and environmental- ment within other treatment methods. Older plants will in 1975 was 2.6 million tons. In 2007, this amounted to ly-sound development, as the conditions will change as a gradually be replaced by new ones, and capacity will be 4.2 million tons. The most dramatic increase occurred result of changes in control measures or waste volumes. adapted according to the need for both treatment capac- during the 2000s. Development so far has largely been ity and electricity and heat. governed by economic growth. There is a strong link be- introduced in Sweden in order to reduce landfilling. In Efficient Waste to Energy, which, due to the new waste of waste generated. However, in accordance with the order to meet this objective, all other treatment capac- directive, must now be counted as a method of recycling EU’s new waste framework directive, which will be intro- ity has increased dramatically for both household waste throughout the EU, will continue to be an important part duced in Sweden by December 2010, waste minimisa- and other waste. In 2000, the processing capacity for of the infrastructure for both the waste and energy sec- tion must be given top priority in the so-called ’waste 22 During the 2000s, several control measures have been tween economic growth, consumption and the amount combustible and organic waste was around 2.7 million tor within the foreseeable future.
- 23. Korstaverket in Sundsvall. Photo: Torbjörn Bergkvist IInterior pictures from Sysav combined heating and power plant in Malmö, which was commissioned in 2003. The plant was extended in 2008. Photo: André de Loisted 23
- 24. IN T ERNA T IONALLY Waste to energy is mainly used in Europe. However, the ning expansion of capacity. Expansion of the incinera- country with the most waste incineration plants is Japan. tion capacity in Europe will increase, according to forecasts, by around 11.5 million tons by 2013. The size of Facts: Plants around the world Globally, there are more than 2,500 incineration Modern waste management is moving away from land- the plants varies significantly. The majority of European plants, divided as follows: fills to material recycling and energy recovery. This is plants have a capacity of between 100,000 and 200,000 • approx. 2,000 in Asia, also true internationally, even if landfills are still the most tons per year, while the plants in the USA have a capacity • approx. 460 in Europe of 350,000 tons per year on average. • approx. 100 in North America • around ten in the rest of the world. common method of processing waste. Waste incineration is also an increasingly popular means of recovering energy. Forecasts show that waste incineration with energy A survey of how waste is used for energy recovery from a recovery will increase dramatically throughout the world European perspective shows that Sweden is the country over the next few years, from 200 million tons per year that recovers the most energy from each ton of waste in in 2007 to around 240 million tons in 2012. Europe still the waste to energy plants. dominates, but Asia and even North America are plan- 24 Modern architecture is featured in incineration plants in both Sweden and internationally. These are the plants in Spokane, Rouen and Vienna.
- 25. ENERGY RECOVERY PER TON HOUSEHOLD WASTE 2005 kg/capita 2,5 500 2 400 1,5 300 1 200 0,5 100 0 0 d ia tr s Au m do ng Ki l ga tu te ni U n um gi r Po el B Kg/capita for incineration ai Electricity (MWh electricity/ton) Så ed ly Ita ce an Fr ry ga un H y an m er G nd la ol nd H la er itz Sw d an nl Fi ay w or N k ar ic m bl en pu D Re h ec Cz en Sw Heat (MWh heat/ton) The Nordic countries extract the most energy from waste through incineration. Sweden recovers more than any other country. The pictures show the incineration plant in Trondheim, Norway, and Gärstadverket in Linköping (bottom picture) Photo: Åke E:son Lindman. 25
- 26. PLAN T S IN SWEDEN Kiruna Boden Umeå Borlänge Bäckelund Borlänge Energi P Box 834 .O. SE-781 28 BORLÄNGE www.borlange-energi.se Bollnäs Mora Borlänge Avesta Uppsala Kil Köping Karlstad Karlskoga Kumla Borås Ryaverket Borås Energi och Miljö P Box 1713 .O. SE-501 17 BORÅS www.borasenergimiljo.se Stockholm Finnspång Södertälje Norrköping Lidköping Uddevalla Skövde Borås Göteborg Hässleholm Malmö 26 Linköping Jönköping Eksjö Västervik Halmstad Boden Värmeverket Bodens Energi Slipvägen 7 SE-961 38 BODEN www.bodensenergi.se Bollnäs Säverstaverket Bollnäs Energi SE-821 80 BOLLNÄS www.bollnasenergi.se Sundsvall Åmotfors Avesta Källhagsverket AB Fortum Värme samägt med Stockholms stad Industrigatan 40 SE-774 35 AVESTA www.fortum.se Ljungby Amount of waste treated in Swedish waste to energy plants in 2008. <30 000 tons 30 000 – 100 000 tons >100 000 tons Fluidised bed Grate Eksjö Värmeverket Eksjö Energi SE-575 80 EKSJÖ www.eksjoenergi.se Finspång Finspångs vämeverk Norrköpingsvägen 32 SE-612 80 FINSPÅNG www.finspong.se Göteborg Avfallskraftvärmeverket i Sävenäs Renova P Box 156 .O. SE-401 22 GÖTEBORG www.renova.se Halmstad Kristinehedsverket Halmstad Energi och Miljö P Box 31 .O. SE-301 02 HALMSTAD www.hem.se Hässleholm Beleverket Hässleholm Fjärrvärme SE-281 41 HÄSSLEHOLM www.hfab.nu Jönköping Kraftvärmeverket Torsvik Jönköping Energi P Box 5150 .O. SE-550 05 Jönköping www.jonkopingenergi.se Karlskoga Karlskoga Kraftvärmeverk P Box 155 .O. SE-691 23 KARLSKOGA www.karlskogaenergi.se
- 27. Karlstad Hedenverket Karlstads Energi SE-651 84 KARLSTAD www.karlstadsenergi.se Kil Kils Energi P Box 88 .O. SE-665 23 KIL www.kil.se/Kils-Energi Kiruna Kiruna värmeverk Tekniska Verken i Kiruna SE-981 85 KIRUNA www.tekniskaverkenikiruna.se Kumla SAKAB SE-692 85 Kumla www.sakab.se Köping Norsaverket Vafab Miljö Sjötullsvägen 2 SE-731 36 KÖPING www.vafabmiljo.se Lidköping Lidköpings Värmeverk Lidköpings kommun SE-531 88 LIDKÖPING www.lidkoping.se Linköping Gärstadverket Tekniska Verken i Linköping P Box 1500 .O. SE-581 15 LINKÖPING www.tekniskaverken.se Ljungby Ljungsjöverket Ljungby Energi P Box 262 .O. SE-341 25 LJUNGBY www.ljungby-energi.se Malmö Sysavs avfallskraftvärmeverk P .O. Box 503 44 SE-202 13 MALMÖ www.sysav.se Mora Värmeverket E.ON. Värme SE-792 23 MORA www.eon.se Norrköping Händelöverket E.ON. Värme Region Norrköping SE-601 71 NORRKÖPING www.eon.se Skövde Skövde Värmeverk Energivägen 1 SE-541 36 Skövde www.varmeverk.skovde.se Stockholm Högdalenverket AB Fortum samägt med Stockholms stad SE-115 77 STOCKHOLM www.fortum.se Sundsvall Korstaverket Sundsvall Energi P Box 823 .O. SE-851 23 SUNDSVALL www.sundsvallenergi.se Södertälje Igelstaverket Söderenergi P Box 7074 .O. SE-152 27 SÖDERTÄLJE www.soderenergi.se Umeå Dåva kraftvärmeverk Umeå Energi P Box 224 .O. SE-901 05 UMEÅ www.umeaenergi.se Uddevalla Lillesjöverket Uddevalla Energi Strömberget SE-451 81 Uddevalla www.uddevallaenergi.se Uppsala Vattenfall Värme Uppsala SE-753 82 UPPSALA www.vattenfall.se Västervik Stegeholmsverket Västerviks Miljö & Energi Värmeverksgatan 5 SE-593 50 VÄSTERVIK www.vastervik.se 27
- 28. TRADEMARK MALMÖ AB ©Avfall Sverige AB Prostgatan 2, SE-211 25 Malmö +46 40-35 66 00 +46 40-35 66 26 info@avfallsverige.se www.avfallsverige.se Literature references, www.avfallsverige.se