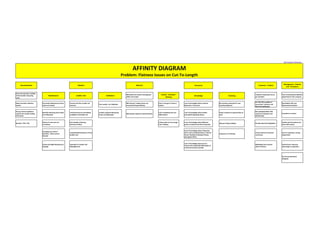
The document outlines several issues contributing to flatness problems in cut-to-length sheets. It notes a lack of proper measurement systems, calibration of levelling equipment, training of employees, and communication between departments. Adopting new quality management systems and keeping maintenance, operating procedures, and customer requirements up to date could help address flatness issues. A new data collection system and training on material properties and levelling principles are also recommended.
An effective quality management system (QMS) requires that everyone in the company has a good understanding of the reasons behind the system. This video takes a high level view of how the different pieces of a QMS fit together and what purpose that they serve in helping to satisfy your customers and improve the effectiveness of your company. Duotech Services’ Engineering Manager, Silas Gibbs, answers some common questions encountered over the past several years of successful AS9100 audits. See video presentation at: http://DuotechServices.com/Quality-Management-Why-Should-I-Care
Improving IT services by implementing best practices. Strategic approval with clear RACI. Details plan covering entire process to improve the efficiency of IT team.
Quality Journey- Measurement System Analysis .pdfNileshJajoo2
A measurement systems analysis (MSA) is a thorough assessment of a measurement process, and typically includes a specially designed experiment that seeks to identify the components of variation in that measurement process.
If there are errors in our measurement system we will be making decisions based on incorrect data. We could be making incorrect decisions or producing non-conforming parts.
A properly planned and executed Measurement System Analysis (MSA) can help build a strong foundation for any data based decision making process.
A measurement systems analysis considers the following:
Selecting the correct measurement and approach
Assessing the measuring device
Assessing procedures and operators
Assessing any measurement interactions
Calculating the measurement uncertainty of individual measurement devices and/or measurement systems
Common tools and techniques of measurement systems analysis include :-
Calibration , Gage R&R , ATA /RTR , ANOVA ,
Calibration Requirement
Alignment
ATA –Audit the Auditor (RTR – Review the Reviewer) – name itself defines the check process for the auditor
1. QL(Quality Lead) to Re Audit the transaction audited by Quality Specialist Within 48 hrs of monitoring.
2. QL to track & publish variance report
3. Both Overall & Parameter Wise Variance is calculated
4. Any Variance >5% ( as defined in process ) should be documented & Should Reaudit another call within 72 Hrs
5. This should be weekly activity by TL's & below is the tracker
Gage repeatability and reproducibility (GR&R) is defined as the process used to evaluate a gauging instrument’s accuracy by ensuring its measurements are repeatable and reproducible. The process includes taking a series of measurements to certify that the output is the same value as the input, and that the same measurements are obtained under the same operating conditions over a set duration.
Standard GR&R
Expanded GR&R
Actual Process
VariationMeasurement
Variation
Accuracy and Precision
Accuracy:
Precision:
Linearity:
Stability:
Gage R & R for Continuous Data
X Bar R Method
Typically used in automobile industry
Extreme values affect the method
Short & Long Method
Short Method does not measure operator and equipment variability separately
Long method measures operator and equipment variability separately
ANOVA Method
Measures operator & equipment variability separately as well as combined effect of operator & parts
More effective when extreme value are present
Most tedious to perform manual calculations
Analyzing Gage R&R Results
R&R less than 10%–Measurement System “acceptable
R&R 10% to 30%–May be acceptable–make decision based on classification of Characteristic , Application, Customer Input, etc.
R&R over 30%–Not acceptable. Find problem, re-visit the Fishbone Diagram, remove Root Causes
Bias
Stability
Linearity
Repeatability
The average of multiple measurements of an event are equal to the true value
There is little variation in repeated measurements of the same
Overview of Lean Manufacturing and Six Sigma tools, comaprison between Lean Speed and Six Sigma Quality combining Lean with Six Sigma
Overview of DMAIC and SIX SIGMA FORMULA
Measure Customer and Business Feedback to Drive ImprovementTechWell
Companies often go to great lengths to collect metrics. However, even the most rigorously collected data tends to be ignored, despite the findings and potential for improving practices. Today, one metric that cannot be ignored is customer satisfaction. Customers are more than willing to share their thoughts in a manner that can impact your bottom line. Social media gives consumers a stronger voice than ever, and damage to your brand is only one tweet away. The question is: Are you listening to your customers? Paul Fratellone helps you break down current process metrics so you can build them back up with business and customer value at the forefront. With feedback on how well you are attaining your objectives, you can create a powerful action plan for change that will receive the attention it deserves. If you are serious about improving the value of your projects to the business, join this session and let the right data drive your improvement actions.
SUCCESS STORY: Increasing Audit Processing Throughput by Over 100% With Lynne...GoLeanSixSigma.com
"Physician heal thyself" was the operative phrase for this nonprofit healthcare organization. The Quality Management Team tackled their own overwhelming workload with Lean Six Sigma with amazing results. Lynne Emmons of Valle del Sol has a great story to tell!
ISO 9001:2015 DIS Changes, Requirements and Implementation Govind Ramu
This presentation discusses new requirements to ISO 9001 based on the Draft International Standard (DIS). Guidance for transition to new revision is proposed for planning, communication and execution.
Abstract
The purpose and the objective of the research is to present the problem-solving method used by a successful company while acquiring an invaluable "gift" - a complaint. Service economics is growing in importance, and satisfying customers is a major objective of enterprises. This paper has focused on 8D methodology which is an 8 disciplinary approach. It consists of 8-steps to be followed by a quality improvement team for problem-solving as well as for product and process improvements. Improving the quality of the use of the 8D methodology.
A Root Cause is Sleepage of Material could create the problem of Transit Damage. "Dinosaur'' Policy and Procedure is main Cause of Sleepage of Material.
Techniques to optimize the pagerank algorithm usually fall in two categories. One is to try reducing the work per iteration, and the other is to try reducing the number of iterations. These goals are often at odds with one another. Skipping computation on vertices which have already converged has the potential to save iteration time. Skipping in-identical vertices, with the same in-links, helps reduce duplicate computations and thus could help reduce iteration time. Road networks often have chains which can be short-circuited before pagerank computation to improve performance. Final ranks of chain nodes can be easily calculated. This could reduce both the iteration time, and the number of iterations. If a graph has no dangling nodes, pagerank of each strongly connected component can be computed in topological order. This could help reduce the iteration time, no. of iterations, and also enable multi-iteration concurrency in pagerank computation. The combination of all of the above methods is the STICD algorithm. [sticd] For dynamic graphs, unchanged components whose ranks are unaffected can be skipped altogether.
Adjusting primitives for graph : SHORT REPORT / NOTESSubhajit Sahu
Graph algorithms, like PageRank Compressed Sparse Row (CSR) is an adjacency-list based graph representation that is
Multiply with different modes (map)
1. Performance of sequential execution based vs OpenMP based vector multiply.
2. Comparing various launch configs for CUDA based vector multiply.
Sum with different storage types (reduce)
1. Performance of vector element sum using float vs bfloat16 as the storage type.
Sum with different modes (reduce)
1. Performance of sequential execution based vs OpenMP based vector element sum.
2. Performance of memcpy vs in-place based CUDA based vector element sum.
3. Comparing various launch configs for CUDA based vector element sum (memcpy).
4. Comparing various launch configs for CUDA based vector element sum (in-place).
Sum with in-place strategies of CUDA mode (reduce)
1. Comparing various launch configs for CUDA based vector element sum (in-place).
Show drafts
volume_up
Empowering the Data Analytics Ecosystem: A Laser Focus on Value
The data analytics ecosystem thrives when every component functions at its peak, unlocking the true potential of data. Here's a laser focus on key areas for an empowered ecosystem:
1. Democratize Access, Not Data:
Granular Access Controls: Provide users with self-service tools tailored to their specific needs, preventing data overload and misuse.
Data Catalogs: Implement robust data catalogs for easy discovery and understanding of available data sources.
2. Foster Collaboration with Clear Roles:
Data Mesh Architecture: Break down data silos by creating a distributed data ownership model with clear ownership and responsibilities.
Collaborative Workspaces: Utilize interactive platforms where data scientists, analysts, and domain experts can work seamlessly together.
3. Leverage Advanced Analytics Strategically:
AI-powered Automation: Automate repetitive tasks like data cleaning and feature engineering, freeing up data talent for higher-level analysis.
Right-Tool Selection: Strategically choose the most effective advanced analytics techniques (e.g., AI, ML) based on specific business problems.
4. Prioritize Data Quality with Automation:
Automated Data Validation: Implement automated data quality checks to identify and rectify errors at the source, minimizing downstream issues.
Data Lineage Tracking: Track the flow of data throughout the ecosystem, ensuring transparency and facilitating root cause analysis for errors.
5. Cultivate a Data-Driven Mindset:
Metrics-Driven Performance Management: Align KPIs and performance metrics with data-driven insights to ensure actionable decision making.
Data Storytelling Workshops: Equip stakeholders with the skills to translate complex data findings into compelling narratives that drive action.
Benefits of a Precise Ecosystem:
Sharpened Focus: Precise access and clear roles ensure everyone works with the most relevant data, maximizing efficiency.
Actionable Insights: Strategic analytics and automated quality checks lead to more reliable and actionable data insights.
Continuous Improvement: Data-driven performance management fosters a culture of learning and continuous improvement.
Sustainable Growth: Empowered by data, organizations can make informed decisions to drive sustainable growth and innovation.
By focusing on these precise actions, organizations can create an empowered data analytics ecosystem that delivers real value by driving data-driven decisions and maximizing the return on their data investment.
1. Documentation Machine Material Personnel Customer : Product
Management : Policies
and Procedures
No measuring data available
of fine leveller measuring
scale.
Maintenance Leveller Unit Calibration
RM profile not uniform throughtout
width and Length
Culture " Dinosaur"
thinking
Knowledge Trainning
Customer requirment not as
per standard.
Poor Commuination between
department in the company.
Need new Data collection
system
Perventive Maintenaces Check
sheet not revised.
Coarses and Fine Leveller roll
wearout.
Fine Leveller not Calibrated
RM internal / residual stress not
removed during levellering
Fear in change in Process /
System
Lack of knowlegde about material
behaviour / structural
No training conducted for new
joinning employee.
No TDC/TPR available of
concerned Customer and
their End Application
Need Better SOP and
Measurement System.
No any Format avilable to
capture the Leveller Setting
Paraments
Monthly Planning Check Sheet
not Followered
Unviersal joint not assembled/
available to all leveller roll
Leveller up/down Measuring
Scale not Caliberated.
90% plastice require to obtain flatness
Lack of adopting the new
QMS System
Lack of knowledge about leveller
principal & Operating theory.
Senior resistant to required time to
train
Not submitted NPD/ PAG
report to Production and
Quality Dept.
Procedure is unclear.
Revision TPR / TDC
History of each part not
mentained
Poor Quality of Bearing
{Purchase Policy}
Culture does not encourage
Lean Thinking
Lack of knowledge about different
grade of material and their Proporties.
Distrust of New initiative No idea about End Appliation.
Policies and Procedures not
share with worker.
Changing any Parts of
Machine, Policy need to
Revised.
Unpredictable behaviour of fine
leveller unit
Lack of knowledge about Techanical
terms such as Residual Stress / Internal
Stress, Plasticity & Elasticity Phases,
Springback Effect.
Frequency of Trainning
Process Route of Customer
not known
Poor Co-operation among
department
Choose the Right Maintenance
Strategy
Assembly of Leveller Unit
Missalignment
Lack of knowledge about how to
remove the residual like 90% plastic of
material to break by leveller.
Misleading the Customer
when Purchase,
Performance measures
discourage co-operation
No Process Flowchart
designed.
AFFINITY DIAGRAM
Problem: Flatness Issues on Cut-To-Length
By Prasahnt Uttarkar