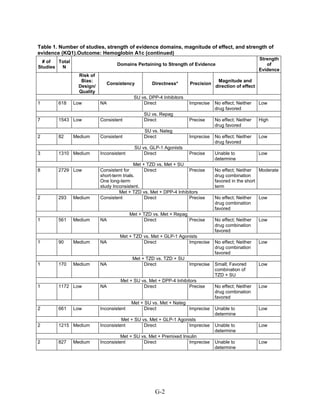
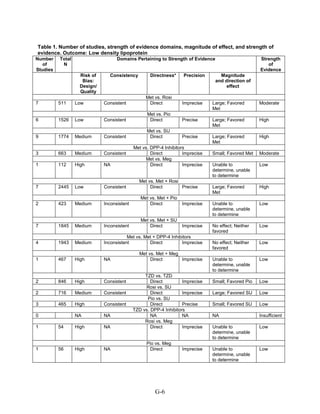
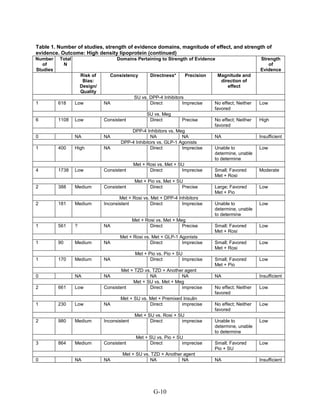
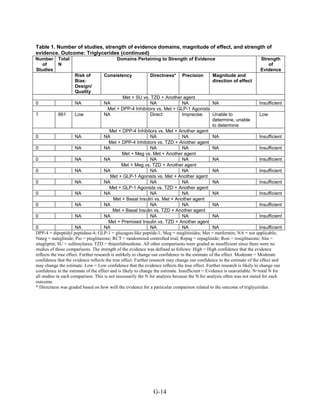
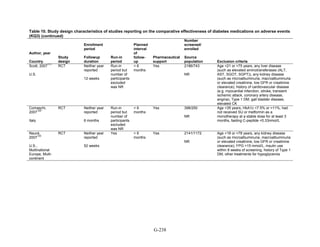
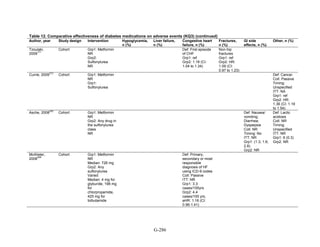
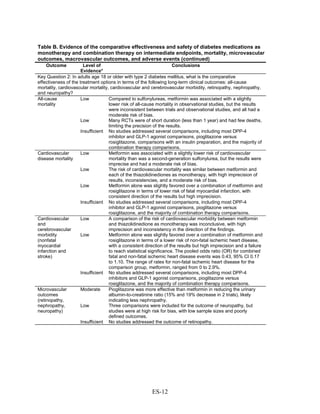
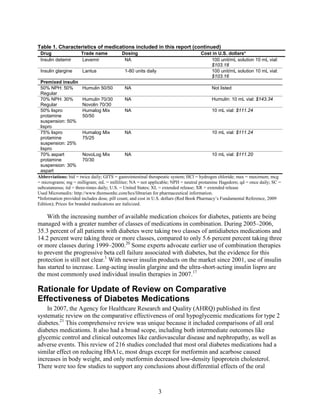
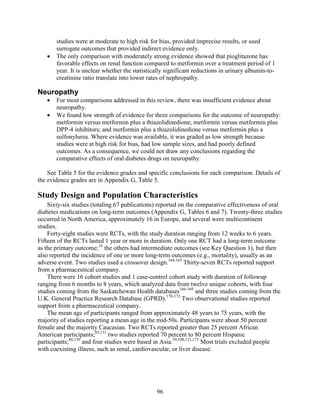
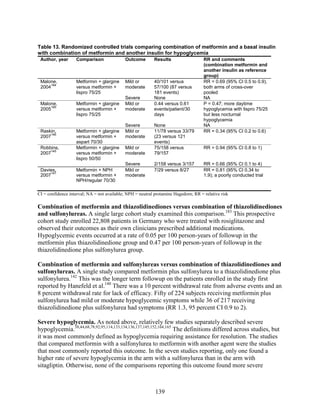
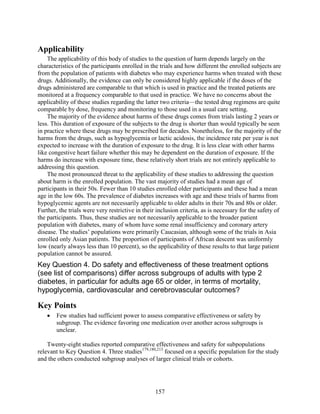
This document summarizes a review of oral diabetes medications for adults with type 2 diabetes. The review examined randomized controlled trials and observational studies comparing medications on intermediate outcomes like A1c and weight, long-term clinical outcomes like mortality and complications, and adverse events. The review found:
1) Most medications reduced A1c by about 1% on average, but metformin was more effective than DPP-4 inhibitors. Two-drug combinations had similar A1c reduction.
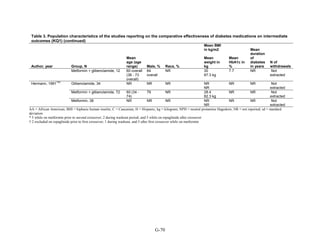
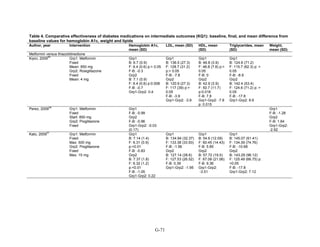
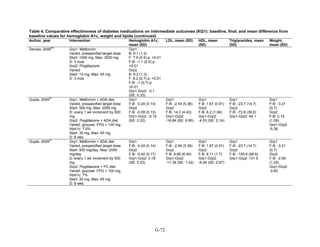
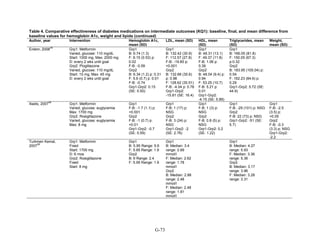
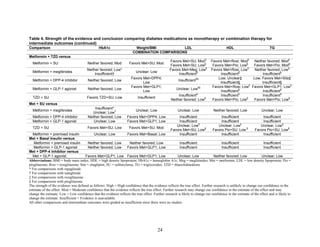
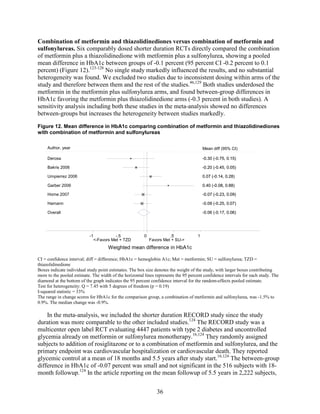
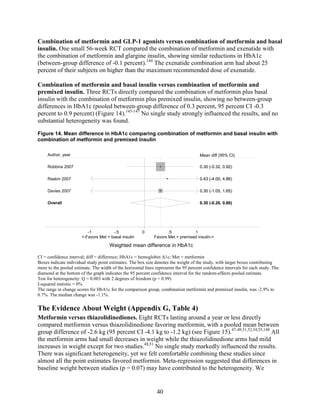
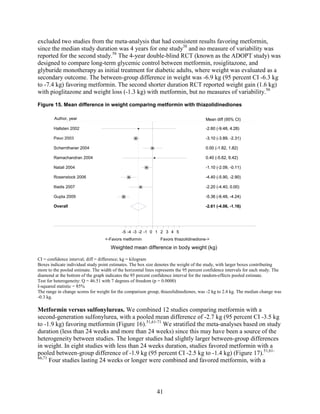
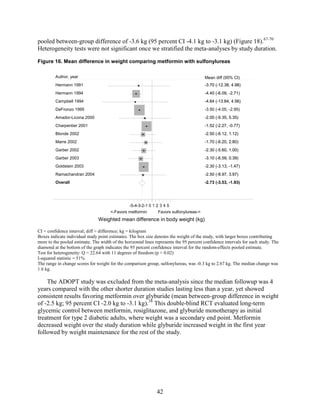
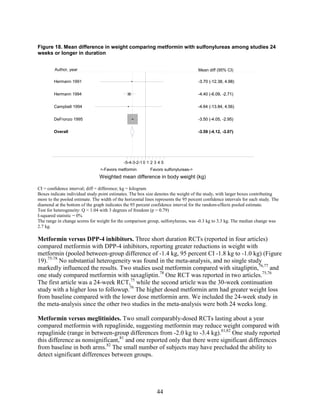
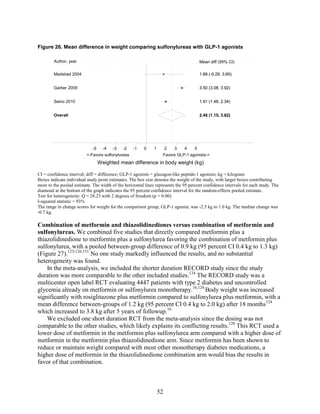
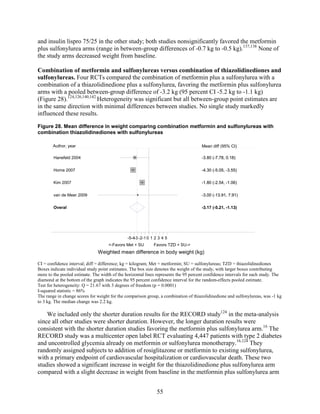
2) Metformin was associated with less weight gain compared to sulfonylureas and thiazolidinediones.
3) Sulfonylureas had a higher risk of hypoglycemia than metformin, and combining metformin
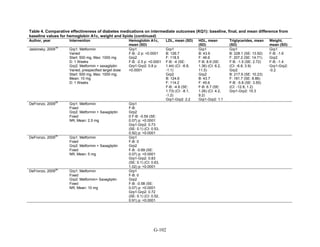
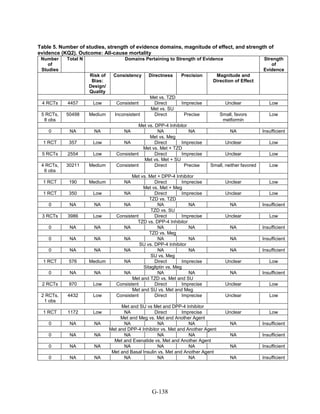
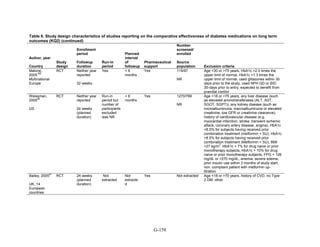
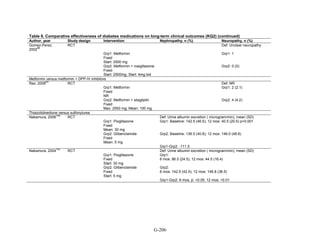
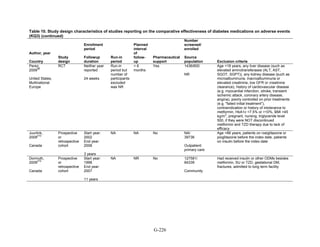
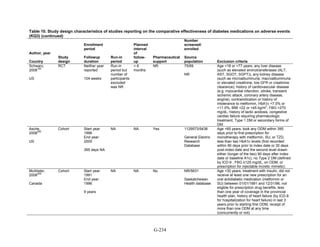
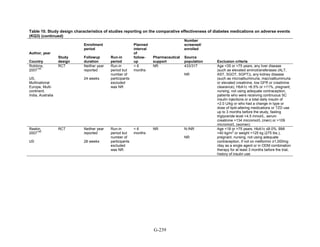
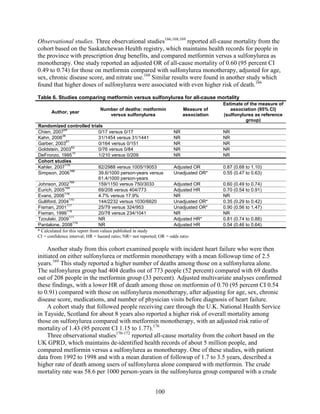
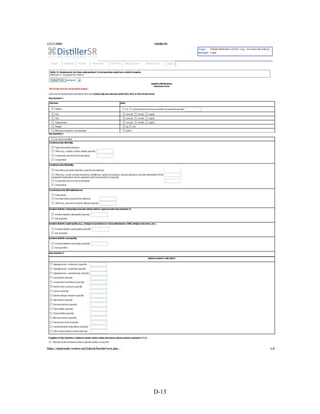
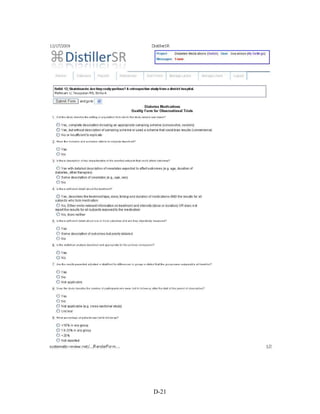
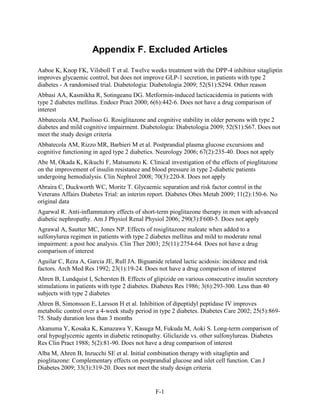
![Oral Diabetes Medications for Adults With Type 2
Diabetes: An Update
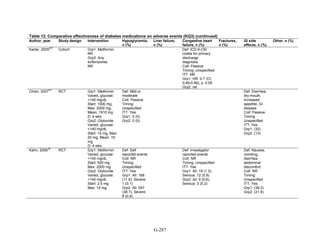
Structured Abstract
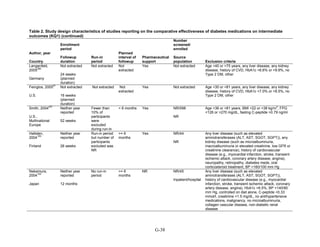
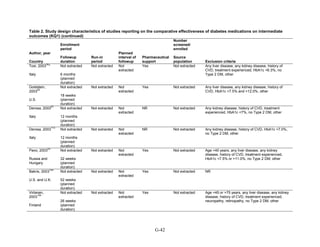
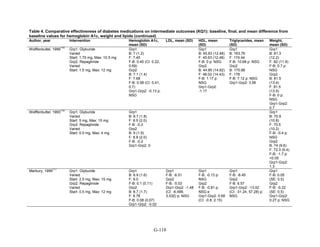
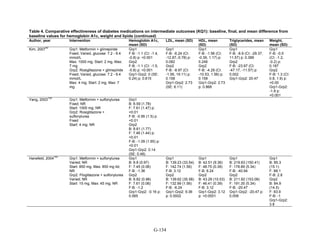
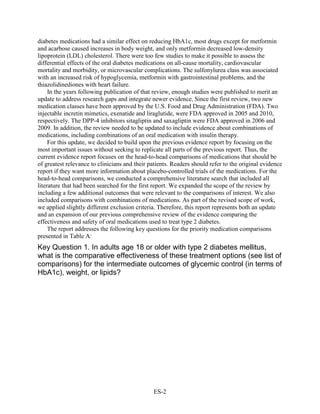
Objectives. Given the number of medications available for type 2 diabetes mellitus, clinicians
and patients need information about their effectiveness and safety to make informed choices. The
objective of this review was to summarize the benefits and harms of medications (metformin,
second-generation sulfonylureas, thiazolidinediones, meglitinides, dipeptidyl peptidase-4 [DPP-
4] inhibitors, and glucagon-like peptide-1 [GLP-1] receptor agonists), as monotherapy and in
combination, for the treatment of adults with type 2 diabetes.
Data Sources. We searched the MEDLINE, Embase, and Cochrane Central Register of
Controlled Trials databases from inception through April 2010 for original English-language
articles and sought unpublished data from the Food and Drug Administration and others.
Review Methods. Two reviewers independently screened titles to identify studies that assessed
intermediate outcomes (e.g., hemoglobin A1c [HbA1c]), long-term clinical outcomes (e.g.,
mortality), and harms (e.g., hypoglycemia) in head-to-head monotherapy or combination therapy
comparisons. Two reviewers serially extracted data for each article using standardized protocols,
assessed applicability, and independently evaluated study quality.
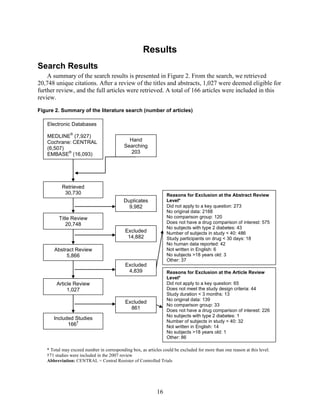
Results. The review included 140 randomized controlled trials and 26 observational studies. We
graded evidence as low or insufficient for long-term clinical outcomes of all-cause mortality,
cardiovascular disease, nephropathy, and neuropathy. Most medications lowered HbA1c on
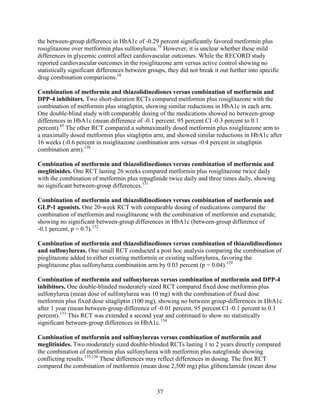
average by 1 absolute percentage point, but metformin was more efficacious than the DPP-4
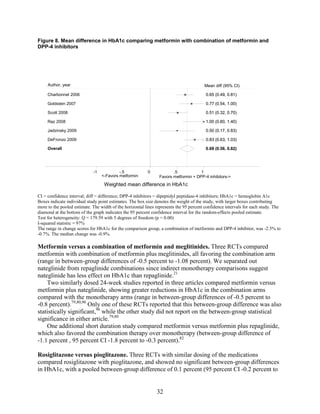
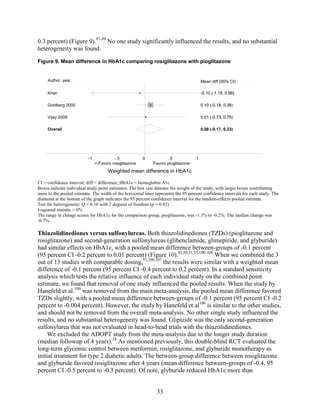
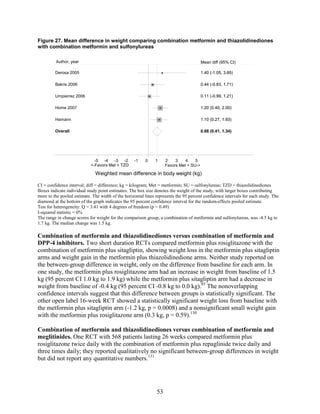
inhibitors. Two-drug combinations had similar HbA1c reduction. Compared with metformin,
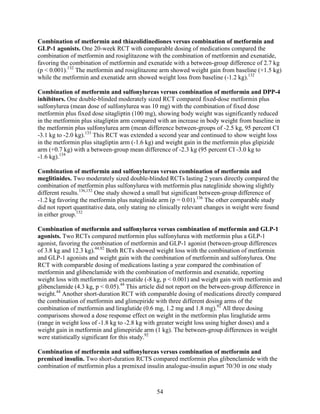
thiazolidinediones and sulfonylureas had a more unfavorable effect on weight (mean difference
of +2.6 kg). Metformin decreased low density lipoprotein cholesterol relative to pioglitazone,
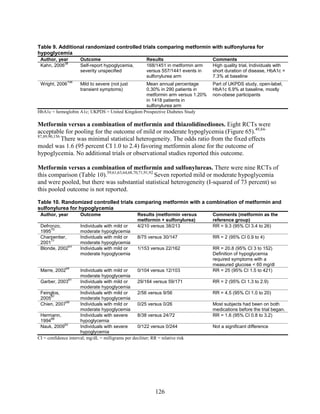
sulfonylureas, and DPP-4 inhibitors. Sulfonylureas had a fourfold higher risk of mild/moderate
hypoglycemia compared with metformin alone, and, in combination with metformin, had more
than a fivefold increased risk compared with metformin plus thiazolidinediones.
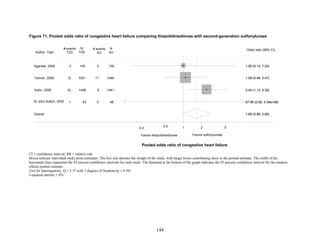
Thiazolidinediones had an increased risk of congestive heart failure relative to sulfonylureas and
bone fractures relative to metformin. Diarrhea occurred more often for metformin compared with
thiazolidinedione users.
Conclusions. Comprehensive information comparing benefits and harms of diabetes medications
can facilitate personalized treatment choices for patients. Although the long-term benefits and
harms of diabetes medications remain unclear, the evidence supports use of metformin as a first-
line agent. Comparisons of two-drug combinations showed little to no difference in HbA1c
reduction, but some combinations increased risk for hypoglycemia and other adverse events.
v](https://image.slidesharecdn.com/afdmantidiabeticos27-151124223447-lva1-app6892/85/Af-dm-antidiabeticos-27-7-320.jpg)
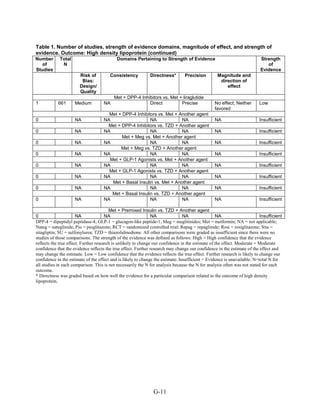
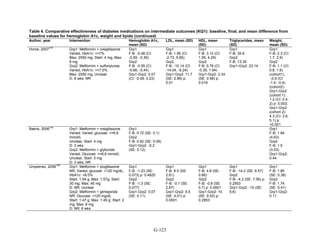
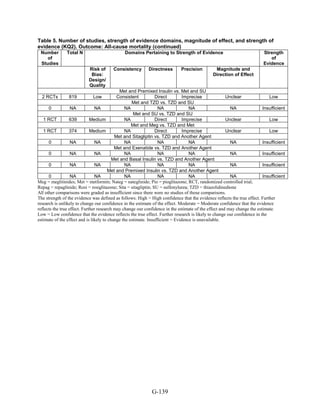
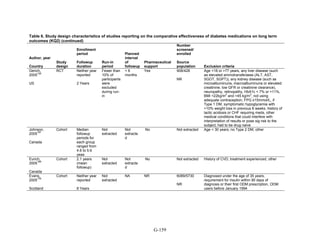
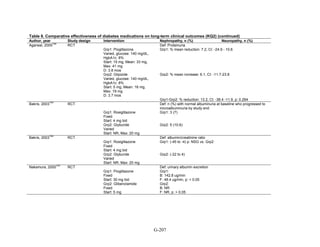
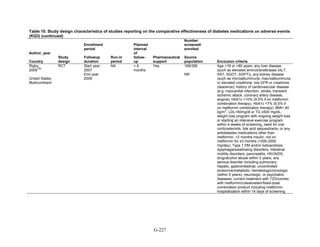
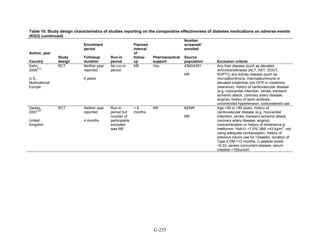
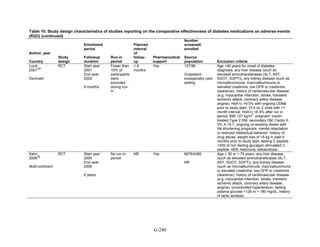
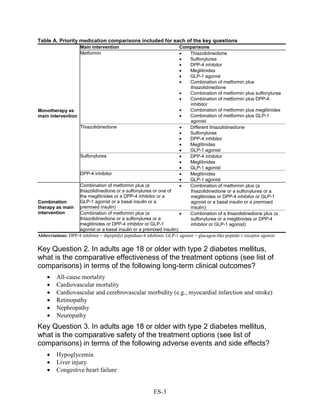
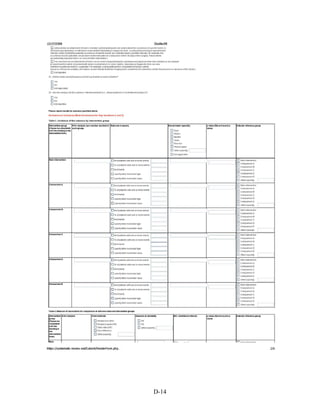
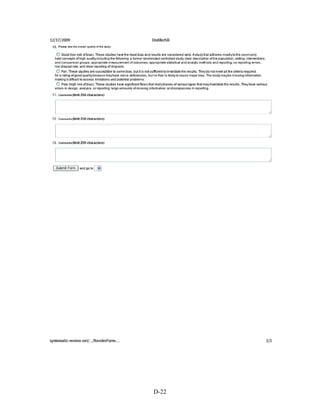
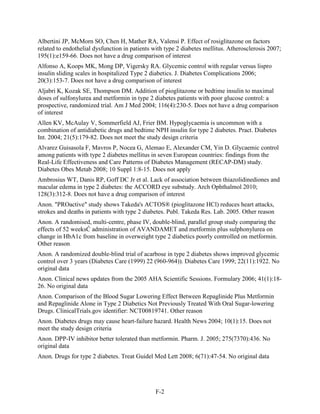
![Executive Summary
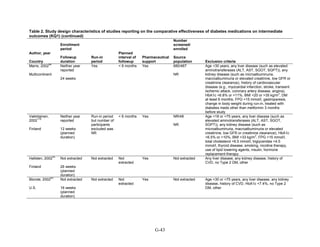
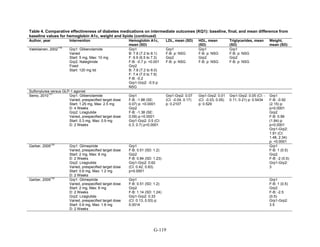
Background
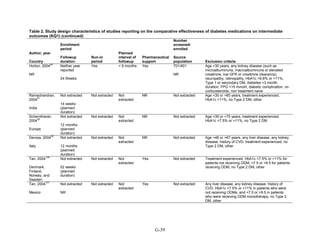
Type 2 diabetes is a common chronic illness characterized by insulin resistance and
eventually by decreased insulin secretion by pancreatic beta cells, leading to chronic
hyperglycemia and associated long-term disease complications. In the United States, the
prevalence of diabetes increased from 5.1 percent during 1988–1994 to 6.5 percent during 1999–
2002.1
Like many chronic illnesses, diabetes disproportionately affects older people. It is
associated with obesity, and its prevalence is higher among racial and ethnic minority
populations. The annual economic burden of diabetes is estimated to be $132 billion and is
increasing, mostly because of the costly complications of the disease.
Long-term complications of diabetes include microvascular disease, such as retinopathy and
blindness, neuropathy, nephropathy, and end-stage kidney disease. In addition, the death rate
from cardiovascular disease in adults with type 2 diabetes is two to four times as high as in adults
without diabetes.2
Management of hyperglycemia using diet and pharmacologic therapy is the
cornerstone of treatment for type 2 diabetes. Results from randomized controlled trials (RCTs)
have demonstrated that the risk of microvascular complications, particularly retinopathy, can be
reduced by improved glycemic control in patients with type 2 diabetes. However, studies have
had mixed results regarding the impact of intensive glycemic control (hemoglobin A1c [HbA1c]
< 7 percent) on cardiovascular events and mortality. While older studies indicated that intensive
glycemic control may reduce cardiovascular morbidity and mortality, recent studies have raised
the possibility that intensive glycemic control has either no effect or a negative effect on
cardiovascular morbidity and mortality. These mixed results suggest the need for further
research, including investigation of the long-term safety of glucose-lowering therapies. In
addition to questions about optimal glycemic control, recent studies have addressed concerns
about excess cardiovascular risk associated with particular oral hypoglycemic agents,
specifically the risk of rosiglitazone.
In 1995, the only drugs for treating type 2 diabetes were sulfonylureas and insulin. Since
then, many new pharmacotherapy options have become available. At present, there are 11 classes
of diabetes medications: biguanides (i.e., metformin), thiazolidinediones, sulfonylureas,
dipeptidyl peptidase-4 (DPP-4) inhibitors, meglitinides, glucagon-like peptide-1 (GLP-1)
receptor agonists, an amylin analogue, bromocriptine, alpha-glucosidase inhibitors, colesevalam
(a bile-acid sequestrant), and insulins. The newer agents are more costly than the older
medications, and some are only approved as adjunctive therapies. In addition to having an
increased number of medication choices, patients with type 2 diabetes often need to take more
than one type of diabetes medication. In 2005–2006, 35 percent of all patients with diabetes were
taking two classes of antidiabetes medications, and 14 percent were taking three or more classes,
as compared to only 6 percent taking three or more classes in 1999–2000.3
In 2007, the Agency for Healthcare Research and Quality (AHRQ) published its first
systematic review on the comparative effectiveness of oral medications for type 2 diabetes,
Comparative Effectiveness and Safety of Oral Diabetes Medications for Adults With Type 2
Diabetes (Comparative Effectiveness Review No. 8). The review was unique because it included
comparisons of all oral diabetes medications. It also had a broad scope, including intermediate
outcomes such as glycemic control and clinical outcomes such as cardiovascular disease and
nephropathy, as well as adverse events. The review of 216 studies concluded that most oral
ES-1](https://image.slidesharecdn.com/afdmantidiabeticos27-151124223447-lva1-app6892/85/Af-dm-antidiabeticos-27-14-320.jpg)
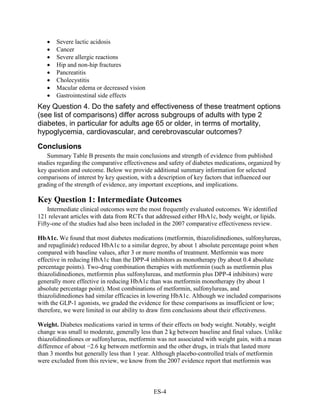
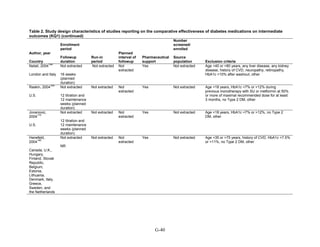
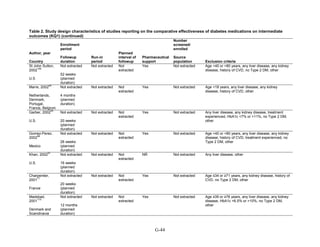
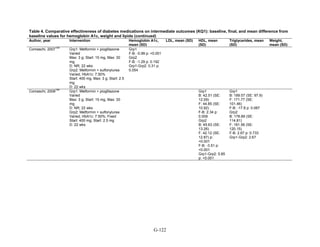
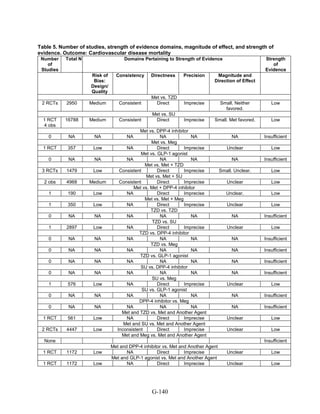
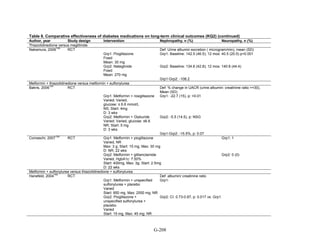
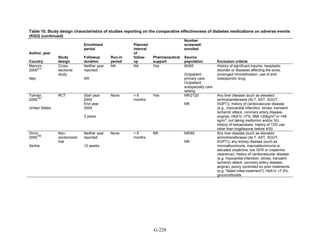
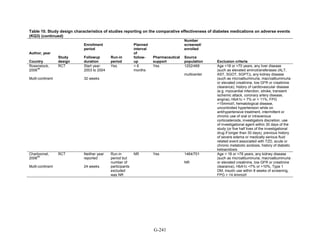
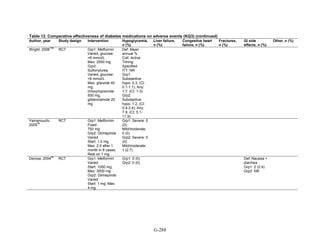
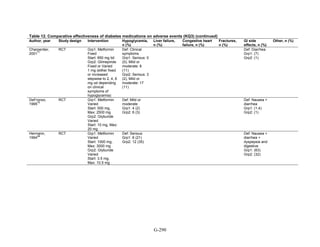
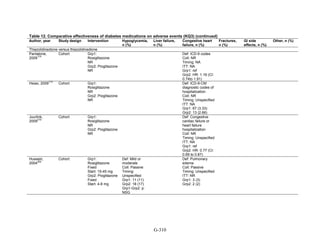
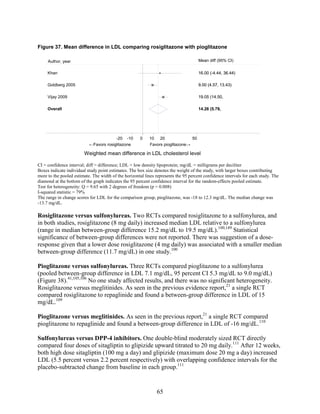
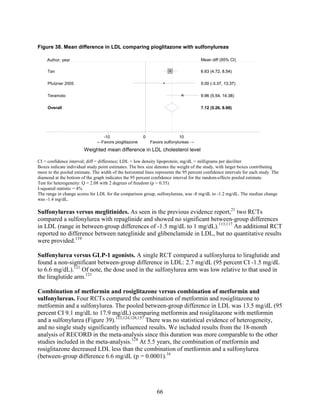
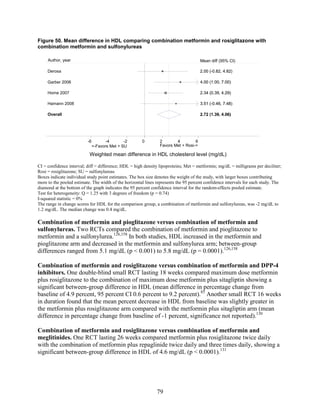
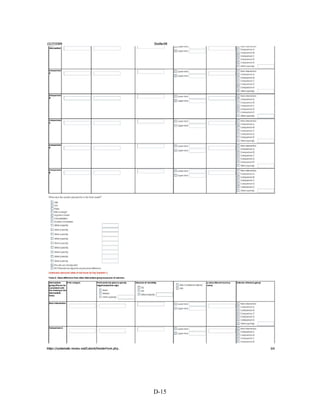
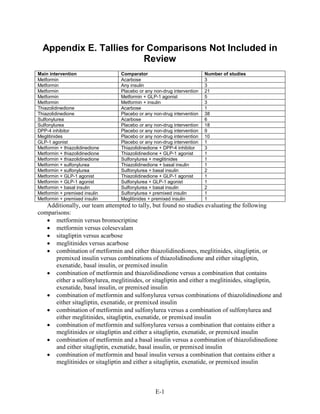
![associated with weight neutrality when compared with placebo. As compared with sulfonylureas,
the GLP-1 agonists were associated with a relative weight change of about 2.5 kg.
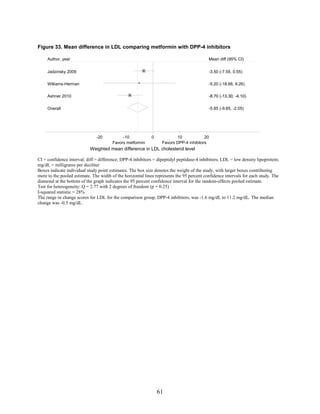
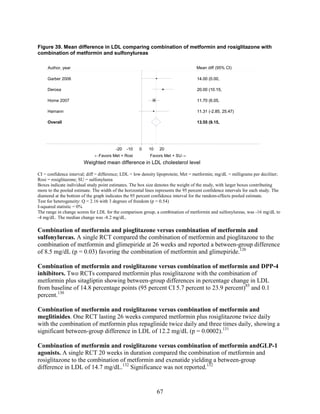
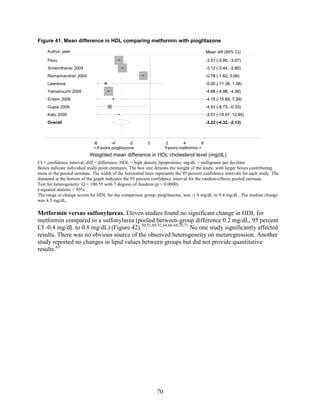
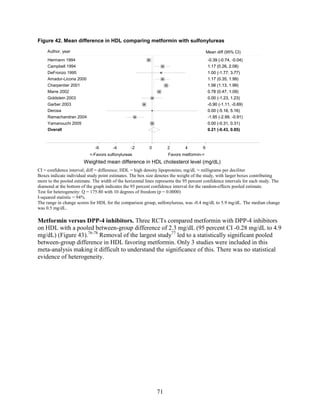
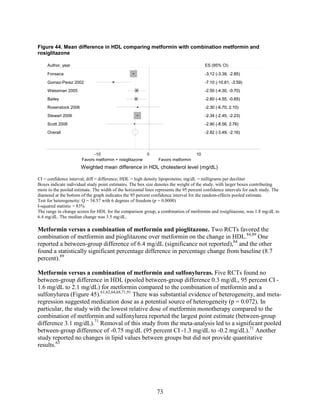
Lipids. The effects on lipid levels varied across medication type, but most were small to
moderate (changes of about 0.5 mg/dL to 16 mg/dL for LDL, 0.5 mg/dL to 4 mg/dL for high-
density lipoprotein [HDL], and 0 mg/dL to 33 mg/dL for triglycerides [TG]), in studies that
generally lasted between 3 and 12 months. Metformin had favorable effects on all the lipid
classes: It decreased LDL more effectively than did sulfonylureas, rosiglitazone, or pioglitazone,
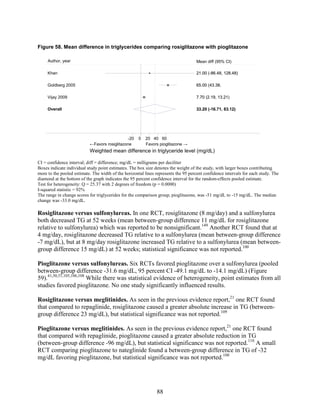
and it decreased TG more efficiently than sulfonylureas or rosiglitazone. However, pioglitazone
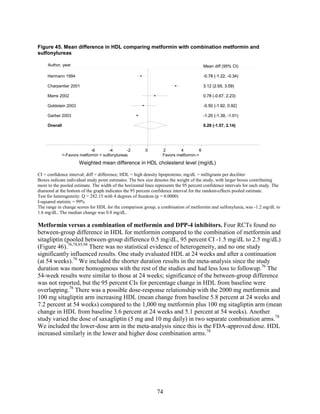
was more effective than metformin in decreasing TG. The addition of rosiglitazone to metformin
increased LDL and HDL but also increased TG when compared to metformin monotherapy and
to the combination of metformin and a sulfonylurea. The addition of pioglitazone to metformin
also increased HDL but decreased TG when compared to the combination of metformin and a
sulfonylurea. The addition of DPP-4 inhibitors to metformin did not have an effect on HDL in
comparison with metformin monotherapy. We noted that one medication or class may have
favorable effects on one lipid outcome and unfavorable effects on another lipid outcome. For
instance, rosiglitazone was less effective than pioglitazone in decreasing LDL, and it increased
HDL to a lesser extent than did pioglitazone, but both favorably decreased TG.
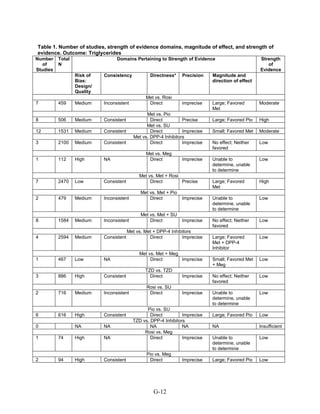
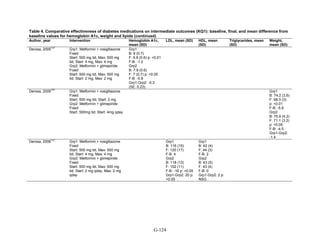
Key Question 2: Macrovascular and Microvascular Long-Term
Complications of Diabetes
Although we identified 41 new studies in addition to the 25 studies included in the 2007
evidence report, the new studies were generally of short duration (less than 1 year) and had few
long-term events (such as deaths and cardiovascular disease), making any estimates of risk
difference very imprecise. Therefore, most comparisons for this key question had a low strength
of evidence. Metformin was associated with slightly lower all-cause mortality and cardiovascular
disease mortality than were sulfonylureas. However, the evidence was limited by inconsistency
between the trials and observational studies and the overall low precision of the results, due to
the rarity of events. Data from the 2007 evidence report also showed that treatment with
metformin was associated with a decreased risk of cardiovascular mortality when compared with
any other oral diabetes agent or placebo, although the results for all-cause mortality and
cardiovascular morbidity were not significant.
We found few studies with the newer DPP-4 inhibitors and GLP-1 agonists, but overall the
evidence on these newer agents was insufficient to allow us to make any meaningful
conclusions. Few studies included insulin added to oral medications or compared other two-drug
combination therapies.
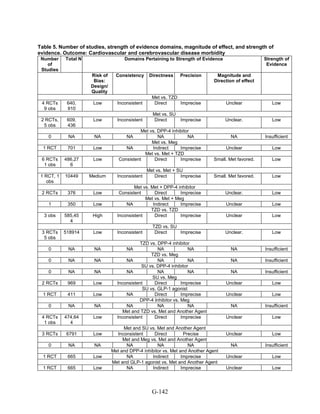
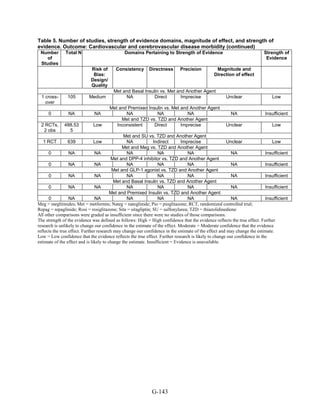
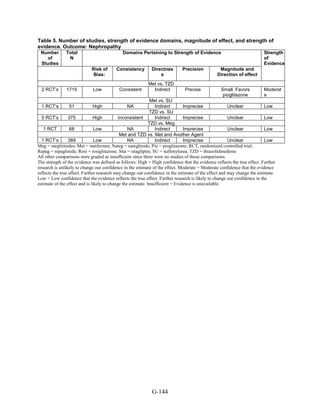
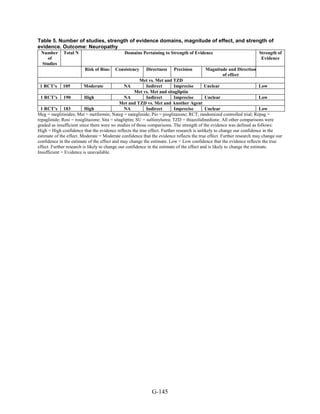
Few studies addressed microvascular outcomes of nephropathy, retinopathy, or neuropathy.
We found moderate strength of evidence that pioglitazone is better than metformin at reducing
short-term nephropathy, based on two short-duration RCTs. Only three comparisons were
included for the outcome of neuropathy, and these studies were limited by their small sample
sizes and poorly defined outcomes. We did not identify any studies for the outcome of
retinopathy.
Key Question 3: Adverse Events and Side Effects
This Key Question was addressed by 107 studies.
ES-5](https://image.slidesharecdn.com/afdmantidiabeticos27-151124223447-lva1-app6892/85/Af-dm-antidiabeticos-27-18-320.jpg)
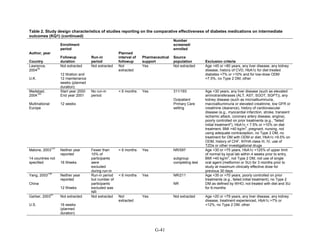
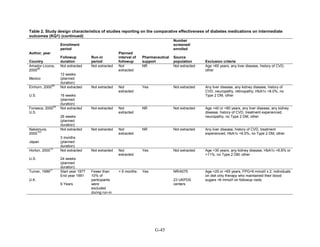
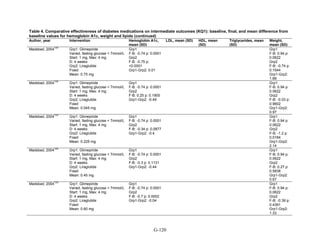
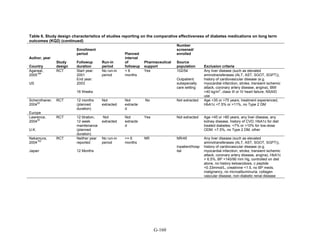
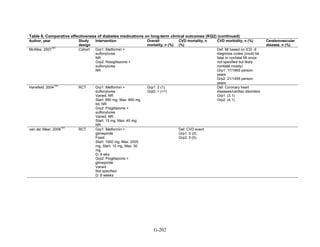
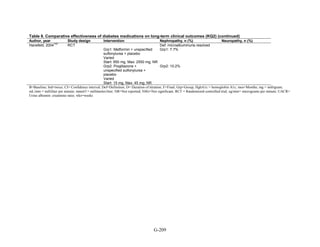
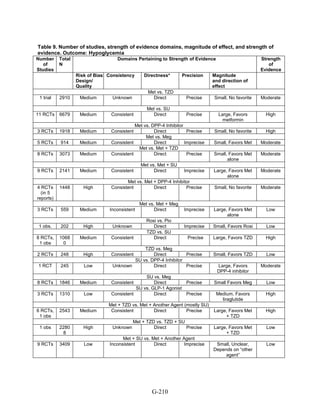
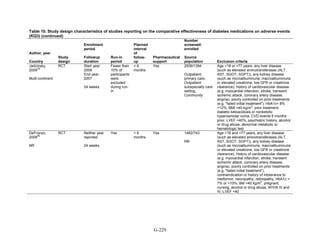
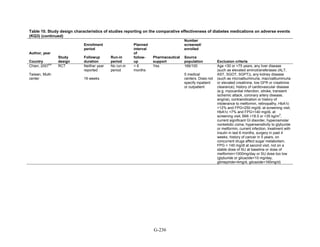
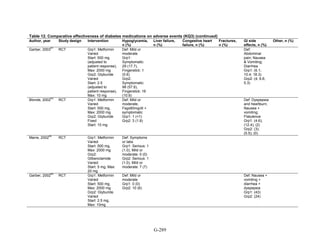
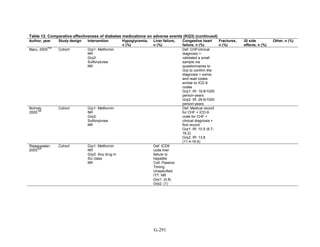
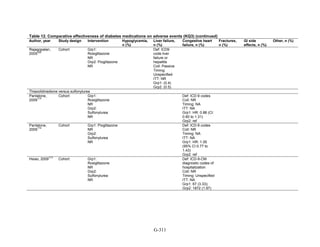
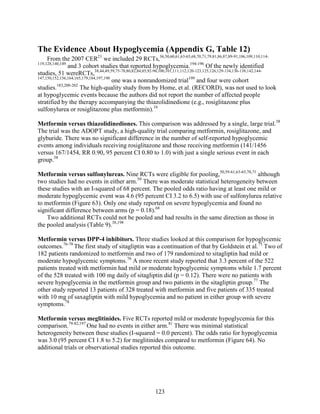
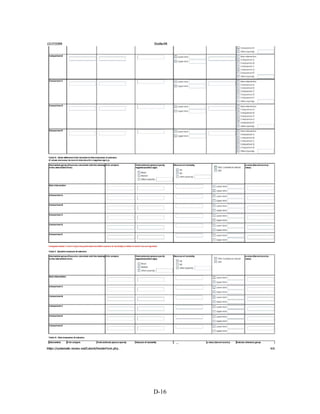
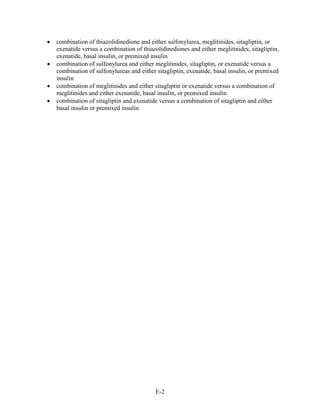
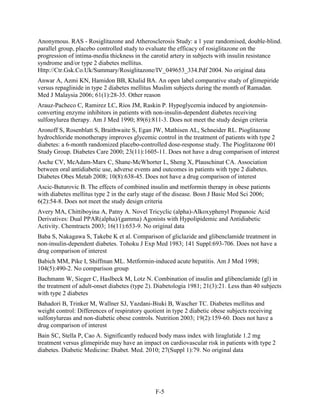
![Hypoglycemia. Hypoglycemic episodes were three to seven times as frequent in people taking
sulfonylureas as in those taking metformin, thiazolidinediones, or DPP-4 inhibitors. Combination
therapies that included a sulfonylurea plus metformin also had an excess hypoglycemia risk
when compared to metformin plus a thiazolidinedione.
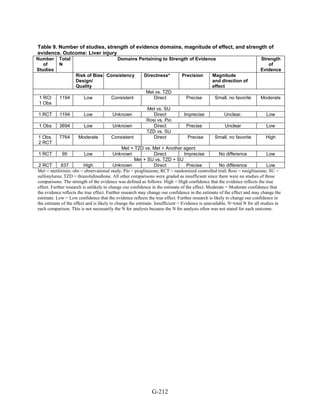
Congestive heart failure. Based on a single RCT with moderate risk of bias, we found low
strength of evidence that the risk of congestive heart failure (CHF) was higher with combination
therapy containing rosiglitazone than with a combination of metformin and a sulfonylurea
(relative risk [RR] 2.1). We also found a higher risk of CHF with thiazolidinedione monotherapy
than with sulfonylurea monotherapy. We were unable to draw any useful conclusions about CHF
risk from other drug comparisons of interest, either because of an absence of evidence,
conflicting results, or the low quality of the studies.
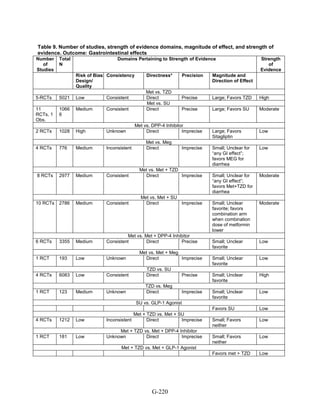
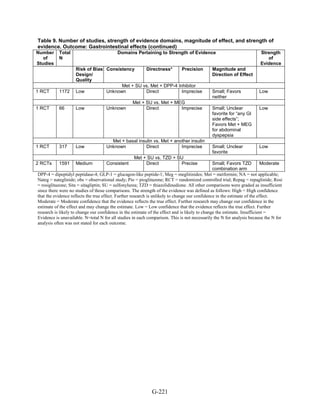
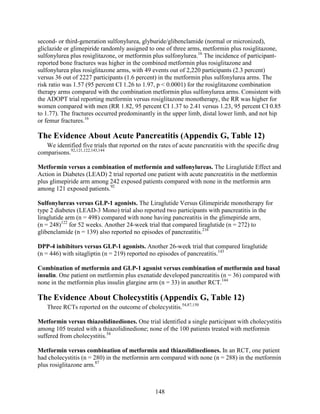
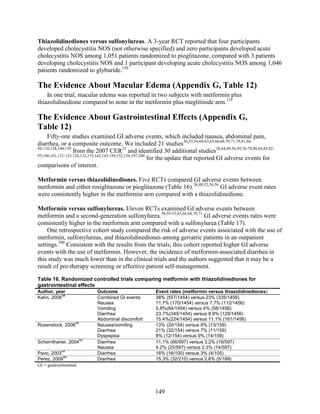
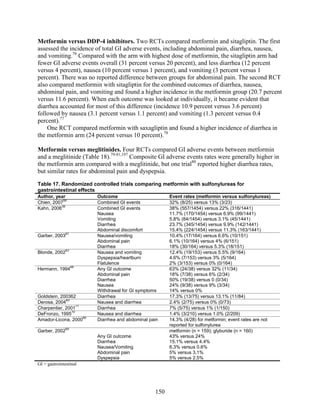
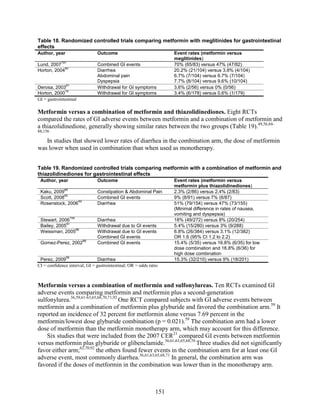
Gastrointestinal side effects. Metformin was associated with higher risk of gastrointestinal side
effects than were all other medications, regardless of whether the metformin was used as
monotherapy or as part of combination therapy.
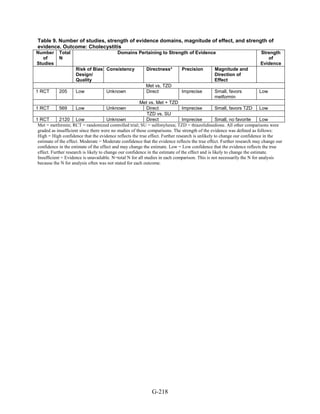
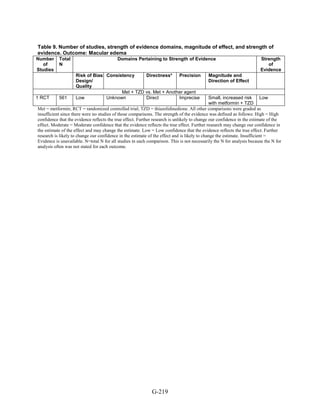
Other adverse events. We found reports of four types of adverse events that were not addressed
in our previous evidence report: macular edema, cholecystitis, pancreatitis, and fractures. Except
for fractures, the majority of the evidence was graded as low strength because the availability of
only a few studies and events limited the assessment of consistency and precision of the results.
We did find a high strength of evidence showing that thiazolidinediones, either in combination
with another medication or as monotherapy, were associated with a 1.5-fold higher risk of bone
fractures than was metformin alone or in combination with sulfonylurea.
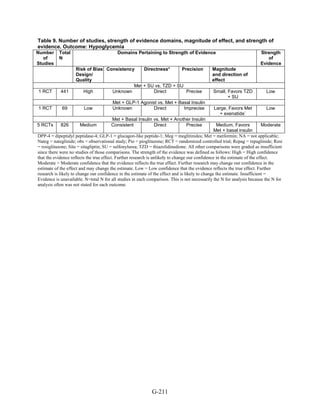
We also found little evidence regarding liver injury and cancer, outcomes included in the
2007 evidence report. However, in agreement with other reviews, we found a moderate strength
of evidence for a lack of increased risk of lactic acidosis with metformin treatment, as compared
to a sulfonylurea or a combination of metformin and sulfonylurea.
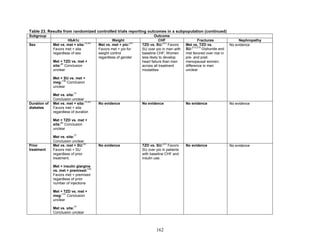
Key Question 4: Differences in Subgroups
Twenty-eight studies applied to Key Question 4. We found that when compared to men,
women taking rosiglitazone either as monotherapy or in combination were at higher risk for bone
fractures than were those taking metformin alone or in combination with sulfonylureas.
However, for the majority of comparisons, the available studies did not have sufficient power to
allow for subgroup analyses, and few studies occurred exclusively in a subpopulation. We found
no conclusive information to predict which subgroups of patients might differentially respond to
alternative treatments.
Remaining Issues
In this review, we have synthesized the current literature about the comparative effectiveness
and safety of diabetes medications when used alone or in two-drug combinations. We focused
primarily on the relative differences between drugs in our analyses. However, in the figures in
the main body of the report, we also included footnotes with information about the range of
absolute differences from baseline to followup in the comparison arms for readers who wish to
estimate the magnitude of effect in absolute terms. We identified some deficiencies in the
ES-6](https://image.slidesharecdn.com/afdmantidiabeticos27-151124223447-lva1-app6892/85/Af-dm-antidiabeticos-27-19-320.jpg)
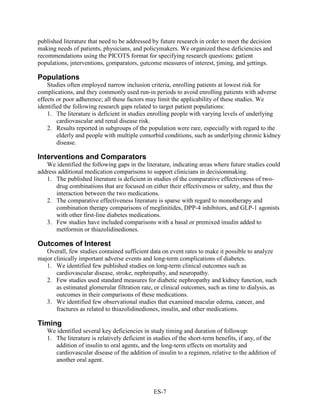
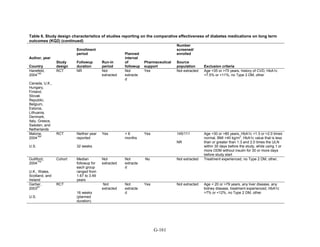
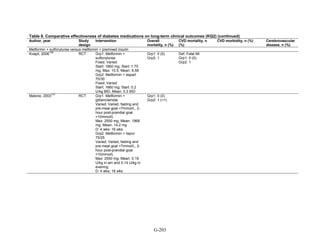
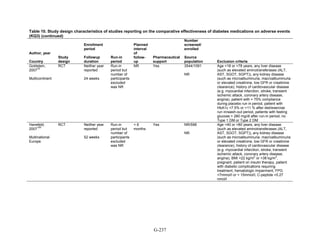
![Introduction
Background
Type 2 diabetes is a common chronic illness, with an increasing prevalence that parallels the
rise in obesity rates. Type 2 diabetes is characterized by insulin resistance, which is worsened by
obesity and physical inactivity. Over time, the pancreatic beta cells lose their ability to maintain
the high insulin levels needed to counter liver and muscle insulin resistance and beta cell failure
occurs.1
The natural history of type 2 diabetes has been described in several populations.1
In the United States, the prevalence of diabetes has increased from 5.1 percent during 1988–
1994 to 6.5 percent during 1999–2002.2
Like many chronic illnesses, diabetes disproportionately
affects older people, and its prevalence is higher among racial and ethnic minority populations.3
The annual economic burden of diabetes is estimated to be $132 billion4
and is increasing,
mostly attributable to costly complications of the disease.5
Complications of longstanding diabetes include the microvascular complications of
retinopathy and blindness, neuropathy, nephropathy, and end-stage kidney disease. In addition,
there is a twofold to fourfold increased death rate from cardiovascular disease in adults with type
2 diabetes compared to adults without diabetes.6
Management of hyperglycemia using diet and
pharmacologic therapy is the cornerstone of treatment for type 2 diabetes, along with
management of coexisting lipid abnormalities and hypertension. Results from randomized
controlled trials have demonstrated that the risk of microvascular complications, particularly
retinopathy, can be reduced with good glycemic control in patients with type 2 diabetes.7-9
However, studies have had mixed results regarding the impact of intensive glycemic control
(hemoglobin A1c [HbA1c] < 7 percent) on cardiovascular events and mortality. While older
studies indicated that intensive glycemic control may reduce cardiovascular morbidity and
mortality,10,11
recent studies have raised the possibility that intensive glycemic control has either
no effect or a negative effect on cardiovascular morbidity and mortality.12,13
These mixed results
suggest the need for further research, including investigation of the long-term safety of glucose-
lowering therapies.8,11,14
Early data from the United Kingdom Prospective Diabetes Study suggested a protective
effect of improved glucose control on cardiovascular disease morbidity and mortality. In
particular, treatment with metformin compared with sulfonylureas and insulin resulted in greater
cardiovascular benefit.8
However, in the last two years, several major trials have found no
benefit from intensive glycemic control.12-13
In fact, the Action to Control Cardiovascular
Disease in Diabetes study identified an increased risk for death from cardiovascular causes and
higher total mortality among those participants treated with an intensive glucose control
strategy.13
There have been concerns, too, about an increased risk of ischemic heart disease and
congestive heart failure associated with specific oral hypoglycemic agents, specifically
rosiglitazone, from the thiazolidinedione class.15,16
National trends in the treatment of diabetes
have reflected the public’s concern about this drug, with a 63 percent decrease in rosiglitazone
use between 2004 and 2007.17-19
In 1995, the only drugs for treating diabetes were sulfonylureas and insulin. Since 1995 many
new pharmacotherapy options have become available. Currently there are 11 classes of diabetes
medications, including sulfonylureas, meglitinides, glucagon-like peptide-1 (GLP-1) receptor
agonists, biguanides, an amylin analogue, thiazolidinediones, bromocriptine, alpha-glucosidase
inhibitors, dipeptidyl peptidase-4 (DPP-4) inhibitors, colesevalam (a bile-acid sequestrant), and
1](https://image.slidesharecdn.com/afdmantidiabeticos27-151124223447-lva1-app6892/85/Af-dm-antidiabeticos-27-28-320.jpg)

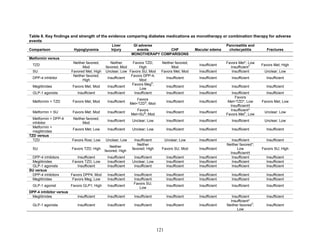
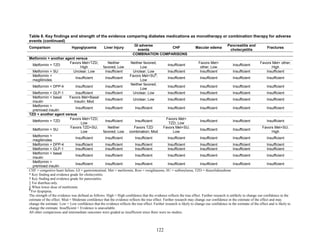
![The inclusion and exclusion criteria for this review differed from the initial review. First, this
review includes interventions that were excluded from the initial review: dipeptidyl peptidase-4
(DPP-4) inhibitor, glucagon-like peptide-1 (GLP-1) analogs, combination metformin plus DPP-4
inhibitor, combination metformin plus a meglitinide, combination metformin plus GLP-1
analogs, combination of metformin plus a basal insulin, combination of metformin plus a
premixed insulin, and combination thiazolidinedione plus a meglitinide. This review includes
studies with unambigous medication combinations but not studies in which participants were
treated with unspecified adjunctive diabetes medications. We did not update the initial review on
acarbose. Second, this review includes outcomes that were not included in the initial review:
fractures, cholecystitis, and macular edema. We did not update the initial review on the outcomes
of blood pressure, body mass index, 2-hour postprandial glucose, peripheral arterial disease,
amputations, quality of life, functional status, anemia, thrombocytopenia, leucopenia,
hypervolemia, and withdrawals due to adverse events.
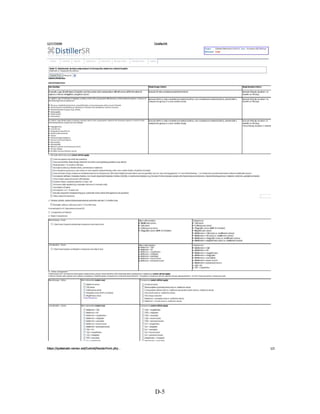
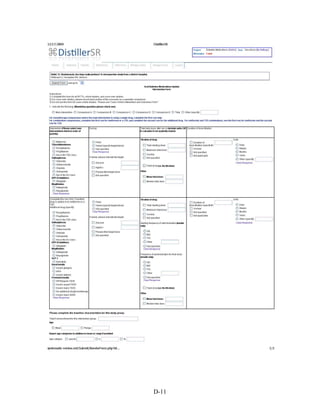
Data Abstraction
We used a systematic approach for extracting data to minimize the risk of bias in this
process. By creating standardized forms for data extraction, we sought to maximize consistency
in identifying all pertinent data available for synthesis. If reviewers determined that an article
addressed both efficacy and safety, multiple data abstraction forms were used.
Each article underwent double review by study investigators for data abstraction and
assessment of study quality. The second reviewer confirmed the first reviewer’s data abstraction
for completeness and accuracy. Reviewer pairs were formed to include personnel with both
clinical and methodological expertise. A third reviewer rereviewed a random sample of articles
by the first two reviewers to ensure consistency in the data abstraction of the articles. Reviewers
were not masked to the articles’ authors, institution, or journal.25
In most instances, data were
directly abstracted from the article. If possible, relevant data were also abstracted from figures.
Differences in opinion were resolved through consensus adjudication. For assessments of study
quality, each reviewer independently judged study quality and rated items on quality assessment
forms (Appendix D, Data Abstraction Review Forms).
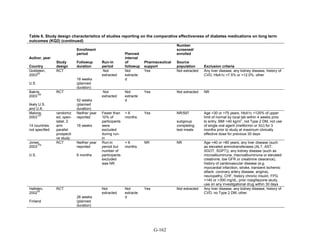
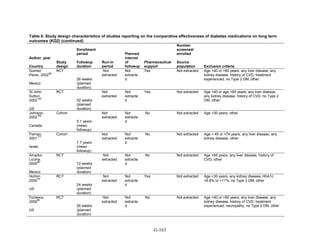
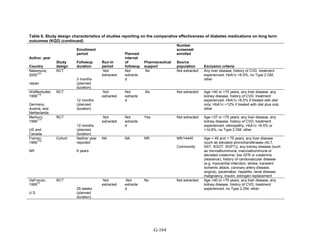
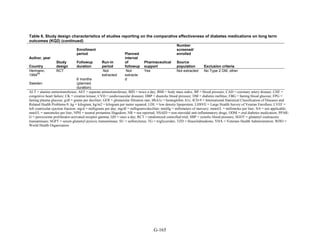
For all articles, reviewers extracted information on general study characteristics (e.g., study
design, study period, and followup), study participants (e.g., age, gender, race, weight/body mass
index, hemoglobin A1c [HbA1c] levels, and duration of diabetes), eligibility criteria,
interventions (e.g., initial, maximum, and mean doses, frequency of use, and duration of use),
outcome measures and the method of ascertainment, and the results of each outcome, including
measures of variability (Appendix D, Data Abstraction Review Forms).
All information from the article review process was entered into the DistillerSR database by
the individual completing the review. Reviewers entered comments into the system whenever
applicable. The DistillerSR database was used to maintain and clean the data, as well as to create
detailed evidence tables and summary tables.
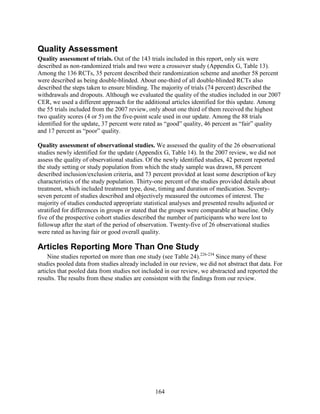
Quality Assessment
Article quality was assessed differently for randomized controlled trials (RCTs) and
observational studies. For RCTs the dual, independent review of article quality was based on the
Jadad criteria: (1) appropriateness of the randomization scheme, (2) appropriateness of the
blinding, and (3) description of withdrawals and dropouts.26
For the updated review, we also
11](https://image.slidesharecdn.com/afdmantidiabeticos27-151124223447-lva1-app6892/85/Af-dm-antidiabeticos-27-38-320.jpg)
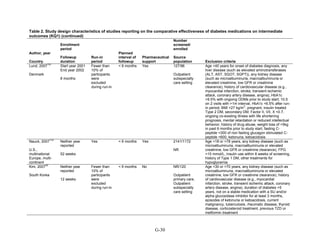
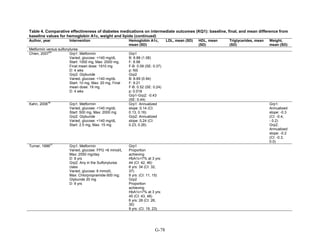
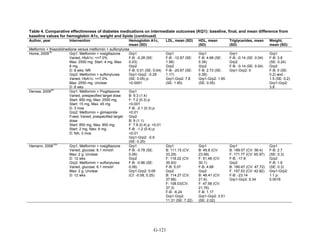
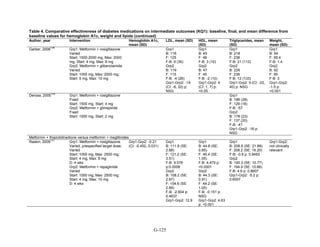
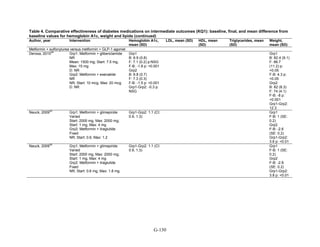
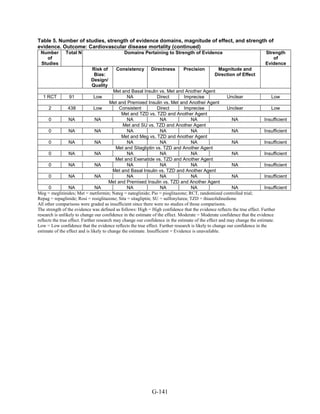
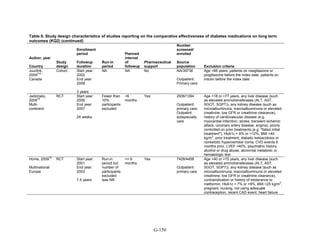
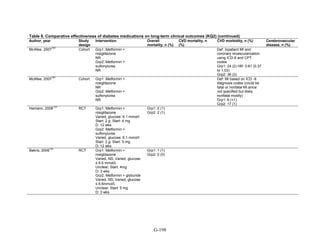
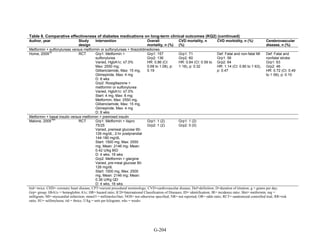
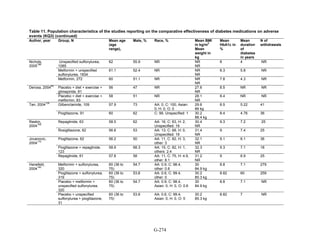
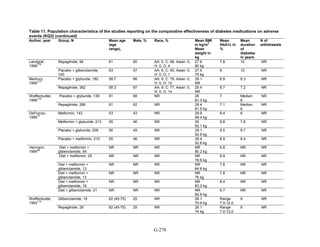
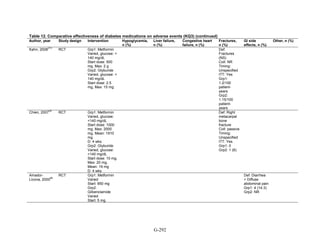
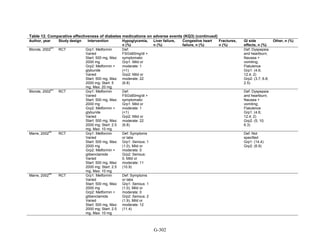
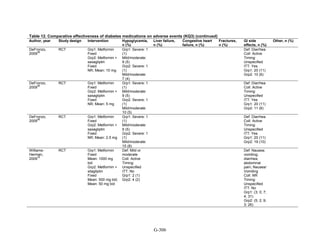
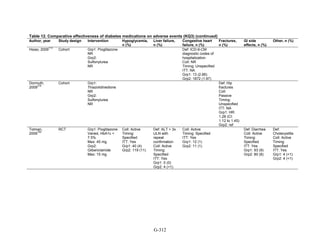
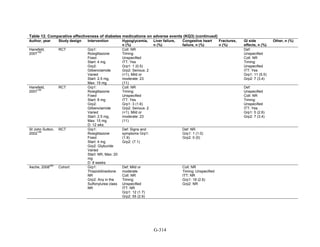
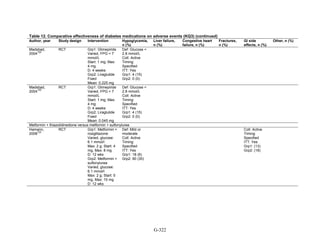
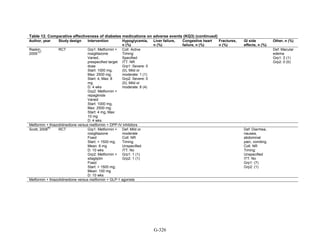
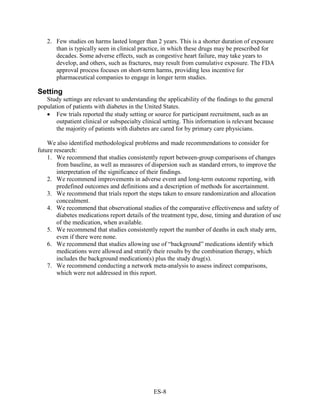
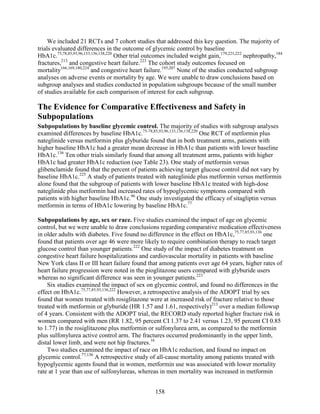
![Key Question 1. In adults age 18 or older with type 2 diabetes mellitus,
what is the comparative effectiveness of the treatment options (see list of
comparisons) for the intermediate outcomes of glycemic control (in terms of
HbA1c), weight, or lipids?
Key Points and Evidence Grades
HbA1c
Monotherapy Versus Monotherapy
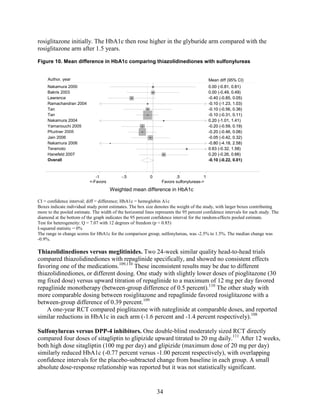
• Most oral diabetes medications had similar efficacy in achieving reductions in HbA1c,
with absolute reduction by around 1 percent compared with baseline values. The strength
of evidence was graded high for metformin versus sulfonylurea with a pooled between-
group difference of 0.1 percent (95 percent confidence interval [CI] -0.1 percent to
0.3 percent). The strength of evidence was graded as moderate for the following
comparisons: metformin versus thiazolidinediones, thiazolidinediones versus
sulfonylureas, sulfonylureas versus repaglinide, and pioglitazone versus rosiglitazone.
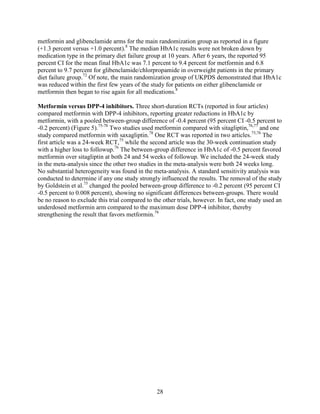
• Metformin had a greater reduction in hemoglobin A1c (HbA1c) compared with
dipeptidyl peptidase-4 (DPP-4) inhibitors, with a pooled between-group difference of
-0.4 percent (95 percent CI -0.5 percent to -0.2 percent), with moderate strength of
evidence.
Combination Therapy Versus Monotherapy
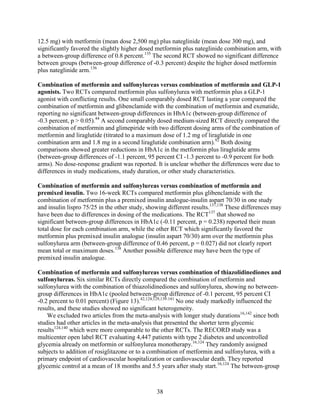
• All combination therapies were better at reducing HbA1c than monotherapy regimens,
with between-group differences of about 1 percent. The strength of evidence was graded
high for metformin versus metformin plus thiazolidinediones, and metformin versus
metformin plus sulfonylureas, and graded moderate for metformin versus metformin plus
DPP-4 inhibitors.
Combination Therapy Versus Combination Therapy
• The combination of metformin plus thiazolidinedione had similar efficacy in reducing
HbA1c compared to the combination of metformin plus sulfonylurea, with moderate
strength of evidence.
• Nine other combination therapy comparisons had low strength of evidence, making it
difficult to draw firm conclusions. However, the majority showed similar efficacy in
reducing HbA1c.
o Five combinations showed similar efficacy in reducing HbA1c: metformin plus
repaglinide versus metformin plus thiazolidinedione, metformin plus sitagliptin
versus metformin plus thiazolidinedione, metformin plus sulfonylurea versus
metformin plus DPP-4 inhibitor, metformin plus thiazolidinedione versus metformin
plus glucagon-like peptide-1 (GLP-1) agonist, and metformin plus GLP-1 agonist
versus metformin plus basal insulin.
o The combination of metformin plus GLP-1 agonist reduced HbA1c more than
metformin plus DPP-4 inhibitors, with a pooled between-group difference of
-0.6 percent (95 percent CI -0.8 percent to -0.4 percent). Two other comparisons only
17](https://image.slidesharecdn.com/afdmantidiabeticos27-151124223447-lva1-app6892/85/Af-dm-antidiabeticos-27-44-320.jpg)
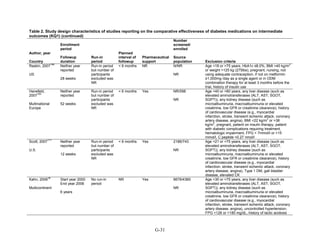
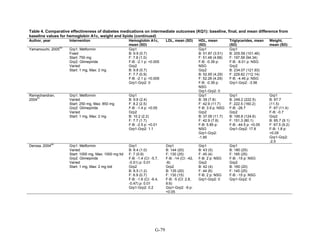
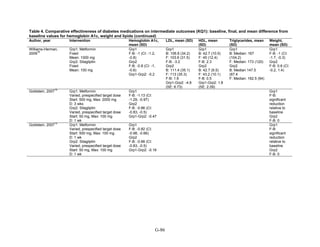
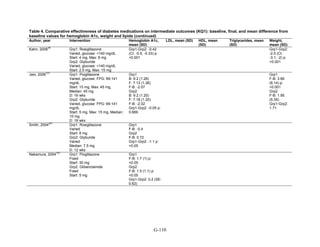
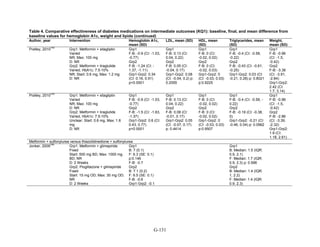
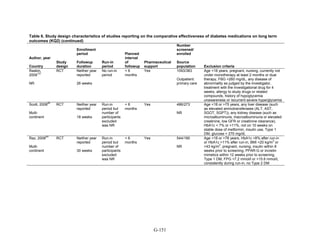
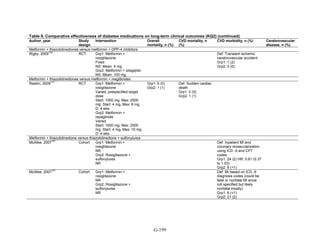
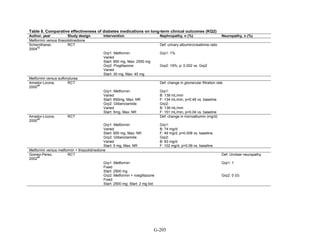
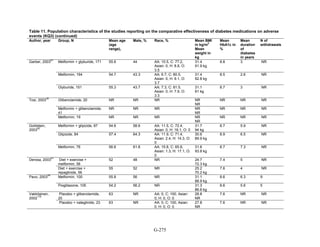
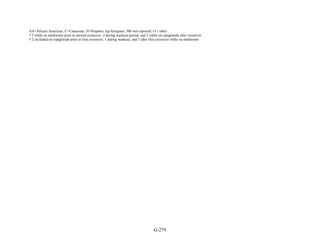
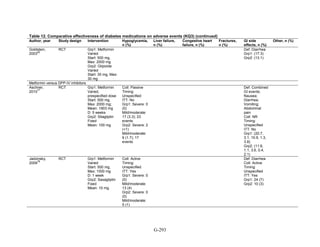
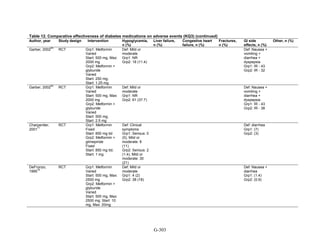
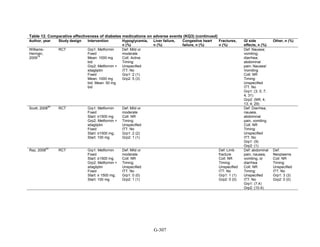
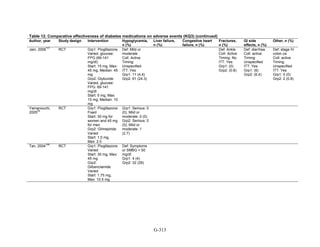
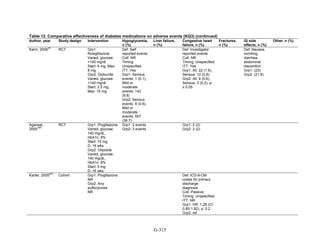
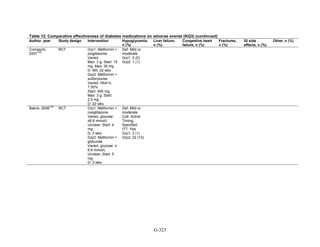
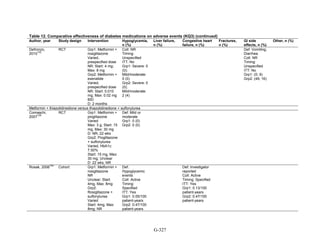
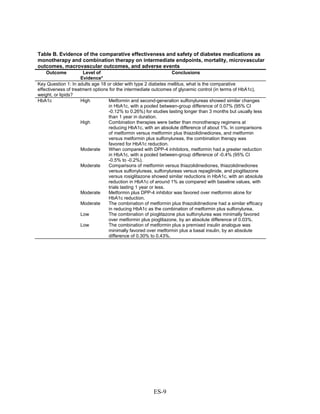
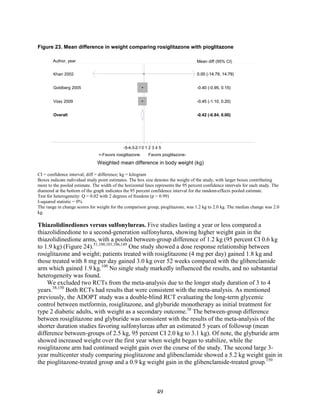
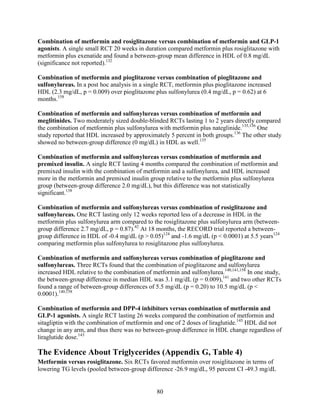
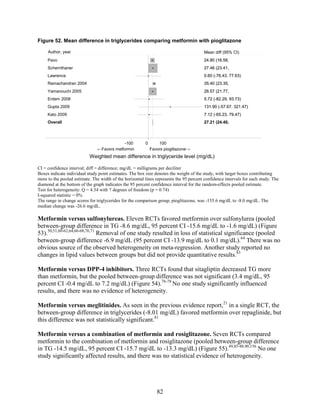
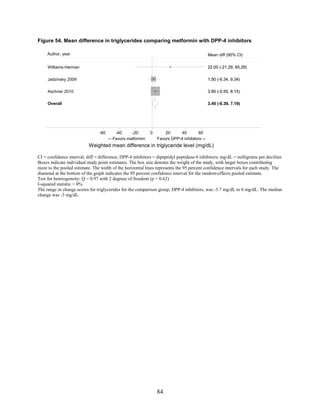
![Triglycerides
Monotherapy Versus Monotherapy
• Pioglitazone decreased triglycerides (TG) more than metformin (pooled between-group
difference -27.2 mg/dL, 95 percent CI -30.0 mg/dL to -24.4 mg/dL), with high strength of
evidence.
• Metformin decreased TG relative to rosiglitazone which increased TG (pooled between-
group difference -26.9 mg/dL, 95 percent CI -49.3 mg/dL to -4.5 mg/dL), with moderate
strength of evidence.
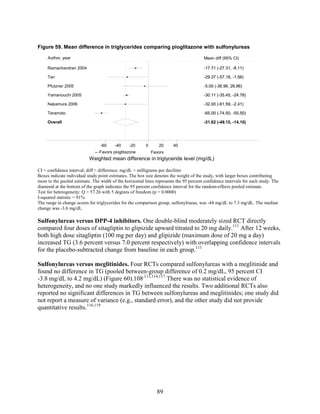
• Metformin decreased TG compared to sulfonylureas (pooled between-group difference
-8.6 mg/dL, 95 percent CI -15.6 mg/dL to -1.6 mg/dL) with moderate strength of
evidence.
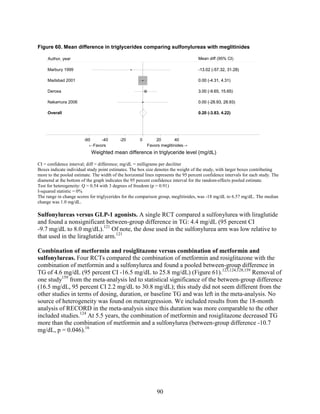
• Sulfonylureas and meglitinides had similar effects on TG (pooled between-group
difference 0.2 mg/dL, 95 percent CI -3.8 mg/dL to 4.2 mg/dL), with moderate strength of
evidence.
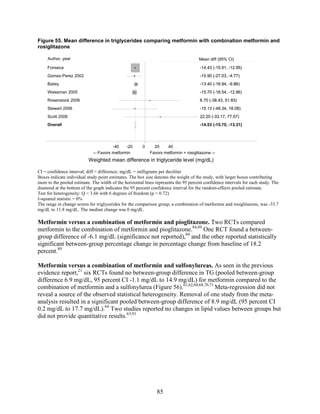
Combination Therapy Versus Monotherapy
• Metformin monotherapy decreased TG compared to the combination of metformin and
rosiglitazone (pooled between-group difference -14.5 mg/dL, 95 percent CI -15.7 mg/dL
to -13.3 mg/dL), with high strength of evidence.
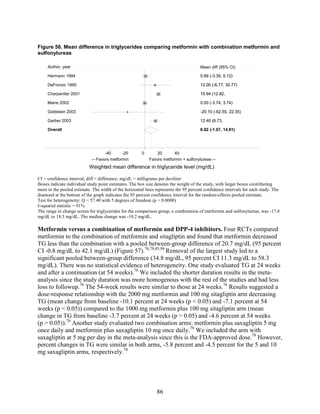
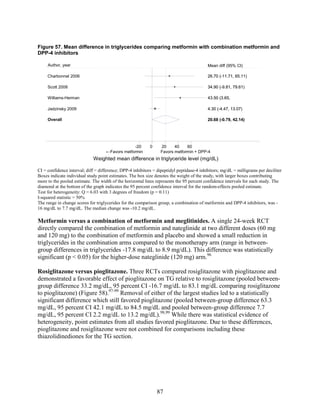
Combination Therapy Versus Combination Therapy
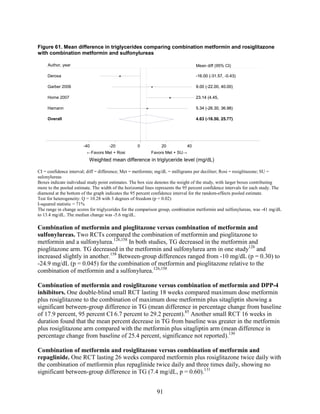
• The combination of metformin and rosiglitazone had similar effects on TG compared to a
combination of metformin and a sulfonylurea, with moderate strength of evidence.
• The combination of metformin and pioglitazone decreased TG compared to the
combination of metformin and a sulfonylurea by about 15 mg/dL, with moderate strength
of evidence.
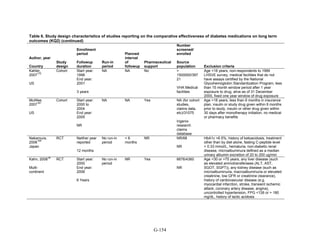
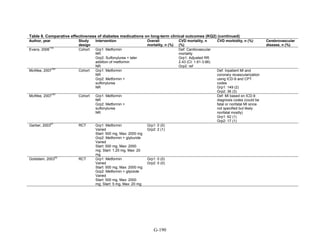
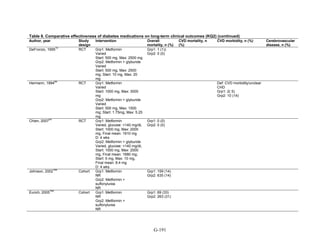
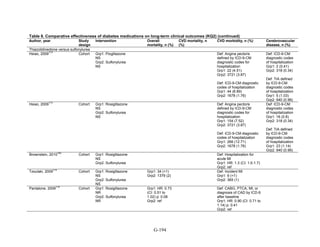
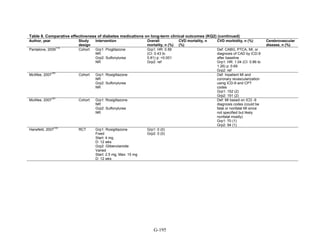
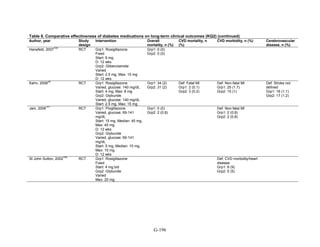
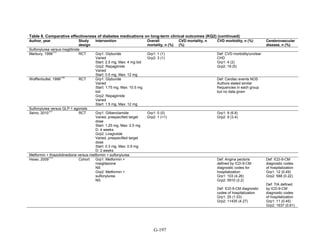
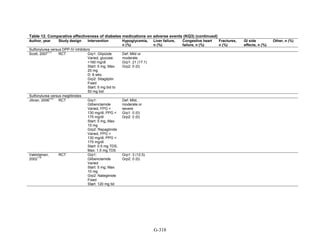
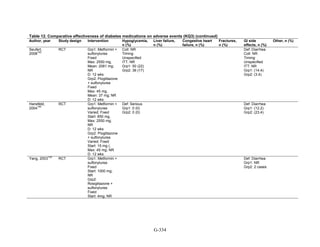
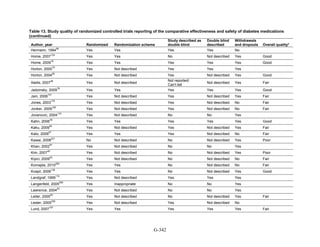
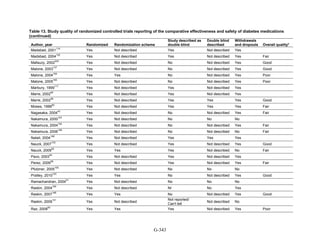
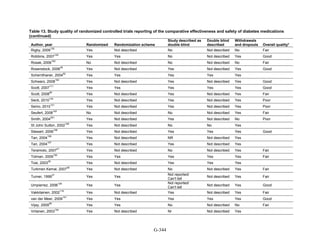
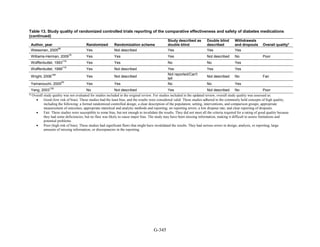
See Table 4 for the evidence grades and specific conclusions for each comparison. Details of
the evidence grades are in Appendix G, Table 1.
Study Design and Population Characteristics
One hundred nineteen randomized controlled trials (RCTs) (reported in 122 articles)
evaluated intermediate clinical outcomes for adults with type 2 diabetes, and met our inclusion
criteria (Appendix G, Tables 2 and 3). One hundred four, 79, and 74 of these RCTs reported
HbA1c, weight, and lipid outcomes, respectively. All trials were parallel-arm RCTs except one,
which used a crossover design.36
About half the trials answering Key Question 1 occurred partly
or exclusively in the United States (n = 32), Italy (n = 13), and/or were multinational (n = 28);
the rest of the trials occurred in developed or newly industrialized countries. These RCTs lasted
from 12 weeks to 9 years; however, most studies lasted less than a year and only three studies
lasted more than 2 years (United Kingdom Prospective Diabetes Study [UKPDS], Rosiglitazone
Evaluated for Cardiac Outcomes and Regulation of Glycemia in Diabetes [RECORD], and A
Diabetes Outcome Progression Trial [ADOPT]).16,37,38
Only seven studies reported receiving no
pharmaceutical support,39-45
while about one-quarter of RCTs (n = 33) did not describe whether
or not they received pharmaceutical support.
21](https://image.slidesharecdn.com/afdmantidiabeticos27-151124223447-lva1-app6892/85/Af-dm-antidiabeticos-27-48-320.jpg)


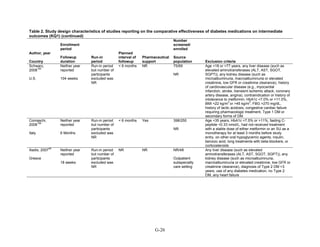
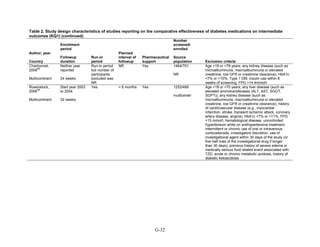
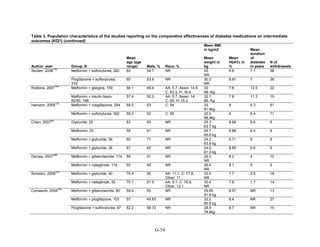
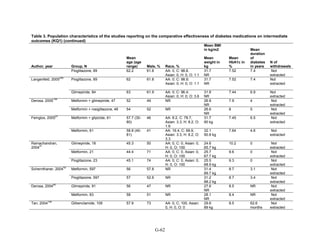
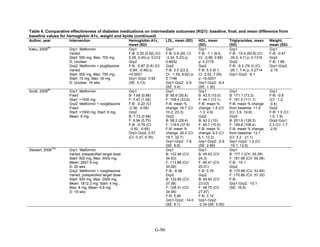
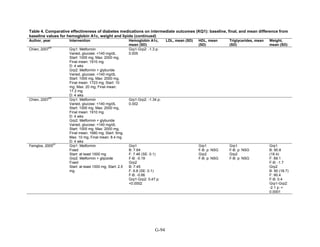
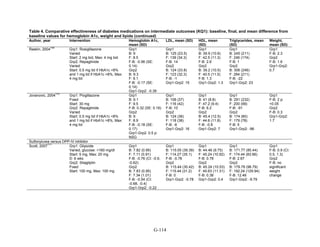
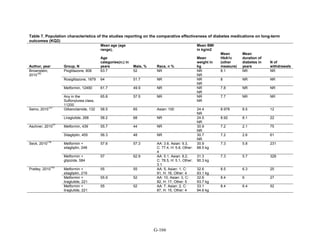
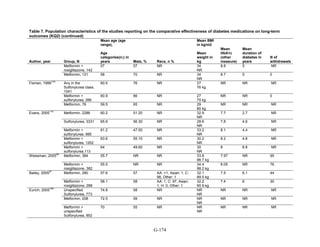
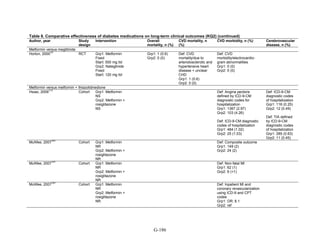
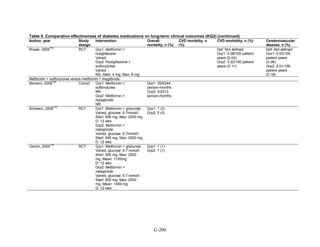
![mortality rate of 25.5 per 1000 person-years in the metformin group, with an unadjusted OR of
0.35 (95 percent CI 0.29 to 0.42) among those on metformin compared to sulfonylurea.170
A
study using the same database but extending the “enrollment period” from 1990 to 2005 with a
longer mean followup period of 7.1 years per person also found a significantly lower risk of
mortality in those using metformin as monotherapy compared to sulfonylureas with an adjusted
HR of 0.81 (95 percent CI 0.74 to 0.88).171
A nested case-control study using this data drew the
same conclusions and found that, over a median followup period of 3.5 years, those on
metformin monotherapy had an adjusted relative risk (RR) of death from any cause of 0.70 (95
percent CI 0.64 to 0.75) compared with users of sulfonylurea monotherapy. This lower risk of
death persisted among metformin users regardless of the duration of metformin use, which was
categorized as less than 4 months, 4 to 8 months, or at least 8 months.172
In a smaller Israeli cohort of people with known coronary artery disease, mortality was
similar but slightly higher among those on glyburide compared with metformin.177
A large cohort, the Veterans’ Health Administrations’ Diabetes Epidemiology Cohort,
includes all veterans with diabetes who have received care at the Department of Veterans Affairs
(VA) centers since October 1996. In that cohort, analysis showed a higher number of deaths
among subjects taking sulfonylureas (1,005 deaths of 19,053 people [5.3 percent]) compared
with subjects taking metformin only (82 deaths out of 2,988 people (2.7 percent)).175
The
adjusted OR for death for metformin versus sulfonylurea was 0.87 (95 percent CI 0.68 to 1.10),
after adjusting for propensity score plus age, diabetes duration, HbA1c, serum creatinine, number
of physician visits related to diabetes, and use of medications for dyslipidemia and
hypertension.175
Finally, the cohort study based on data from the Cleveland Clinic EHR found a lower risk of
all-cause mortality among users of metformin as initial monotherapy compared with users of
sulfonylureas, with an adjusted HR of 0.54 (95 percent CI 0.46 to 0.64); however, limitations of
this study include its lack of description of followup time and lack of description or adjustment
for addition of other diabetes medications during the study period.174
Metformin versus meglitinides. Only one 24-week trial assessed the mortality of participants
on metformin compared to a meglitinide and reported one death in the metformin arm and no
deaths in the nateglinide arm.79
Metformin versus DPP-4 inhibitors. Two short-term RCTs compared the effects of metformin
as monotherapy compared to sitagliptin as monotherapy and reported deaths during the study
period. One multinational trial over 24 weeks, with 328 participants on metformin monotherapy
and 335 participants on sitagliptin monotherapy, reported 3 deaths in the metformin arm and no
deaths in the sitagliptin arm.78
The second trial, also multinational and lasting 24 weeks, with
439 participants on metformin monotherapy and 455 participants on sitagliptin monotherapy,
reported 1 death in the sitagliptin arm due to metastatic lung cancer, thought not to be related to
the study medication.77
Metformin versus a combination of metformin and thiazolidinediones. Four RCTs of
relatively short duration, ranging from 24 to 32 weeks, and one article describing post hoc
pooled data from two different RCTs lasting 6 months each, compared the effects of metformin
as monotherapy versus a combination of metformin plus rosiglitazone. Overall, there were very
few deaths in these studies. In one RCT, there were no deaths in either arm.49
For three other
101](https://image.slidesharecdn.com/afdmantidiabeticos27-151124223447-lva1-app6892/85/Af-dm-antidiabeticos-27-128-320.jpg)
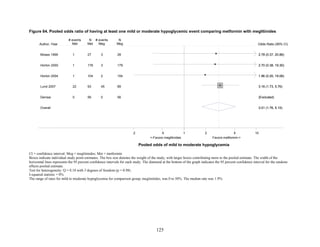
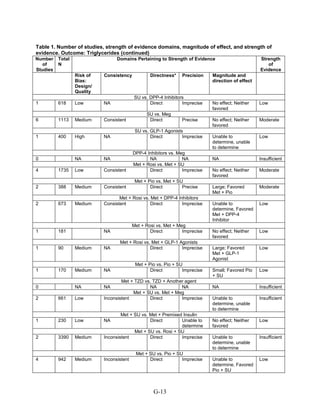
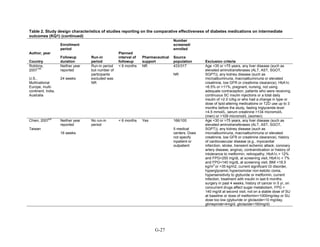
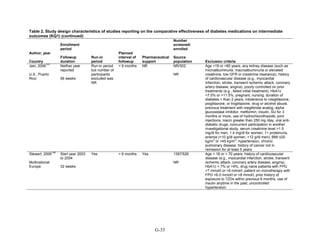
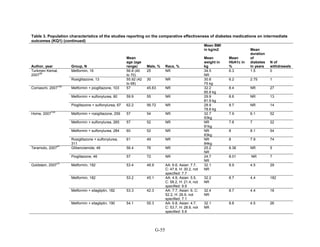
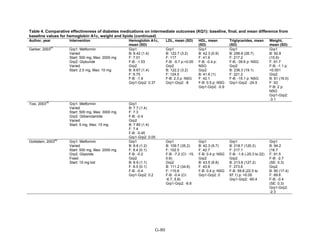
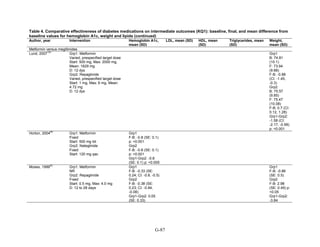
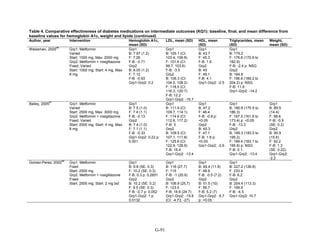
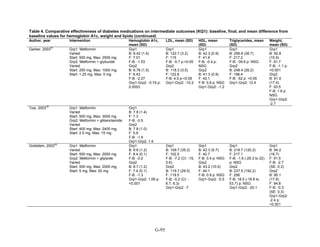
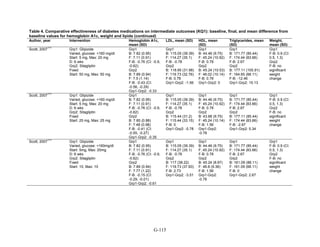
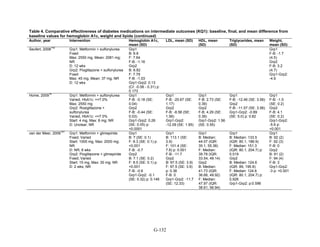
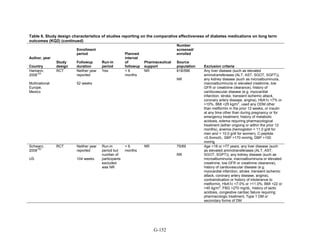
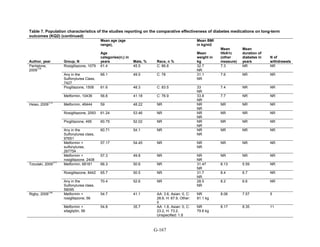
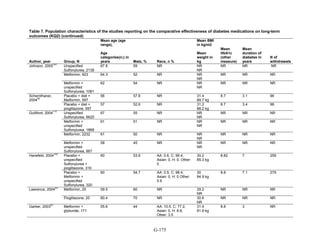
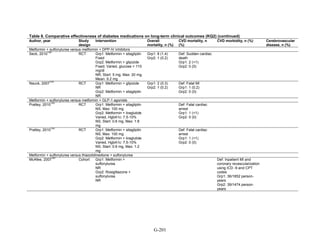
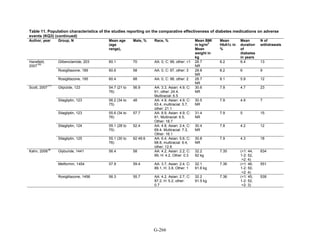
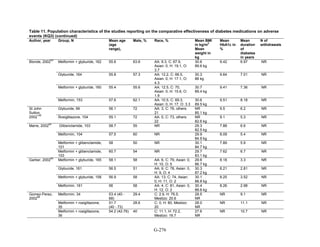
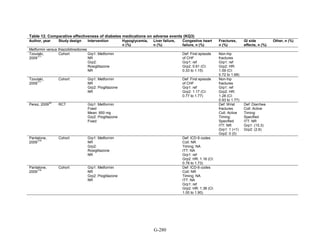
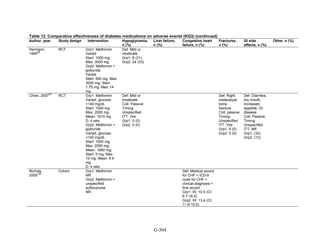
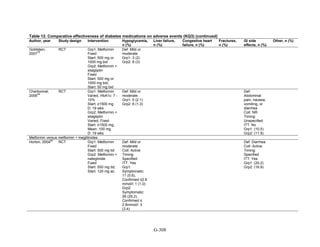
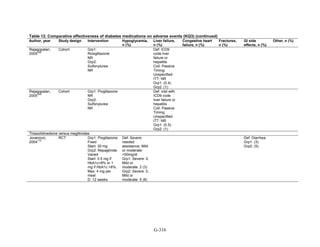
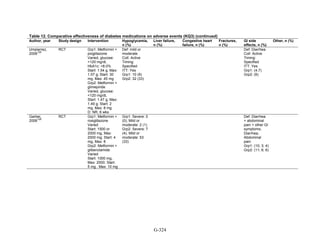
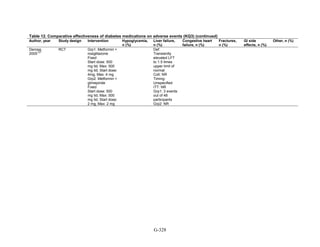
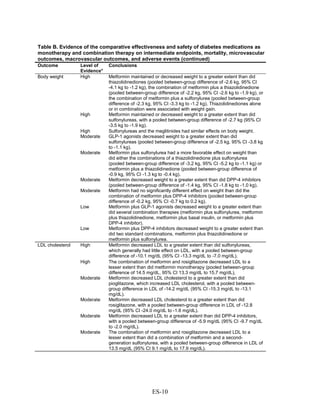
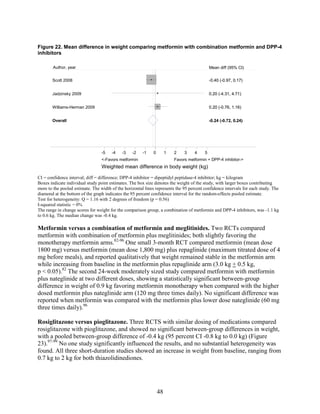
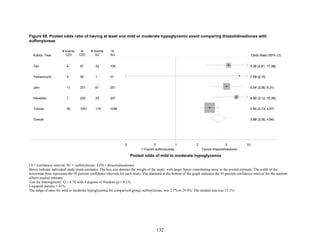
![Metformin versus a combination of metformin and DPP-4 inhibitors. Five articles,
describing four trials, examined hypoglycemia with metformin compared to metformin with
sitagliptin.75,76,85,93,94
Williams-Herman et al,76
is an extension of the Goldstein et al. trial.75
There
was minimal heterogeneity between these studies. The addition of sitagliptin to metformin does
not raise the risk of mild or moderate hypoglycemia (odds ratio [OR] = 0.9, 95 percent CI 0.4 to
2.3) (Figure 66). No additional trials or observational studies reported this outcome.
Two trials examined metformin compared to metformin plus saxagliptin at doses ranging
from 2.5 mg to 10 mg.78,95
In one, 13 of 328 patients treated with metformin had mild
hypoglycemia while 11 of 320 patients in the 5 mg saxagliptin plus metformin group had
hypoglycemia and 16 of 323 in the 10 mg saxagliptin plus metformin group did. Two patients in
the higher dose arm had severe hypoglycemia defined as serum glucose < 50 mg/dl with
symptoms.78
In the other trial, 9 of 170 metformin-treated patients had mild hypoglycemia; when
saxagliptin was added the counts were 15 of 192, 10 of 191, and 7 of 181 in the groups receiving
2.5 mg, 5 mg, and 10 mg, respectively. One patient in each arm had severe symptoms, including
the metformin only arm.95
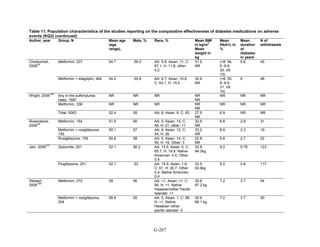
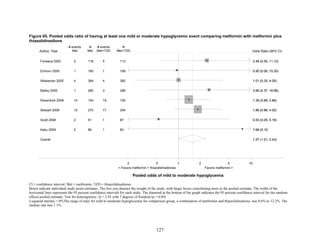
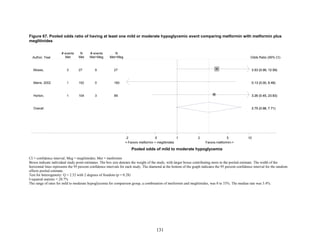
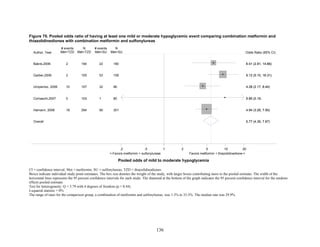
Metformin versus a combination of metformin and meglitinides. Three studies reported mild
or moderate hypoglycemia for this comparison.80,92,96
There was minimal statistical
heterogeneity between the studies. One high-quality study had very few affected individuals and
used a low dose of nateglinide.96
Results are unclear but suggest possibly an increased risk of
hypoglycemia with the combination (Figure 67). No additional trials or observational studies
reported this outcome.
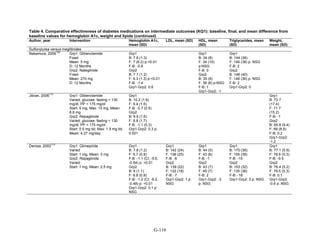
Rosiglitazone versus pioglitazone. This was addressed by a single, retrospective cohort
study.202
The subjects had poor glycemic control at cohort entry with a mean HbA1c of 9.5
percent in the rosiglitazone group and 9.6 percent in the pioglitazone group. The prevalence of
hypoglycemia did not differ significantly between groups (11 out of 96 in the rosiglitazone-
treated group and 18 out of 106 in the pioglitazone group).
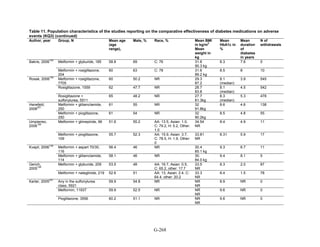
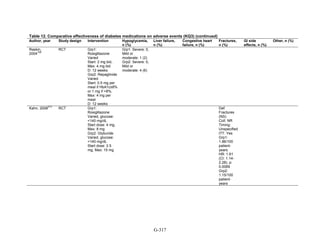
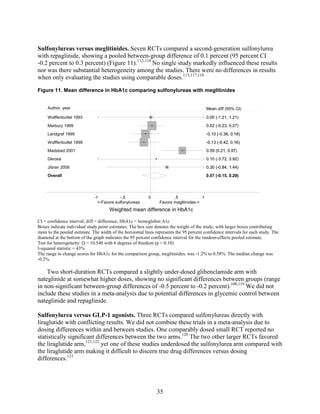
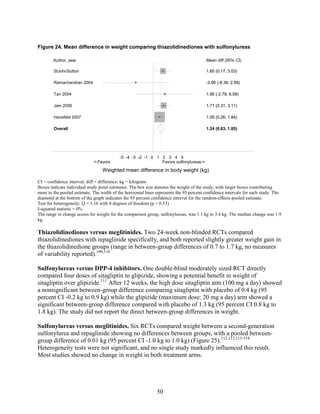
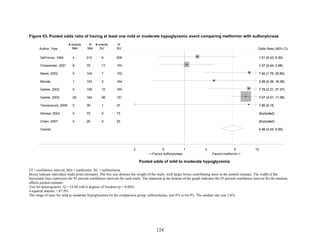
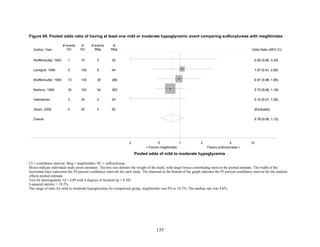
Thiazolidinediones versus sulfonylureas. Nine studies examined hypoglycemic outcomes for
this comparison.38,50,100,101,106,149,150,184,200
Two looked at counts of events rather than
individuals,38,184
and one described only the severe events in both arms.149
The pooled results for
mild or moderate hypoglycemia for the five studies reporting affected individuals showed a
higher risk of hypoglycemia among those on a sulfonylurea than on any thiazolidinedione
(OR = 3.9, 95 percent CI 3.1 to 4.9) (Figure 68).
However, the large multicontinent RCT (ADOPT) reported no significant difference in the
number of events in each group (1,341 out of 1,456 in the group on rosiglitazone and 1338 out of
1,441 in the sulfonylurea group, p = 0.44).38
This high number of events suggests that even very
minor events were included in this count. One additional trial reported two events of
hypoglycemia in the pioglitazone arm among 22 randomized participants and one event among
22 randomized participants receiving sulfonylurea (glipizide).184
A cohort study evaluating a
population over age 65 years reported that 2.6 percent of recipients of sulfonylurea reported
hypoglycemia and 2.2 percent of thiazolidinedione recipients, which are not significantly
different percentages.200
There were very few patients affected by severe hypoglycemia. Only a single individual
treated with a thiazolidinedione in the four studies reporting this outcome had an event (this was
128](https://image.slidesharecdn.com/afdmantidiabeticos27-151124223447-lva1-app6892/85/Af-dm-antidiabeticos-27-155-320.jpg)

![hypoglycemia in one arm relative to the other. Many of the studies were underpowered to
demonstrate differences for this infrequent outcome.
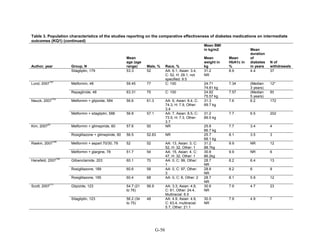
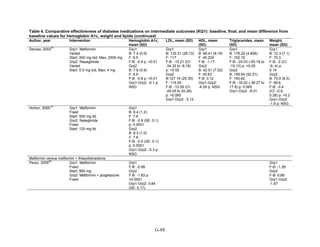
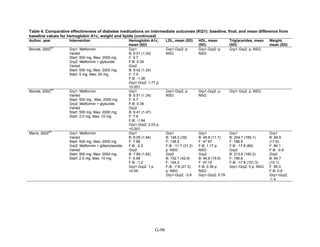
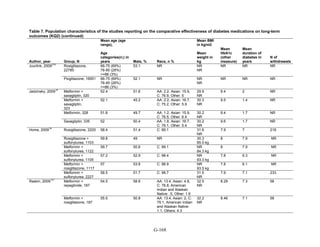
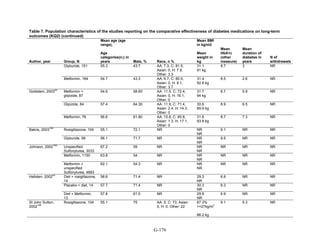
The Evidence About Liver Injury (Appendix G, Table 12)
Metformin versus thiazolidinediones. One 52-week trial compared metformin and pioglitazone
and reported on changes in liver enzymes.52
There were 3 instances of hepatotoxicity leading to
drug discontinuation—1 patient of 597 treated with metformin and 2 of 597 treated with
pioglitazone. Liver enzyme abnormalities were more frequent. In the metformin group, 2.2
percent of participants had an increase in alanine transaminase to 3 times the upper limit of
normal as did 0.9 percent of pioglitazone-treated patients (p = 0.06). In both groups, the mean
alanine transaminase, gamma-glutamyltransferase concentrations, and alkaline phosphatase
concentrations decreased during the trial. Additionally, a single cohort study assessed liver injury
with metformin as compared with pioglitazone, using propensity scores to match subjects based
on disease severity.206
The incidence of liver failure or hepatitis was defined using claims data.
For the 1,847 subjects in each group for the metformin versus pioglitazone comparison, the rate
of liver failure or hepatitis was 0.8 percent and 0.4 percent, respectively, which was not
statistically different in Cox proportional hazard models.
Metformin versus sulfonylureas. The ADOPT study, a large 6-year parallel-arm RCT,
compared metformin with glyburide, with over 1,400 subjects in each arm.38
The average age in
the metformin group was 57.9 (standard deviation [SD] 9.9). Average age in the glyburide group
was 56.4 (SD 10.4). The percentage of individuals with liver injury was 1.1 percent among the
1,341 individuals in the metformin group and 0.8 percent among the individuals in the glyburide
group. Mean alanine aminotransferase (ALT) levels were slightly higher in the glyburide group
(27.2 international units [IU]/liter; 95 percent CI 26.3 IU/liter to 28.1 IU/liter) compared to the
metformin group (24.9 IU/liter; 95 percent CI 24.1 IU/liter to 25.8 IU/liter), but the clinical
significance of this slight difference is not clear and there was no statistical test performed.
Rosiglitazone versus pioglitazone. This comparison was addressed by a single, cohort study
conducted in the US using a pharmacy database.206
As mentioned above, the diagnosis of liver
failure or hepatitis was based on claims data. There was no difference in the incidence of liver
injury between the two treatment groups. The incidence of hepatitis was 0.4 percent among the
1,847 people treated with rosiglitazone and 0.5 percent among the 1,847 treated with
pioglitazone.
Thiazolidinediones versus sulfonylureas. This comparison was addressed with the ADOPT
study, described above, which compared rosiglitazone with glyburide.38
The average age of
participants in the rosiglitazone and glyburide groups was 57.9 (SD 9.9) and 56.4 (SD 10.4),
respectively. The outcome of liver injury was based on elevated liver enzymes. There were no
cases of liver injury among the 1,456 people randomized to rosiglitazone or the 1,441 people
randomized to glyburide. The cohort study discussed above also compared pioglitazone versus
any sulfonylurea and assessed rates of liver failure and hepatitis.206
The incidence of hepatitis,
defined with claims data, was 0.6 percent among the 1,474 individuals treated with pioglitazone
and 1 percent in the 1,474 individuals treated with any sulfonylurea, which was not significant.
One additional large trial reported this outcome.150
None of the 1,051 patients receiving
140](https://image.slidesharecdn.com/afdmantidiabeticos27-151124223447-lva1-app6892/85/Af-dm-antidiabeticos-27-167-320.jpg)

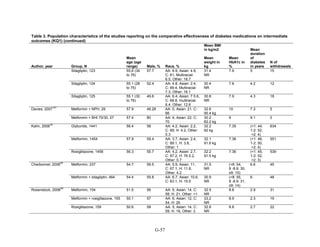
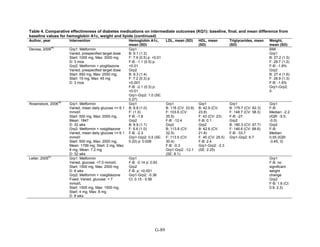
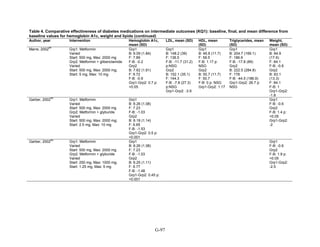
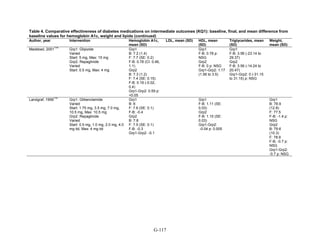
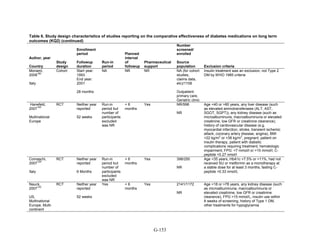
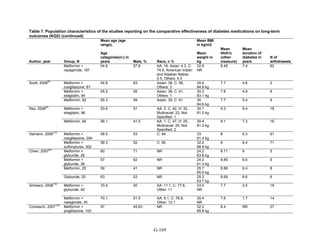
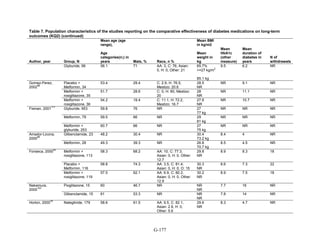
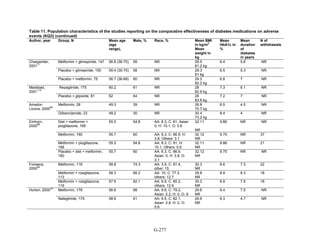
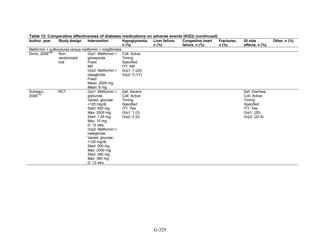
![ug/mg) there was a correlation between reduction in mean blood pressure and reduction in
albumin excretion (r = 0.875) for patients treated with rosiglitazone but not glyburide. There was
no significant difference in reduction of baseline microalbuminuria between the two groups.104
No studies included in our review compared the safety and efficacy of diabetes medications by
patients’ renal function.
Observational studies. Seven cohort studies reported on subpopulations.166,169,180,195,207,215,224
Three studies only reported analyses adjusted for several key patient characteristics but did not
specifically report differences by group.166,169,207
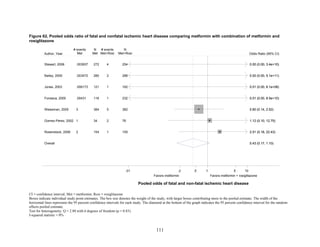
Two observational studies reported on mortality in subpopulations. One retrospective cohort
study included 8,494 participants in a nationwide population-based followup study of Danish
patients with a myocardial infarction. Among women, the use of metformin was associated with
a lower mortality rate than the use of sulfonylureas (adjusted 1-year HR 0.49, 95 percent CI 0.30
to 0.79), whereas among men the risk appeared to be increased (adjusted 1-year HR 1.82, 95
percent CI 1.25 to 2.64).224
Another study favored metformin over sulfonylurea or repaglinide
for all-cause age-adjusted mortality in people with prior ischemic heart disease.180
One study supported the finding from a RCT223
that men were more likely to develop
congestive heart failure than women regardless of pharmacologic treatments, which included
various monotherapy and combination therapies for the cohort study.195
One cohort study of 84,339 patients from British Columbia, Canada, compared fracture rates
in users of pioglitazone, rosiglitazone and sulfonylureas in men and women. In women, the
overall fracture rate among users of any thiazolidinedione was greater than sulfonylureas
(adjusted HR 1.34, 95 percent CI 1.10 to 1.64), but this was not the case for men. For both
women and men, pioglitazone use was associated with higher risk of peripheral fracture (defined
by the International Classification of Diseases, 9th Edition [ICD-9] codes) compared with
sulfonylurea (adjusted HR for women 1.77, 95 percent CI 1.32 to 2.38 and adjusted HR for men
1.61; 95 percent CI 1.18 to 2.20). Rosiglitazone use was not associated with increased fracture
risk in men or women.215
160](https://image.slidesharecdn.com/afdmantidiabeticos27-151124223447-lva1-app6892/85/Af-dm-antidiabeticos-27-187-320.jpg)
![19. Nissen SE, Wolski K. Rosiglitazone
revisited: an updated meta-analysis of risk
for myocardial infarction and cardiovascular
mortality. Arch Intern Med 2010.
20. Mann DM, Woodward M, Ye F, et al.
Trends in medication use among US adults
with diabetes mellitus: glycemic control at
the expense of controlling cardiovascular
risk factors. Arch Intern Med
2009;169(18):1718-1720.
21. Bolen S, Wilson L, Vassy J, et al.
Comparative Effectiveness and Safety of
Oral Diabetes Medications for Adults with
Type 2 Diabetes. Comparative Effectiveness
Review No. 8. (Prepared by the Johns
Hopkins Evidence-based Practice Center
under Contract No. 290-02-0018).
Rockville, MD: Agency for Healthcare
Research and Quality, 2007.
22. Nathan DM, Buse JB, Davidson MB, et al.
Medical management of hyperglycemia in
type 2 diabetes: a consensus algorithm for
the initiation and adjustment of therapy: a
consensus statement of the American
Diabetes Association and the European
Association for the Study of Diabetes.
Diabetes Care 2009;32(1):193-203.
23. Rodbard HW, Jellinger PS, Davidson JA, et
al. Statement by an American Association of
Clinical Endocrinologists/American College
of Endocrinology consensus panel on type 2
diabetes mellitus: an algorithm for glycemic
control. Endocr Pract 2009;15(6):540-559.
24. Institute of Medicine. Clinical Practice
Guidelines: Directions for a New Program.
Washington, DC: National Academy Press,
1990.
25. Berlin JA. Does blinding of readers affect
the results of meta-analyses? University of
Pennsylvania Meta-analysis Blinding Study
Group. Lancet 1997;350(9072):185-186.
26. Jadad AR, Moore RA, Carroll D, et al.
Assessing the quality of reports of
randomized clinical trials: is blinding
necessary? Control Clin Trials 1996;17(1):1-
12.
27. Guide for Conducting Comparative
Effectiveness Reviews. Rockville, MD:
Agency for Healthcare Research and
Quality, 2007.
28. Segal JB, Brotman DJ, Emadi A, et al.
Outcomes of Genetic Testing in Adults with
a History of Venous Thromboembolism.
Evidence Report No. 180. AHRQ
Publication No. 09-E011 edition. Rockville,
MD: Agency for Healthcare Research and
Quality, 2009.
29. Higgins JPT, Green S, eds. Cochrane
Handbook for Systematic Reviews for
Interventions Version 5.0.2 [updated
September 2009]. The Cochrane
Collaboration [Web page].
30. DerSimonian R, Laird N. Meta-analysis in
clinical trials. Control Clin Trials
1986;7(3):177-188.
31. Yusuf S, Peto R, Lewis J, et al. Beta
blockade during and after myocardial
infarction: an overview of the randomized
trials. Prog Cardiovasc Dis 1985;27(5):335-
371.
32. Sweeting MJ, Sutton AJ, Lambert PC. What
to add to nothing? Use and avoidance of
continuity corrections in meta-analysis of
sparse data. Stat Med 2004;23(9):1351-
1375.
33. Higgins JP, Thompson SG, Deeks JJ, et al.
Measuring inconsistency in meta-analyses.
BMJ 2003;327(7414):557-60.
34. Begg CB, Mazumdar M. Operating
characteristics of a rank correlation test for
publication bias. Biometrics
1994;50(4):1088-1101.
35. Egger M, Davey Smith G, Schneider M, et
al. Bias in meta-analysis detected by a
simple, graphical test. BMJ
1997;315(7109):629-634.
36. Tosi F, Muggeo M, Brun E, et al.
Combination treatment with metformin and
glibenclamide versus single-drug therapies
in type 2 diabetes mellitus: a randomized,
double-blind, comparative study.
Metabolism 2003;52(7):862-867.
37. Turner RC, Cull CA, Frighi V, et al.
Glycemic control with diet, sulfonylurea,
metformin, or insulin in patients with type 2
diabetes mellitus: progressive requirement
for multiple therapies (UKPDS 49). UK
Prospective Diabetes Study (UKPDS)
Group. JAMA 1999;281(21):2005-2012.
178](https://image.slidesharecdn.com/afdmantidiabeticos27-151124223447-lva1-app6892/85/Af-dm-antidiabeticos-27-205-320.jpg)
![231. Belcher G, Lambert C, Edwards G, et al.
Safety and tolerability of pioglitazone,
metformin, and gliclazide in the treatment of
type 2 diabetes. Diabetes Res Clin Pract
2005;70(1):53-62.
232. Charbonnel B, Schernthaner G, Brunetti P,
et al. Long-term efficacy and tolerability of
add-on pioglitazone therapy to failing
monotherapy compared with addition of
gliclazide or metformin in patients with type
2 diabetes. Diabetologia 2005;48(6):1093-
1104.
233. Ceriello A, Johns D, Widel M, et al.
Comparison of effect of pioglitazone with
metformin or sulfonylurea (monotherapy
and combination therapy) on postload
glycemia and composite insulin sensitivity
index during an oral glucose tolerance test in
patients with type 2 diabetes. Diabetes Care
2005;28(2):266-272.
234. Rendell MS, Glazer NB, Ye Z. Combination
therapy with pioglitazone plus metformin or
sulfonylurea in patients with Type 2
diabetes: influence of prior antidiabetic drug
regimen. J Diabetes Complications
2003;17(4):211-217.
235. Monami M, Lamanna C, Marchionni N, et
al. Comparison of different drugs as add-on
treatments to metformin in type 2 diabetes: a
meta-analysis. Diabetes Res Clin Pract
2008;79(2):196-203.
236. Phung OJ, Scholle JM, Talwar M, et al.
Effect of noninsulin antidiabetic drugs
added to metformin therapy on glycemic
control, weight gain, and hypoglycemia in
type 2 diabetes. JAMA 2010;303(14):1410-
1418.
237. Kahn BB, Flier JS. Obesity and insulin
resistance. J. Clin. Invest. 2000;106(4):473-
481.
238. Monami M, Marchionni N, Mannucci E.
Glucagon-like peptide-1 receptor agonists in
type 2 diabetes: a meta-analysis of
randomized clinical trials. Eur J Endocrinol
2009;160(6):909-917.
239. Barrera JG, D’Alessio DA, Drucker DJ, et
al. Differences in the central anorectic
effects of glucagon-like peptide-1 and
exendin-4 in rats. Diabetes
2009;58(12):2820-2827.
240. Williams DL, Baskin DG, Schwartz MW.
Leptin regulation of the anorexic response to
glucagon-like peptide-1 receptor
stimulation. Diabetes 2006;55(12):3387-
3393.
241. Hu FB, Stampfer MJ, Solomon CG, et al.
The impact of diabetes mellitus on mortality
from all causes and coronary heart disease in
women: 20 years of follow-up. Arch Intern
Med 2001;161(14):1717-1723.
242. Selvin E, Bolen S, Yeh HC, et al.
Cardiovascular outcomes in trials of oral
diabetes medications: a systematic review.
Arch Intern Med 2008;168(19):2070-2080.
243. Food and Drug Administration. Briefing
document: July 13-14, 2010 meeting of the
Endocrinologic and Metabolic Drugs
Advisory Committee. [Web Page]. Accessed
October 27, 2010).
244. Rosen CJ. Revisiting the rosiglitazone
story—lessons learned. N Engl J Med
2010;363(9):803-806.
245. Woodcock J, Sharfstein JM, Hamburg M.
Regulatory action on rosiglitazone by the
U.S. Food and Drug Administration. N Engl
J Med 2010;363(16):1489-1491.
246. Richter B, Bandeira-Echtler E, Bergerhoff
K, et al. Rosiglitazone for type 2 diabetes
mellitus. Cochrane Database Syst Rev
2007;(3):CD006063.
247. Bolen S, Feldman L, Vassy J, et al.
Systematic review: comparative
effectiveness and safety of oral medications
for type 2 diabetes mellitus. Ann Intern Med
2007;147(6):386-399.
248. Lago RM, Singh PP, Nesto RW. Congestive
heart failure and cardiovascular death in
patients with prediabetes and type 2 diabetes
given thiazolidinediones: a meta-analysis of
randomised clinical trials. Lancet
2007;370(9593):1129-1136.
249. Singh S, Loke YK, Furberg CD. Long-term
risk of cardiovascular events with
rosiglitazone: a meta-analysis. JAMA
2007;298(10):1189-1195.
250. GlaxoSmithKline. AVANDIA package
insert. Available at:
http://us.gsk.com/products/assets/us_avandia
.pdf. Accessed December 9, 2009.
190](https://image.slidesharecdn.com/afdmantidiabeticos27-151124223447-lva1-app6892/85/Af-dm-antidiabeticos-27-217-320.jpg)
![Appendix B. Detailed Electronic Database Search
Strategies
MEDLINE Strategy
Terms Returns
(“diabetes mellitus, type 2”[mh] or (diabet*[tiab] and (“non-insulin dependent”[tiab] or type-2[tiab]
or “type II”[tiab] or “type 2”[tiab]))) AND (“thiazolidinediones”[mh] or “glipizide”[mh] or
“glyburide”[mh] or “metformin”[mh] or “acarbose”[mh] or thiazolidinedione*[tiab] or
pioglitazone[tiab] or rosiglitazone[tiab] or sulfonylurea*[tiab] or sulphonylurea*[tiab] or
glipizide[tiab] or glyburide[tiab] or glimepiride[tiab] or glibenclamide[tiab] or biguanide*[tiab] or
metformin[tiab] or “insulin secretagogues”[tiab] or meglitinide*[tiab] or repaglinide[tiab] or
nateglinide[tiab] or “alpha-glucosidase inhibitors”[tiab] or “alpha-glucosidase inhibitor”[tiab] or
acarbose[tiab] or “Dipeptidyl-Peptidase IV Inhibitors”[mh] or sitagliptin*[tiab] or saxagliptin*[tiab] or
dpp-4[tiab] or dpp-iv[tiab] or bromocriptine[mh] or bromocriptine[tiab] or colesevelam[tiab] or
“Glucagon-Like Peptide 1”[mh] or liraglutide[tiab] or exenatide[tiab]) AND English[lang] NOT
(animal[mh] NOT human[mh]) NOT (letter[pt] or comment[pt] or editorial[pt])
7927
Embase Strategy
('non insulin dependent diabetes mellitus'/exp OR 'non insulin dependent diabetes mellitus' or
(diabet*:ti,ab and (‘non-insulin dependent’:ti,ab or type-2:ti,ab or ‘type II’:ti,ab or ‘type 2’:ti,ab)))
AND ('thiazolidinedione'/exp or 'rosiglitazone'/exp or 'pioglitazone'/exp or 'glipizide'/exp or
'glyburide'/exp or ‘glimepiride’/exp or 'metformin'/exp or 'alpha glucosidase inhibitor'/exp or
'acarbose'/exp or ‘sitagliptin’/exp or ‘colesevelam”/exp or thiazolidinedione*:ti,ab or
pioglitazone:ti,ab or rosiglitazone:ti,ab or sulfonylurea*:ti,ab or sulphonylurea*:ti,ab or
glipizide:ti,ab or glyburide:ti,ab or glimepiride:ti,ab or glibenclamide:ti,ab or biguanide*:ti,ab or
metformin:ti,ab or ‘insulin secretagogues’:ti,ab or meglitinide*:ti,ab or repaglinide:ti,ab or
nateglinide:ti,ab or ‘alpha-glucosidase inhibitors’:ti,ab or ‘alpha-glucosidase inhibitor’:ti,ab or
acarbose:ti,ab or ‘Dipeptidyl-Peptidase IV Inhibitor’/exp or saxagliptin/exp or saxagliptin*:ti,ab or
sitagliptin/exp or sitagliptin*:ti,ab or dpp-4:ti,ab or dpp-iv:ti,ab or 'bromocriptine mesilate'/exp or
bromocriptine:ti,ab or colesevelam:ti,ab or exenatide/exp or exenatide:ti,ab or liraglutide/exp or
liraglutide:ti,ab) AND [english]/lim NOT ([animals]/lim NOT [humans]/lim) NOT (letter:it or
comment:it or editorial:it)
16093
The Cochrane Central Register of Controlled Trials
(CENTRAL)
(diabetes near type-2) or (diabet*:ti,ab,kw and (“non-insulin dependent”:ti,ab,kw or type-2:ti,ab,kw
or “type II”:ti,ab,kw or “type 2”:ti,ab,kw)) AND (thiazolidinedione*:ti,ab,kw or pioglitazone:ti,ab,kw
or rosiglitazone:ti,ab,kw or sulfonylurea*:ti,ab,kw or sulphonylurea*:ti,ab,kw or glipizide:ti,ab,kw or
glyburide:ti,ab,kw or glimepiride:ti,ab,kw or glibenclamide:ti,ab,kw or biguanide*:ti,ab,kw or
metformin:ti,ab,kw or “insulin secretagogues”:ti,ab,kw or meglitinide*:ti,ab,kw or
repaglinide:ti,ab,kw or nateglinide:ti,ab,kw or “alpha-glucosidase inhibitors”:ti,ab,kw or “alpha-
glucosidase inhibitor”:ti,ab,kw or acarbose:ti,ab,kw or “Dipeptidyl-Peptidase IV Inhibitors”:ti,ab,kw
or saxagliptin*:ti,ab,kw or sitagliptin*:ti,ab,kw or liraglutide:ti,ab,kw or exenatide:ti:ab,kw or
bromocriptine:ti,ab,kw or colesevelam:ti,ab,kw)
6507
B-1](https://image.slidesharecdn.com/afdmantidiabeticos27-151124223447-lva1-app6892/85/Af-dm-antidiabeticos-27-224-320.jpg)


![Anon. Dual PPAR agonist improves glycemic control, lipids in type 2 diabetes. Geriatrics 2005;
60(8):12. No original data
Anon. Effect of AC2993 (synthetic exendin-4) compared with insulin glargine in patients with
type 2 diabetes also using combination therapy with sulfonylurea and metformin. Eli Lilly
Clinical Trial Registry Summary 2007. Does not have a drug comparison of interest
Anon. Effect of intensive blood-glucose control with metformin on complications in overweight
patients with type 2 diabetes (UKPDS 34). UK Prospective Diabetes Study (UKPDS) Group.
Lancet 1998; 352(9131):854-65. Does not have a drug comparison of interest
Anon. Effect of Repaglinide and Metformin Combination Tablet or Rosiglitazone and Metformin
in Fixed Dose Combination on Blood Glucose Control in Patients With Type 2 Diabetes.
ClincalTrials.gov identifier: NCT00399711. Other reason
Anon. Effects of metformin or repaglinide therapy for diabetes on serum markers for CVD. Nat
Clin. Pract Endocrinol Metab 2008; 4(8):427. No original data
Anon. Efficacy and safety of pioglitazone. Aust J. Pharm 2008; 89(1064):62-3. No original data
Anon. Efficacy and Safety of Repaglinide and Metformin Combination Therapy in Type 2
Diabetes Failing on OAD. ClinicalTrials.gov identifier: NCT00491725. Other reason
Anon. Efficacy and Safety of Repaglinide and Metformin Combined in Type 2 Diabetes.
ClinicalTrials.gov identifier: NCT00491725. Other reason
Anon. Efficacy of exenatide [AC2993, synthetic exendin-4, LY2148568] compared with twice-
daily biphasic insulin aspart in patients with type 2 diabetes using sulfonylurea and metformin.
Eli Lilly Clinical Trial Registry Summary 2007. 2007. Other reason
Anon. Erratum: Saxagliptin added to a submaximal dose of sulphonylurea improves glycaemic
control compared with uptitration of sulphonylurea in patients with type 2 diabetes: A
randomised controlled trial (International Journal of Clinical Practice (2009) 63 (1395-1406)).
Int J Clin Pract 2010; 64(2):277. Other reason
Anon. Exenatide (Byetta) for type 2 diabetes. Med Lett Drugs Ther 2005; 47(1210):45-6. No
original data
Anon. First reports of serious adverse drug reactions in recent weeks. Drugs Ther Perspect 2006;
22(3):20-1. No original data
Anon. Improved risk profile with pioglitazone. Br J Diabetes Vasc Dis 2003; 3(6):446. No
original data
Anon. Inhaled insulin superior to rosiglitazone in patients with uncontrolled type 2 diabetes.
Formulary 2003; 38(7):408. No original data
Anon. Insulin sensitizer affects lipids. Health News 2005; 11(1):2. No original data
Anon. Intensive blood-glucose control with sulphonylureas or insulin compared with
conventional treatment and risk of complications in patients with type 2 diabetes (UKPDS 33).
UK Prospective Diabetes Study (UKPDS) Group. Lancet 1998; 352(9131):837-53. Does not
have a drug comparison of interest
Anon. Janumet. JAAPA 2007; 20(6):14. No original data
F-3](https://image.slidesharecdn.com/afdmantidiabeticos27-151124223447-lva1-app6892/85/Af-dm-antidiabeticos-27-252-320.jpg)
![Anon. Landmark PROactive trial investigates effect of ACTOS (pioglitazone HCl) on
cardiovascular disease progression: More than 5,000 patients with type 2 diabetes studied. Publ.
Takeda Res. Lab. 2004; 2004(-). Other reason
Anon. New data shows Takeda's ACTOS(registered trademark) (pioglitazone HCl) reduced heart
attacks by 28 percent in people with type 2 diabetes. Publ. Takeda Res. Lab. 2005; 2005(-).
Other reason
Anon. Oral agents for type 2 diabetes reduce HbA1c, are weight neutral. Geriatrics: Geriatrics
2006; 61(9):2 p following 13. No original data
Anon. PERISCOPE: pioglitazone offers the right cluster of effects to confer benefit in type 2
diabetes. Cardiovasc J Afr 2008; 19(3):159-62. No original data
Anon. Pre-meal inhaled insulin lowers HbA1c levels more effectively than rosiglitazone.
Formulary 2005; 40(11):396. No original data
Anon. Primary prevention of cerebrovascular and cardiovascular events with an oral antidiabetic
agent in patients with type 2 diabetes at high risk for cerebral infarction. UMIN CTR
[Https://Center.Umin.Ac.Jp] 2009. Not written in English
Anon. PROactive study shows reduced heart attacks and strokes in type 2 diabetics on
pioglitazone HCI (Actos) therapy. Cardiovasc J S Afr 2005; 16(5):286-7; discussion 287. No
original data
Anon. Rosiglitazone decreases coronary restenosis. Cardiol Rev 2003; 20(8):11. No original data
Anon. Rosiglitazone increased heart failure but did not differ from metformin plus sulphonylurea
for other CV outcomes at interim analysis. Evid.-Based Med. 2007; 12(6):170. No original data
Anon. Rosiglitazone plus metformin combination improves glycaemic control in diabetes. Pharm
J 2004; 273(7317):375. No comparison group
Anon. Sitagliptin combined with sulphonylureas: new indication. Other treatments are
preferable. Prescrire Int 2009; 18(99):14-5. No original data
Anon. Summaries for patients. A comparison of three insulin regimens (morning glargine,
bedtime glargine, or bedtime neutral protamine Hagedorn) in addition to a pill for treating type 2
diabetes. Ann Intern Med 2003; 138(12):I33. No original data
Anon. Summaries for patients. Comparison of two types of insulin added to diabetes pills in
poorly controlled type 2 diabetes. Ann Intern Med 2008; 149(8):I-46. No original data
Anon. The effect of adding exenatide to a thiazolidinedione in suboptimally controlled type 2
diabetes: A randomized trial (Annals of Internal Medicine (2007) 146 (477-485)). Ann Intern
Med. 2007; 146(12):896. No original data
Anon. The efficacy and safety of glimepiride in the management of type 2 diabetes in Muslim
patients during Ramadan. Diabetes Care 2005; 28(2):421-2. No comparison group
Anon. Thiazolidinediones could exacerbate BMD loss in elderly women. Nat. Clin. Pract.
Endocrinol. Metab. 2006; 2(12):654-5. No original data
F-4](https://image.slidesharecdn.com/afdmantidiabeticos27-151124223447-lva1-app6892/85/Af-dm-antidiabeticos-27-253-320.jpg)
![Baksi A, James RE, Zhou B, Nolan JJ. Comparison of uptitration of gliclazide with the addition
of rosiglitazone to gliclazide in patients with type 2 diabetes inadequately controlled on half-
maximal doses of a sulphonylurea. Acta Diabetol 2004; 41(2):63-9. Does not have a drug
comparison of interest
Balkrishnan R, Rajagopalan R, Shenolikar RA, Camacho FT, Anderson RT. Outcomes
associated with introduction of thiazolidinedione therapy in Medicaid enrolled patients with type
2 diabetes: an updated and expanded retrospective analysis. Curr Med Res Opin 2006;
22(3):551-9. Does not have a drug comparison of interest
Ballani P, Tran MT, Navar MD, Davidson MB. Clinical experience with U-500 regular insulin in
obese, markedly insulin-resistant type 2 diabetic patients. Diabetes Care 2006; 29(11):2504-5.
Less than 40 subjects with type 2 diabetes
Ballary C, Desai A. Efficacy and safety of a combination of metformin and rosiglitaone in
patients with type 2 diabetes mellitus--a postmarketing study. J Indian Med Assoc 2003;
101(2):113-4, 123. No comparison group
Barnes DJ et al. Microalbuminuria in type 2 diabetic patients: a cross sectional study. Ann Clin
Biochem 1994; 31 ( Pt 6):588-9. No original data
Barnett AH et al. Multicentre study to assess quality of life and glycaemic control of Type 2
diabetic patients treated with insulin compared with oval hypoglycaemic agents. Practical
Diabetes International. 1996; 13(6):179-83. Does not have a drug comparison of interest
Barnett AH, Burger J, Johns D et al. Tolerability and efficacy of exenatide and titrated insulin
glargine in adult patients with type 2 diabetes previously uncontrolled with metformin or a
sulfonylurea: a multinational, randomized, open-label, two-period, crossover noninferiority trial.
Clin Ther 2007; 29(11):2333-48. Does not have a drug comparison of interest
Barnett AH, Dreyer M, Lange P, Serdarevic-Pehar M. An open, randomized, parallel-group
study to compare the efficacy and safety profile of inhaled human insulin (Exubera) with
glibenclamide as adjunctive therapy in patients with type 2 diabetes poorly controlled on
metformin. Diabetes Care 2006; 29(8):1818-25. Does not have a drug comparison of interest
Barnett AH, Grant PJ, Hitman GA et al. Rosiglitazone in Type 2 diabetes mellitus: an evaluation
in British Indo-Asian patients. Diabet Med 2003; 20(5):387-93. Does not have a drug
comparison of interest
Barranco C. Pioglitazone improves cardiovascular risk markers for patients with diabetes. Nat.
Clin. Pract. Cardiovasc. Med. 2005; 2(9):438. No original data
Barzilay JI et al. Coronary artery disease and coronary artery bypass grafting in diabetic patients
aged > or = 65 years (report from the Coronary Artery Surgery Study [CASS] Registry). Am J
Cardiol 1994; 74(4):334-9. Does not apply
F-6](https://image.slidesharecdn.com/afdmantidiabeticos27-151124223447-lva1-app6892/85/Af-dm-antidiabeticos-27-255-320.jpg)
![Brown JB, Pedula KL. Metformin as secondary therapy in a defined population with type 2
diabetes. Clin Ther 1999; 21(10):1678-87. Does not have a drug comparison of interest
Brown RR. Cost-effectiveness and clinical outcomes of metformin or insulin add-on therapy in
adults with type 2 diabetes. Am J Health Syst Pharm 1998; 55(24 Suppl 4):S24-7. Does not have
a drug comparison of interest
Brunelli SM, Thadhani R, Ikizler TA, Feldman HI. Thiazolidinedione use is associated with
better survival in hemodialysis patients with non-insulin dependent diabetes. Kidney Int 2009;
75(9):961-8. Does not meet the study design criteria
Bruns W et al. Treatment of type II diabetics (non-insulin-dependent) for sulphonylurea
secondary failure - combined therapy, using glibenclamid and insulin. Zeitschrift Fⁿr Klinische
Medizin 1990; 45(11):983-6. Does not apply
Bu S et al. [Evaluation of the efficacy and safety of once daily injection of glargine combined
with glipizide GITS in the treatment of type 2 diabetes mellitus]. Chinese Journal of Evidence-
Based Medicine 2004; 4(7):464-7. Not written in English
Bunck MC, Mari A, Comer A et al. One-year exenatide treatment improves beta cell response in
metformin treated patients with type 2 diabetes which is sustained after 5 weeks discontinuation
of treatment. Diabetologia: Diabetologia 2009; 52(S1):S7. No original data
Buse J, Sesti G, Schmidt WE et al. A switch from twice-daily exenatide to once-daily liraglutide
further improves glycaemic control in patients with type 2 diabetes on oral agents. Diabetologia:
Diabetologia 2009; 52(S1):S7-S8. Other reason
Buse JB, Rosenstock J, Sesti G et al. Liraglutide once a day versus exenatide twice a day for type
2 diabetes: a 26-week randomised, parallel-group, multinational, open-label trial (LEAD-6).
Lancet 2009; 374(9683):39-47. Other reason
Buse JB, Sesti G, Schmidt WE et al. Switching to once-daily liraglutide from twice-daily
exenatide further improves glycemic control in patients with type 2 diabetes using oral agents.
Diabetes Care 2010. Does not have a drug comparison of interest
Buysschaert M, Hermans MP. Glycaemic and blood pressure controls achieved in a cohort of
318 patients with type 2 diabetes. Acta Clin Belg 1999; 54(6):328-33. Does not have a drug
comparison of interest
Bytzer P, Talley NJ, Jones MP, Horowitz M. Oral hypoglycaemic drugs and gastrointestinal
symptoms in diabetes mellitus. Aliment Pharmacol Ther 2001; 15(1):137-42. Does not have a
drug comparison of interest
Calle-Pascual A et al. Influence of 16-week monotherapy with acarbose on cardiovascular risk
factors in obese subjects with non-insulin-dependent diabetes mellitus: a controlled, double-blind
comparison study with placebo. Diabetes & Metabolism 1996; 22(3):201-2. Does not have a
drug comparison of interest
Calvert MJ, McManus RJ, Freemantle N. The management of people with type 2 diabetes with
hypoglycaemic agents in primary care: retrospective cohort study. Fam Pract 2007; 24(3):224-9.
Does not meet the study design criteria
Campbell IW, Chalmers J, Herlihy OM. Sulphonylurea-induced hypoglycaemia in elderly people
with diabetes. Pract Diabetes 1994; 11(3):102-3. No original data
F-10](https://image.slidesharecdn.com/afdmantidiabeticos27-151124223447-lva1-app6892/85/Af-dm-antidiabeticos-27-259-320.jpg)
![Gerstein HC, Garon J, Joyce C, Rolfe A, Walter CM. Pre-prandial vs. post-prandial capillary
glucose measurements as targets for repaglinide dose titration in people with diet-treated or
metformin-treated Type 2 diabetes: a randomized controlled clinical trial. Diabet Med 2004;
21(11):1200-3. Does not apply
Gerstein HC, Ratner RE, Cannon CP et al. Effect of rosiglitazone on progression of coronary
atherosclerosis in patients with type 2 diabetes mellitus and coronary artery disease: the
assessment on the prevention of progression by rosiglitazone on atherosclerosis in diabetes
patients with cardiovascular history trial. Circulation 2010; 121(10):1176-87. Does not have a
drug comparison of interest
Gerstein HC, Riddle MC, Kendall DM et al. Glycemia treatment strategies in the Action to
Control Cardiovascular Risk in Diabetes (ACCORD) trial. Am J Cardiol 2007; 99(12A):34i-43i.
No original data
Gerstein HC, Yale JF, Harris SB, Issa M, Stewart JA, Dempsey E. A randomized trial of adding
insulin glargine vs. avoidance of insulin in people with Type 2 diabetes on either no oral
glucose-lowering agents or submaximal doses of metformin and/or sulphonylureas. The
Canadian INSIGHT (Implementing New Strategies with Insulin Glargine for Hyperglycaemia
Treatment) Study. Diabet Med 2006; 23(7):736-42. Does not have a drug comparison of interest
Gerstein HC.Miller ME. Effects of intensive glucose lowering in type 2 diabetes. Action to
Control Cardiovascular Risk in Diabetes Study Group. N Engl J Med 2008; 358(24):2545-59.
Does not apply
Giles TD, Miller AB, Elkayam U, Bhattacharya M, Perez A. Pioglitazone and heart failure:
results from a controlled study in patients with type 2 diabetes mellitus and systolic dysfunction.
J Card Fail 2008; 14(6):445-52. Does not have a drug comparison of interest
Gill GV, Huddle KR. Hypoglycaemic admissions among diabetic patients in Soweto, South
Africa. Diabet Med 1993; 10(2):181-3. Does not have a drug comparison of interest
Glass LC, Qu Y, Lenox S et al. Effects of exenatide versus insulin analogues on weight change
in subjects with type 2 diabetes: a pooled post-hoc analysis. Curr Med Res Opin 2008;
24(3):639-44. Does not have a drug comparison of interest
Glass LC, Triplitt C, Lewis MS et al. Effects of exenatide plus rosiglitazone on measures of beta
cell function and insulin sensitivity in subjects with type 2 diabetes previously treated with
metformin. Diabetologia: Diabetologia 2009; 52(S1):S286. Other reason
GlaxoSmithKline: Study no 049653/211: a 52-week double blind study of the effect of
rosiglitazone on cardiovascular structure and function in subjects with type 2 diabetes and
congestive heart failure [article online]. Does not have a drug comparison of interest
Glimepiride--well tolerated in daily practice. Cardiovasc J S Afr 2002; 13(4):214-5. No original
data
Glitazones linked to heart failure. Pharm. J. 2003; 271(7266):312. No original data
Glyburide/metformin (Glucovance) for type 2 diabetes. Med Lett Drugs Ther 2000;
42(1092):105-6. No original data
F-21](https://image.slidesharecdn.com/afdmantidiabeticos27-151124223447-lva1-app6892/85/Af-dm-antidiabeticos-27-270-320.jpg)
![Go EH, Kyriakidou-Himonas M, Berelowitz M. Effects of glipizide GITS and glibenclamide on
metabolic control, hepatic glucose production, and insulin secretion in patients with type 2
diabetes. Diabetes Metab Res Rev 2004; 20(3):225-31. Does not have a drug comparison of
interest
Goke B. Improved glycemic control and lipid profile in a randomized study of pioglitazone
compared with acarbose in patients with type 2 diabetes mellitus. Treat Endocrinol 2002;
1(5):329-36. Does not have a drug comparison of interest
Goldberg RB, Einhorn D, Lucas CP et al. A randomized placebo-controlled trial of repaglinide
in the treatment of type 2 diabetes. Diabetes Care 1998; 21(11):1897-903. Does not have a drug
comparison of interest
Goldberg RB, Holvey SM, Schneider J. A dose-response study of glimepiride in patients with
NIDDM who have previously received sulfonylurea agents. The Glimepiride Protocol #201
Study Group. Diabetes Care 1996; 19(8):849-56. Does not have a drug comparison of interest
Goldstein BJ, Weissman PN, Wooddell MJ, Waterhouse BR, Cobitz AR. Reductions in
biomarkers of cardiovascular risk in type 2 diabetes with rosiglitazone added to metformin
compared with dose escalation of metformin: an EMPIRE trial sub-study. Curr Med Res Opin
2006; 22(9):1715-23. Does not apply
Gonzalez-Ortiz M et al. [Efficacy and safety of glimepiride plus metformin in a single
presentation, as combined therapy, in patients with type 2 diabetes mellitus and secondary failure
to glibenclamide, as monotherapy]. Revista De Investigaci≤n Clφnica; Organo Del Hospital De
Enfermedades De La Nutrici≤n 2004; 56(3):327-33. Not written in English
Gore MO, McGuire DK. The 10-year post-trial follow-up of the United Kingdom Prospective
Diabetes Study (UKPDS): Cardiovascular observations in context. Diabets Vasc Dis Res 2009;
6(1):53-5. No original data
Gosmanova EO, Canada RB, Mangold TA, Rawls WN, Wall BM. Effect of metformin-
containing antidiabetic regimens on all-cause mortality in veterans with type 2 diabetes mellitus.
Am J Med Sci 2008; 336(3):241-7. Does not have a drug comparison of interest
Gottschalk M, Danne T, Vlajnic A, Cara JF. Glimepiride versus metformin as monotherapy in
pediatric patients with type 2 diabetes: a randomized, single-blind comparative study. Diabetes
Care 2007; 30(4):790-4. No subjects >18 years old
Goudswaard AN, Stolk RP, Zuithoff P, de Valk HW, Rutten GE. Starting insulin in type 2
diabetes: continue oral hypoglycemic agents? A randomized trial in primary care. J Fam Pract
2004; 53(5):393-9. Does not have a drug comparison of interest
Gough S, Zinman B, Falahati A, Toft A. The proportion of patients reaching the composite
outcome of HbA1c <7.0%, no hypoglycaemia and no weight gain with different Type 2 diabetes
therapies in the Liraglutide Effect and Action in Diabetes (LEAD) programme. Diabetic
Medicine: Diabet. Med. 2010; 27(Suppl 1):77. No original data
Govindarajan R, Ratnasinghe L, Simmons DL et al. Thiazolidinediones and the risk of lung,
prostate, and colon cancer in patients with diabetes. J Clin Oncol 2007; 25(12):1476-81. Does
not apply
F-22](https://image.slidesharecdn.com/afdmantidiabeticos27-151124223447-lva1-app6892/85/Af-dm-antidiabeticos-27-271-320.jpg)
![Goyal A, Crook ED. Thiazolidinediones and progression of renal disease in patients with
diabetes. J Investig Med 2006; 54(2):56-61. Does not have a drug comparison of interest
Grant PJ. The effects of high- and medium-dose metformin therapy on cardiovascular risk
factors in patients with type II diabetes. Diabetes Care 1996; 19(1):64-6. Does not have a drug
comparison of interest
Grant PJ. The effects of metformin on cardiovascular risk factors. Diabetes Metab Rev 1995; 11
Suppl 1:S43-50. No original data
Greco D, Angileri G. Drug-induced severe hypoglycaemia in Type 2 diabetic patients aged 80
years or older. Diabetes Nutr Metab 2004; 17(1):23-6. Does not meet the study design criteria
Gregorio F et al. [Body mass index, blood lactate and therapeutic effectiveness of metformin in
type II diabetes mellitus]. Medicina (Florence, Italy) 1989; 9(2):200-4. Not written in English
Gregorio F et al. Metformin-sulphonylurea combination therapy: the influence of regional
adiposity on biguanide-induced haemostatic improvement. Balance in type II diabetic patients.
Annals of Experimental and Clinical Medicine 1994; 2:136-45. Other reason
Gregorio F, Ambrosi F, Filipponi P, Manfrini S, Testa I. Is metformin safe enough for ageing
type 2 diabetic patients? Diabetes Metab 1996; 22(1):43-50. No comparison group
Gregorio F, Ambrosi F, Manfrini S et al. Poorly controlled elderly Type 2 diabetic patients: the
effects of increasing sulphonylurea dosages or adding metformin. Diabet Med 1999;
16(12):1016-24. Does not have a drug comparison of interest
Gregorio F, Manfrini S, Testa I, Filipponi P. Metformin treatment in elderly type II diabetic
patients. Arch Gerontol Geriatr 1996; 22 Suppl 1:261-70. Does not have a drug comparison of
interest
Groop L, Widen E, Franssila-Kallunki A, Ekstrand A. Sulfonylureas and/or insulin in Type 2
diabetes. Less than 40 subjects with type 2 diabetes
Groop PH, Groop L, Totterman KJ, Pelkonen R. Metabolic effects of glibenclamide and
glipizide in patients with type 2 diabetes. ACTA ENDOCRINOL. SUPPL. 1982; 100(Suppl.
247):25. No subjects >18 years old
Grossman E. Rosiglitazone reduces blood pressure and urinary albumin excretion in type 2
diabetes: G Bakris et al. J. Hum. Hypertens. 2003; 17(1):5-6. No original data
Grossman LD, Parlan G, Bailey AL, Yee G, Yu M, Chan JY. Tolerability outcomes of a
multicenter, observational, open-label, drug-surveillance study in patients with type 2 diabetes
mellitus treated with pioglitazone for 2 years. Clin Ther 2009; 31(1):74-88. Does not have a drug
comparison of interest
Guillausseau PJ. PROactive study. Lancet 2006; 367(9504):23; author reply 26-27. No original
data
Guler S, Cakir B, Demirbas B, Gursoy G, Serter R, Aral Y. Leptin concentrations are related to
glycaemic control, but do not change with short-term oral antidiabetic therapy in female patients
with type 2 diabetes mellitus. Diabetes Obes Metab 2000; 2(5):313-6. Study duration less than 3
months
F-23](https://image.slidesharecdn.com/afdmantidiabeticos27-151124223447-lva1-app6892/85/Af-dm-antidiabeticos-27-272-320.jpg)
![Guler S, Sharma SK, Almustafa M et al. Improved Glycaemic Control with Biphasic Insulin
Aspart 30 in Type 2 Diabetes Patients Failing Oral Antidiabetic Drugs: PRESENT Study
Results. Arch Drug Inf 2009; 2(2):23-33. Does not have a drug comparison of interest
Gupta AK, Bray GA, Greenway FL, Martin CK, Johnson WD, Smith SR. Pioglitazone, but not
metformin, reduces liver fat in Type-2 diabetes mellitus independent of weight changes. J
Diabetes Complications 2009. Other reason
Gupta M, Braga MB, Verma S. A randomized, controlled trial of the effects of rosiglitazone on
adipokines, and inflammatory and fibrinolytic markers in diabetic patients: study design and
protocol. Can J Cardiol 2008; 24(10):e65-9. Other reason
Habib SS, Aslam M, Naveed AK, Razi MS. Comparison of lipid profiles and lipoprotein a levels
in patients with type 2 diabetes mellitus during oral hypoglycemic or insulin therapy. Saudi Med
J 2006; 27(2):174-80. Does not meet the study design criteria
Habib ZA, Tzogias L, Havstad SL et al. Relationship between thiazolidinedione use and
cardiovascular outcomes and all-cause mortality among patients with diabetes: a time-updated
propensity analysis. Pharmacoepidemiol Drug Saf 2009; 18(6):437-47. Does not have a drug
comparison of interest
Haffner SM, Greenberg AS, Weston WM, Chen H, Williams K, Freed MI. Effect of
rosiglitazone treatment on nontraditional markers of cardiovascular disease in patients with type
2 diabetes mellitus. Circulation 2002; 106(6):679-84. Does not have a drug comparison of
interest
Hammer H, Klinge A. Patients with type 2 diabetes inadequately controlled on premixed insulin:
Effect of initiating insulin glargine plus oral antidiabetic agents on glycaemic control in daily
practice. Int. J. Clin. Pract. 2007; 61(12):2009-18. No comparison group
Hanefeld M et al. Risk factors for myocardial infarction and death in newly detected NIDDM:
the Diabetes Intervention Study, 11-year follow-up. Diabetologia 1996; 39(12):1577-83. Does
not have a drug comparison of interest
Hanefeld M, Bouter KP, Dickinson S, Guitard C. Rapid and short-acting mealtime insulin
secretion with nateglinide controls both prandial and mean glycemia. Diabetes Care 2000;
23(2):202-7. Does not have a drug comparison of interest
Hanefeld M, Goke B. Combining pioglitazone with a sulphonylurea or mefformin in the
management of type 2 diabetes. Exp Clin Endocrinol Diabetes 2000; 108(Suppl 2):256-66. No
original data
Hanefeld M, Herman G, Mickel C. Effect of MK-0431, a dipeptidyl peptidase IV (DPP-4)
inhibitor, on glycemic control after 12 weeks in patients with type 2 diabetes. Diabetologia 2005;
48(Suppl 1):287-8. Other reason
Hanefeld M, Temelkova-Kurktschiev T, Kohler C. Effect of oral antidiabetics and insulin on
lipids and coronary heart disease in non-insulin-dependent diabetes mellitus. ANN. NEW YORK
ACAD. SCI. 1997; 827(-):246-68. No original data
Hao Y et al. [Effects of pioglitazone on elderly patients with type 2 diabetes mellitus]. Medical
Journal of Wuhan University 2006; 27(1):104-7. Not written in English
F-24](https://image.slidesharecdn.com/afdmantidiabeticos27-151124223447-lva1-app6892/85/Af-dm-antidiabeticos-27-273-320.jpg)
![Hotta N et al. Diabetic neuropathy: effects of intensified glycaemic control with multiple insulin
injections. Diabetic Medicine: a Journal of the British Diabetic Association 1993; 10 Suppl
2:91S-4S. Other reason
Houlden R, Ross S, Harris S, Yale J-F, Sauriol L, Gerstein HC. Treatment satisfaction and
quality of life using an early insulinization strategy with insulin glargine compared to an adjusted
oral therapy in the management of Type 2 diabetes: The Canadian INSIGHT Study. Diabetes
Res Clin Pract. 2007; 78(2):254-8. Does not apply
Howes LG. Cardiovascular effects of sulphonylureas: role of K(ATP) channels. Diabetes Obes
Metab 2000; 2(2):67-73. No original data
Hristov V, Sheinkova G, Simeonov S, Botushanov N, Valkov Y, Tzinlikov I. Clinical
assessment of glimepiride (Amaril(registered trademark)) in the treatment of type 2 diabetes
mellitus patients (results of a multicenter study). Endocrinologia (Bulgaria) 2002; 7(1):30-5. Not
written in English
Hsiao FY, Mullins CD. The association between thiazolidinediones and hospitalisation for
fracture in type 2 diabetic patients: a Taiwanese population-based nested case-control study.
Diabetologia 2009. Does not have a drug comparison of interest
Huang Z et al. Effects of rosiglitazone on the IMTc and serum MMP-9 levels in newly diagnosed
Type 2 diabetic patients. Zhong Nan Da Xue Xue Bao Yi Xue Ban (Journal of Central South
University Medical Sciences) 2006; 31(3):367-72. Not written in English
Hulisz DT, Bonfiglio MF, Murray RD. Metformin-associated lactic acidosis. J Am Board Fam
Pract 1998; 11(3):233-6. No comparison group
Iavicoli M, Cucinotta D, De Mattia G et al. Blood glucose control and insulin secretion improved
with combined therapy in type 2 diabetic patients with secondary failure to oral hypoglycaemic
agents. Diabetic Med 1988; 5(9):849-55. Does not have a drug comparison of interest
Inukai K, Watanabe M, Nakashima Y et al. Efficacy of glimepiride in Japanese type 2 diabetic
subjects. Diabetes Res Clin Pract 2005; 68(3):250-7. Does not have a drug comparison of interest
Inzucchi S, Leiter LA, Rosenstock J. Type 2 diabetes and TZDs (thiazolidinediones): Diabetes
de tipo 2 y las TZD (tiazolidinedionas). J. Clin. Endocrinol. Metab. 2009; 94(11). No original
data
Inzucchi SE, Masoudi FA, Wang Y et al. Insulin-sensitizing antihyperglycemic drugs and
mortality after acute myocardial infarction: Insights from the national heart care project.
Diabetes Care 2005; 28(7):1680-9. Does not have a drug comparison of interest
Iozzo P, Hallsten K, Oikonen V et al. Effects of metformin and rosiglitazone monotherapy on
insulin-mediated hepatic glucose uptake and their relation to visceral fat in type 2 diabetes.
Diabetes Care 2003; 26(7):2069-74. Less than 40 subjects with type 2 diabetes
Isley WL, Oki JC. Hepatotoxicity of thiazolidinediones. Diab. Obesity Metabol 2001; 3(6):389-
92. No original data
Ito H. [Japanese Elderly Diabetes Intervention Trial (J-EDIT)]. Nippon Rinsho 2006; 64(1):21-6.
Not written in English
F-28](https://image.slidesharecdn.com/afdmantidiabeticos27-151124223447-lva1-app6892/85/Af-dm-antidiabeticos-27-277-320.jpg)
![Karter AJ, Moffet HH, Liu J et al. Achieving good glycemic control: initiation of new
antihyperglycemic therapies in patients with type 2 diabetes from the Kaiser Permanente
Northern California Diabetes Registry. Am J Manag Care 2005; 11(4):262-70. Does not meet the
study design criteria
Karter AJ, Moffet HH, Liu J et al. Glycemic response to newly initiated diabetes therapies. Am J
Manag Care 2007; 13(11):598-606. Does not meet the study design criteria
Kasliwal R, Wilton LV, Shakir SA. Monitoring the safety of pioglitazone : results of a
prescription-event monitoring study of 12,772 patients in England. Drug Saf 2008; 31(10):839-
50. Does not apply
Kaur RH et al. Management of type 2 diabetes mellitus : Gliclazide v/s glimepride [abstract
no:16]. J Assoc Physicians India 2002; 50. Other reason
Kaushal S, Chopra SC, Arora S. Exenatide: An incretin-mimetic agent. Indian J Pharmacol.
2006; 38(1):76-8. No original data
Kawamori R et al. Determination of the glycemic threshold for the regression or prevention of
diabetic microangiopathies, and the insulin injection regimen to establish strict glycemic control
in NIDDM. Jpn J Med 1991; 30(6):618-21. Does not have a drug comparison of interest
Kawamori R, Kadowaki T, Onji M, Seino Y, Akanuma Y. Hepatic safety profile and glycemic
control of pioglitazone in more than 20,000 patients with type 2 diabetes mellitus: postmarketing
surveillance study in Japan. Diabetes Res Clin Pract 2007; 76(2):229-35. Does not meet the
study design criteria
Kennedy L, Herman WH. Renal status among patients using metformin in a primary care setting.
Diabetes Care 2005; 28(4):922-4. No comparison group
Kerenyi Z, Samer H, James R, Yan Y, Stewart M. Combination therapy with rosiglitazone and
glibenclamide compared with upward titration of glibenclamide alone in patients with type 2
diabetes mellitus. Diabetes Res Clin Pract 2004; 63(3):213-23. Does not have a drug comparison
of interest
Khandekar S, Sethi BK, Dash RJ. Effect of sulphonylurea therapy on insulin sensitivity in non
insulin dependent diabetics. J Assoc Physicians India 1990; 38(7):469-71. Study duration less
than 3 months
Kiayias JA, Vlachou ED, Theodosopoulou E, Lakka-Papadodima E. Rosiglitazone in
combination with glimepiride plus metformin in type 2 diabetic patients. Diabetes Care 2002;
25(7):1251-2. Less than 40 subjects with type 2 diabetes
Kilo C, Williamson JR. The controversial American University Group Diabetes Study--a look at
sulfonylurea and biguanide therapy. Horm Metab Res Suppl 1985; 15:102-4. No original data
Kilo C. Multicenter comparison of glyburide and glipizide in the treatment of non-insulin-
dependent diabetes mellitus. Clin Ther 1988; 10(3):294-302. Does not have a drug comparison
of interest
Kim YM, Cha BS, Kim DJ et al. Predictive clinical parameters for therapeutic efficacy of
rosiglitazone in Korean type 2 diabetes mellitus. Diabetes Res Clin Pract 2005; 67(1):43-52.
Does not have a drug comparison of interest
F-31](https://image.slidesharecdn.com/afdmantidiabeticos27-151124223447-lva1-app6892/85/Af-dm-antidiabeticos-27-280-320.jpg)
![Libby G, Donnelly LA, Donnan PT, Alessi DR, Morris AD, Evans JM. New users of metformin
are at low risk of incident cancer: a cohort study among people with type 2 diabetes. Diabetes
Care 2009; 32(9):1620-5. Does not have a drug comparison of interest
Lin KD, Chang YH, Wang CL et al. Thiazolidinedione addition reduces the serum retinol-
binding protein 4 in type 2 diabetic patients treated with metformin and sulfonylurea. Transl Res
2008; 151(6):309-14. No comparison group
Lindner J et al. [Presentation of an insulin-treated patient group within the scope of a 5-year
study of the Diabetes Intervention Study (DIS)]. Zeitschrift Fⁿr Die Gesamte Innere Medizin Und
Ihre Grenzgebiete 1987; 42(7):198-200. Not written in English
Lipid effects of pioglitazone studied. Br. J. Diabetes Vasc. Dis. 2004; 4(3):209. No original data
Lipscombe LL, Gomes T, Levesque LE, Hux JE, Juurlink DN, Alter DA. Thiazolidinediones and
cardiovascular outcomes in older patients with diabetes. JAMA 2007; 298(22):2634-43. Does
not have a drug comparison of interest
Loebstein R, Vasterman-Landes J, Silverman B et al. Database evaluation of adverse
cardiovascular outcomes, related to rosiglitazone (RSG), in the treatment of type 2 diabetes
mellitus (T2DM) patients in the community. Clinical Pharmacology and Therapeutics: Clin
Pharmacol Ther 2009; 85:S7. No original data
Lomuscio A, Fiorentini C. Influence of oral antidiabetic treatment on electrocardiac alterations
induced by myocardial infarction. Diabetes Res Clin Pract 1996; 31 Suppl:S21-6. Does not have
a drug comparison of interest
Lopez-GarciA F, Borras J, Verdu C et al. Cholestatic hepatitis associated with repaglinide.
Diabetes Care 2005; 28(3):752-3. No comparison group
Lowry, F. S., Bevivino, M. V., Salzman, A., Yan, Y., Patwardhan, R. Rosiglitazone: BRL 49653:
a 26- week randomized, double-blind, double dummy, multicenter study to evaluate the efficacy,
safety and tolerability of rosiglitazone 4 mg bd when administered to patients with non-insulin
dependent diabetes mellitus (NIDDM) who are inadequately controlled on a maintenance dose
(2.5g/day) of metformin: report 093 phase IIIA: final clinical report. The Clinical Effectiveness
and Cost-Effectiveness of Rosiglitazone for Type 2 Diabetes Mellitus. National Institute for
Clinical Excellence. London, England. August 2000. Other reason
Luis Bautista J, Bugos C, Dirnberger G, Atherton T. Efficacy and safety profile of glimepiride in
Mexican American Patients with type 2 diabetes mellitus: a randomized, placebo-controlled
study. Clin Ther 2003; 25(1):194-209. Does not have a drug comparison of interest
Lund SS, Tarnow L, Frandsen M et al. Erratum: Impact of metformin versus the prandial insulin
secretagogue, repaglinide, on fasting and postprandial glucose and lipid responses in non-obese
patients with type 2 diabetes (European Journal of Endocrinology vol. 158 (1) (35-46)). Eur. J.
Endocrinol. 2008; 158(3):443-5. No original data
Lund SS, Tarnow L, Stehouwer CD et al. Impact of metformin versus repaglinide on non-
glycaemic cardiovascular risk markers related to inflammation and endothelial dysfunction in
non-obese patients with type 2 diabetes. Eur J Endocrinol 2008; 158(5):631-41. Does not apply
Lundquist I, Ahren B, Schersten B. Insulin secretagogues. Possible modulators of glucose and
non-glucose stimuli. Acta Endocrinol Suppl 1984; 105(262):51-9. No original data
F-35](https://image.slidesharecdn.com/afdmantidiabeticos27-151124223447-lva1-app6892/85/Af-dm-antidiabeticos-27-284-320.jpg)
![Peters Harmel AL, Kendall DM, Buse JB, Boyle PJ, Marchetti A, Lau H. Impact of adjunctive
thiazolidinedione therapy on blood lipid levels and glycemic control in patients with type 2
diabetes. Curr Med Res Opin 2004; 20(2):215-23. Other reason
Petersen KU. Complementary mode of action of rosiglitazone and metformin in a single tablet
for the treatment of diabetes mellitus type 2. Arzneimittelforschung 2004; 54(1):20-30. No
original data
Petzholdt R, Rosak C, Stammer H. Rosiglitazone plus metformin is effective and safe in daily
practise [Abstract]. Diabetes 2004; 53(9 Suppl 2):A 142. Other reason
Pfutzner A, Lubben G, Forst T. Pioglitazone decreases carotid intima-media thickness in
diabetes mellitus. Cardiol Rev 2005; 22(10):30-3. Other reason
Pfutzner A, Schondorf T, Seidel D et al. Impact of rosiglitazone on beta-cell function, insulin
resistance, and adiponectin concentrations: results from a double-blind oral combination study
with glimepiride. Metabolism 2006; 55(1):20-5. Does not have a drug comparison of interest
Philis-Tsimikas A, Charpentier G, Clauson P, Ravn GM, Roberts VL, Thorsteinsson B.
Comparison of once-daily insulin detemir with NPH insulin added to a regimen of oral
antidiabetic drugs in poorly Controlled Type 2 Diabetes. Clin Ther 2006; 28(10):1569-81. Does
not have a drug comparison of interest
Phillips LS, Grunberger G, Miller E, Patwardhan R, Rappaport EB, Salzman A. Once- and
twice-daily dosing with rosiglitazone improves glycemic control in patients with type 2 diabetes.
Diabetes Care 2001; 24(2):308-15. Does not have a drug comparison of interest
Pioglitazone ineffective in secondary prevention of macrovascular complications (PROactive). J.
Natl. Med. Assoc. 2006; 98(1):102-3. No original data
Pioglitazone of benefit in high-risk diabetes patients. Pharm J 2005; 275(7367):330. No original
data
Pioglitazone reduces stroke, MI, and death but increases HF. Geriatr Aging 2006; 9(1):48. No
original data
Pioglitazone shows anti-atherosclerotic effect in type 2 diabetes. Geriatrics 2007; 62(2):14. No
original data
Pioglitazone/glimepiride (Duetact) for diabetes. Med Lett Drugs Ther 2007; 49(1253):9-11. No
original data
Pioglitazone: Fractures in women. WHO Drug Inf 2007; 21(3):207. No original data
Pisu E, Marena S, Arcari R et al. Depressed insulin secretion in response to different stimuli is a
feature of secondary failure in normal-weight non-insulin dependent diabetics on sulphonylureas.
Diabetes Nutr Metab Clin Exp 1996; 9(1):22-8. Less than 40 subjects with type 2 diabetes
Pogatsa G, Koltai MZ, Jermendy G, Simon J, Aranyi Z, Ballagi-Pordany G. The effect of
sulphonylurea therapy on the outcome of coronary heart diseases in diabetic patients. Acta Med
Hung 1992-1993; 49(1-2):39-51. Does not have a drug comparison of interest
Polonsky WH et al. Integrating medical management with diabetes self-management training: a
randomized control trial of the Diabetes Outpatient Intensive Treatment program. Diabetes Care
2003; 26(11):3048-53. Does not apply
F-44](https://image.slidesharecdn.com/afdmantidiabeticos27-151124223447-lva1-app6892/85/Af-dm-antidiabeticos-27-293-320.jpg)
![Ponchner M, Taylor R, Heine R, Alberti KG. The effect of sulphonylurea therapy on in vivo
insulin sensitivity in non-insulin dependent diabetics. Horm Metab Res 1984; 16(4):208. Less
than 40 subjects with type 2 diabetes
Pongchaidecha M, Srikusalanukul V, Chattananon A, Tanjariyaporn S. Effect of metformin on
plasma homocysteine, vitamin B12 and folic acid: a cross-sectional study in patients with type 2
diabetes mellitus. J Med Assoc Thai 2004; 87(7):780-7. Does not apply
Pradhan AD, Everett BM, Cook NR, Rifai N, Ridker PM. Effects of initiating insulin and
metformin on glycemic control and inflammatory biomarkers among patients with type 2
diabetes: the LANCET randomized trial. JAMA 2009; 302(11):1186-94. Does not have a drug
comparison of interest
Prager R, Schernthaner G, Matha R. Metformin does not alter insulin receptor binding in non
insulin dependent diabetes mellitus. ACTA Endocrinol Suppl 1983; 102(253):76-7. Less than 40
subjects with type 2 diabetes
Prando R, Buzzo P, Cheli V, Melga PL, Accoto S, Rebaudo S. A short period of insulin therapy
can restore the sensitivity to hypoglycaemic agents in poorly controlled type 2 diabetes. Med Sci
Res 1988; 16(23):1245. No original data
Qu S et al. [The efficacy of glipizide XL in the treatment of type 2 diabetic patients
unresponding to sulfaurea drugs]. Pharmaceutical Care & Research (Yaoxue Fuwu Yu Yanjiu)
2005; 5(1):32-4. Not written in English
Rachmani R, Slavachevski I, Levi Z, Zadok B, Kedar Y, Ravid M. Metformin in patients with
type 2 diabetes mellitus: reconsideration of traditional contraindications. Eur J Intern Med 2002;
13(7):428. Does not apply
Rajagopalan R, Perez A, Ye Z, Khan M, Murray FT. Pioglitazone is effective therapy for elderly
patients with type 2 diabetes mellitus. Drugs Aging 2004; 21(4):259-71. Does not have a drug
comparison of interest
Rajagopalan R, Xu Y, Abbadessa M. The effect of pioglitazone on glycemic and lipid
parameters and adverse events in elderly patients with type 2 diabetes mellitus: a post hoc
analysis of four randomized trials. Am J Geriatr Pharmacother 2006; 4(2):123-33. No original
data
Rajeswaran C, Scott EM. Thiazolidinedione induced gross scrotal oedema? Pract. Diabetes Int.
2006; 23(7):286. No comparison group
Ramachandran A, Mohan V, Snehalatha MC, Chinnikrishnudu M, Viswanathan M. Use of
metformin in selected cases of NIDDM. A clinical trial. J Diabetic Assoc India 1988; 28(4):137-
9. No comparison group
Ramos-Nino ME, MacLean CD, Littenberg B. Association between cancer prevalence and use of
thiazolidinediones: results from the Vermont Diabetes Information System. BMC Med 2007;
5:17. Does not apply
Raptis AE, Tountas N, Yalouris AG et al. Comparative study of the therapeutic effects of
glibenclamide or the fixed combination of glibenclamide-phenformin with those of gliclazide or
chlorpropamide. Acta Diabetol Lat 1990; 27(1):11-22. Does not have a drug comparison of
interest
F-45](https://image.slidesharecdn.com/afdmantidiabeticos27-151124223447-lva1-app6892/85/Af-dm-antidiabeticos-27-294-320.jpg)