- The document provides financial results and highlights for Q4 2012 and full year 2012 for Alamos Gold Inc.
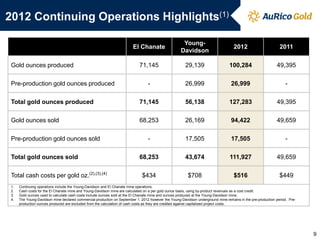
- For Q4 2012, production was 41,145 ounces at a total cash cost of $628 per ounce, with adjusted net earnings of $13.7 million.
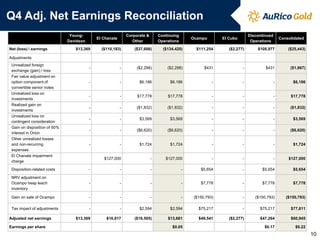
- For full year 2012, production was 127,283 ounces at a total cash cost of $516 per ounce, with adjusted net earnings of $34.7 million.
- Production at the Young-Davidson mine is ramping up as planned and the shaft system is on track to be commissioned in Q3.