AdventureWorks_Reports.pdf
•
0 likes•9 views
Leverage advanced data transformation techniques to craft professional-grade reports and dashboards within the Power BI platform. This project focuses on tracking key performance indicators (KPIs), comparing regional performance metrics, analyzing trends at the product level, and identifying high-value customers. The objective is to provide a comprehensive visual representation of data, facilitating informed decision-making and strategic insights for enhanced business performance.
Report
Share
Report
Share
Download to read offline

Recommended
Recommended
More Related Content
Similar to AdventureWorks_Reports.pdf
Similar to AdventureWorks_Reports.pdf (20)
Page 1 Front PagePage 2 Stocks & BondsPage 3 Financial Sum.docx
Page 1 Front PagePage 2 Stocks & BondsPage 3 Financial Sum.docx
Page 1 Front Page Page 2 Stocks & Bonds Page 3 Financial.docx
Page 1 Front Page Page 2 Stocks & Bonds Page 3 Financial.docx
Round 5Dec. 31, 2018 C58538AndrewsEugene EllisPhili.docx
Round 5Dec. 31, 2018 C58538AndrewsEugene EllisPhili.docx
How to Stand Out from the Pack with Credible Workforce Data - Part 1
How to Stand Out from the Pack with Credible Workforce Data - Part 1
2222020 Report Pagehttpsww3.capsim.comcgi-bindispla.docx
2222020 Report Pagehttpsww3.capsim.comcgi-bindispla.docx
More from Atishay Chaudhary
More from Atishay Chaudhary (8)
Recently uploaded
Saudi Arabia [ Abortion pills) Jeddah/riaydh/dammam/+966572737505☎️] cytotec tablets uses abortion pills 💊💊
How effective is the abortion pill? 💊💊 +966572737505) "Abortion pills in Jeddah" how to get cytotec tablets in Riyadh " Abortion pills in dammam*💊💊
The abortion pill is very effective. If you’re taking mifepristone and misoprostol, it depends on how far along the pregnancy is, and how many doses of medicine you take:💊💊 +966572737505) how to buy cytotec pills
At 8 weeks pregnant or less, it works about 94-98% of the time. +966572737505[ 💊💊💊
At 8-9 weeks pregnant, it works about 94-96% of the time. +966572737505)
At 9-10 weeks pregnant, it works about 91-93% of the time. +966572737505)💊💊
If you take an extra dose of misoprostol, it works about 99% of the time.
At 10-11 weeks pregnant, it works about 87% of the time. +966572737505)
If you take an extra dose of misoprostol, it works about 98% of the time.
In general, taking both mifepristone and+966572737505 misoprostol works a bit better than taking misoprostol only.
+966572737505
Taking misoprostol alone works to end the+966572737505 pregnancy about 85-95% of the time — depending on how far along the+966572737505 pregnancy is and how you take the medicine.
+966572737505
The abortion pill usually works, but if it doesn’t, you can take more medicine or have an in-clinic abortion.
+966572737505
When can I take the abortion pill?+966572737505
In general, you can have a medication abortion up to 77 days (11 weeks)+966572737505 after the first day of your last period. If it’s been 78 days or more since the first day of your last+966572737505 period, you can have an in-clinic abortion to end your pregnancy.+966572737505
Why do people choose the abortion pill?
Which kind of abortion you choose all depends on your personal+966572737505 preference and situation. With+966572737505 medication+966572737505 abortion, some people like that you don’t need to have a procedure in a doctor’s office. You can have your medication abortion on your own+966572737505 schedule, at home or in another comfortable place that you choose.+966572737505 You get to decide who you want to be with during your abortion, or you can go it alone. Because+966572737505 medication abortion is similar to a miscarriage, many people feel like it’s more “natural” and less invasive. And some+966572737505 people may not have an in-clinic abortion provider close by, so abortion pills are more available to+966572737505 them.
+966572737505
Your doctor, nurse, or health center staff can help you decide which kind of abortion is best for you.
+966572737505
More questions from patients:
Saudi Arabia+966572737505
CYTOTEC Misoprostol Tablets. Misoprostol is a medication that can prevent stomach ulcers if you also take NSAID medications. It reduces the amount of acid in your stomach, which protects your stomach lining. The brand name of this medication is Cytotec®.+966573737505)
Unwanted Kit is a combination of two mediciAbortion pills in Doha Qatar (+966572737505 ! Get Cytotec
Abortion pills in Doha Qatar (+966572737505 ! Get CytotecAbortion pills in Riyadh +966572737505 get cytotec
(NEHA) Call Girls Katra Call Now: 8617697112 Katra Escorts Booking Contact Details WhatsApp Chat: +91-8617697112 Katra Escort Service includes providing maximum physical satisfaction to their clients as well as engaging conversation that keeps your time enjoyable and entertaining. Plus, they look fabulously elegant, making an impression. Independent Escorts Katra understands the value of confidentiality and discretion; they will go the extra mile to meet your needs. Simply contact them via text messaging or through their online profiles; they'd be more than delighted to accommodate any request or arrange a romantic date or fun-filled night together. We provide: (NEHA) Call Girls Katra Call Now 8617697112 Katra Escorts 24x7
(NEHA) Call Girls Katra Call Now 8617697112 Katra Escorts 24x7Call Girls in Nagpur High Profile Call Girls
Recently uploaded (20)
Jual Obat Aborsi Surabaya ( Asli No.1 ) 085657271886 Obat Penggugur Kandungan...
Jual Obat Aborsi Surabaya ( Asli No.1 ) 085657271886 Obat Penggugur Kandungan...
Call Girls Hsr Layout Just Call 👗 7737669865 👗 Top Class Call Girl Service Ba...
Call Girls Hsr Layout Just Call 👗 7737669865 👗 Top Class Call Girl Service Ba...
Call Girls Indiranagar Just Call 👗 9155563397 👗 Top Class Call Girl Service B...
Call Girls Indiranagar Just Call 👗 9155563397 👗 Top Class Call Girl Service B...
Generative AI on Enterprise Cloud with NiFi and Milvus
Generative AI on Enterprise Cloud with NiFi and Milvus
Vip Mumbai Call Girls Marol Naka Call On 9920725232 With Body to body massage...
Vip Mumbai Call Girls Marol Naka Call On 9920725232 With Body to body massage...
5CL-ADBA,5cladba, Chinese supplier, safety is guaranteed
5CL-ADBA,5cladba, Chinese supplier, safety is guaranteed
Abortion pills in Doha Qatar (+966572737505 ! Get Cytotec
Abortion pills in Doha Qatar (+966572737505 ! Get Cytotec
Thane Call Girls 7091864438 Call Girls in Thane Escort service book now -
Thane Call Girls 7091864438 Call Girls in Thane Escort service book now -
Call Girls In Hsr Layout ☎ 7737669865 🥵 Book Your One night Stand
Call Girls In Hsr Layout ☎ 7737669865 🥵 Book Your One night Stand
Call Girls in Sarai Kale Khan Delhi 💯 Call Us 🔝9205541914 🔝( Delhi) Escorts S...
Call Girls in Sarai Kale Khan Delhi 💯 Call Us 🔝9205541914 🔝( Delhi) Escorts S...
Call Girls Bommasandra Just Call 👗 7737669865 👗 Top Class Call Girl Service B...
Call Girls Bommasandra Just Call 👗 7737669865 👗 Top Class Call Girl Service B...
Escorts Service Kumaraswamy Layout ☎ 7737669865☎ Book Your One night Stand (B...
Escorts Service Kumaraswamy Layout ☎ 7737669865☎ Book Your One night Stand (B...
(NEHA) Call Girls Katra Call Now 8617697112 Katra Escorts 24x7
(NEHA) Call Girls Katra Call Now 8617697112 Katra Escorts 24x7
Junnasandra Call Girls: 🍓 7737669865 🍓 High Profile Model Escorts | Bangalore...
Junnasandra Call Girls: 🍓 7737669865 🍓 High Profile Model Escorts | Bangalore...
AdventureWorks_Reports.pdf
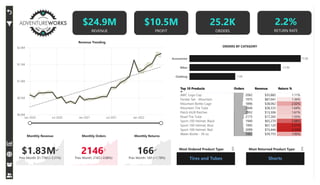
- 1. Power BI Desktop $24.9M REVENUE 2.2% RETURN RATE 25.2K ORDERS $10.5M PROFIT Revenue Trending $0.0M $0.5M $1.0M $1.5M $2.0M Jan 2020 Jul 2020 Jan 2021 Jul 2021 Jan 2022 Monthly Revenue $1.83M Prev Month: $1.77M (+3.31%) Monthly Orders 2146 Prev Month: 2165 (-0.88%) Monthly Returns 166 Prev Month: 169 (+1.78%) ORDERS BY CATEGORY Accessories Bikes Clothing 17.0K 13.9K 7.0K Top 10 Products Orders Revenue Return % AWC Logo Cap 2062 $35,882 1.11% Fender Set - Mountain 1975 $87,041 1.36% Mountain Bottle Cage 1896 $38,062 2.02% Mountain Tire Tube 2846 $28,333 1.64% Patch Kit/8 Patches 2952 $13,506 1.61% Road Tire Tube 2173 $17,265 1.55% Sport-100 Helmet, Black 1940 $65,270 2.68% Sport-100 Helmet, Blue 1995 $67,120 3.31% Sport-100 Helmet, Red 2099 $73,444 3.33% Water Bottle - 30 oz. 3983 $39,755 1.95% Tires and Tubes Most Ordered Product Type: Shorts Most Returned Product Type:
- 2. Power BI Desktop United States Australia Canada United Kingdom France Germany Select all Europe North America Pacific
- 3. Power BI Desktop Monthly Profit vs, Target $0K ₹ 5,421 $4.73K Monthly Revenue vs, Target $0 ₹ 8.44K $7,368 Monthly Order vs, Target 0 251 219 $0K $1K $2K Jul 2021 Sep 2021 Nov 2021 Jan 2022 Mar 2022 May 2022 Total Profit Adjusted Profit $0 $500 $1,000 Jul 2021 Sep 2021 Nov 2021 Jan 2022 Mar 2022 May 2022 Sport-100 Helmet, Blue Selected Product: Price Adjustment % 0.20 Product Metric Selection Orders Revenue Profit Returns Return % REPORT SUMMARY Total Orders for Sport-100 Helmet, Blue were 228 Adjusted Profit (414.29% increase) and Total Profit (414.29% increase) both trended up between Sunday, June 27, 2021 and Sunday, June 26, 2022. Total Profit jumped from 194.55 to 540.41 during its steepest incline between Sunday, July 18, 2021 and Sunday August 8 2021
- 4. Power BI Desktop 17K UNIQUE CUSTOMERS $1.43K REVENUE PER CUSTOMER 0 200 400 600 Jan 2020 Jul 2020 Jan 2021 Jul 2021 Jan 2022 Orders by Income Level (47.0%) (41.6%) 3K (11.4%) 12K 10K Orders by Occupation (43.4%) 6K (32.6%) (24.0%) 8K 4K TOP 100 CUSTOMER Customer Key Name Orders Revenue 11433 Mr. Maurice Shan 6 $12,408 11439 Mrs. Janet Munoz 6 $12,015 11241 Mrs. Lisa Cai 7 $11,330 11417 Mrs. Lacey Zheng 7 $11,086 11420 Mr. Jordan Turner 7 $11,022 11242 Mr. Larry Munoz 7 $10,852 13263 Mrs. Kate Anand 4 $10,437 12655 Mr. Larry Vazquez 4 $10,395 11425 Mrs. Ariana Gray 6 $10,391 12631 Mr. Clarence Gao 4 $10,332 12650 Mr. Aaron Wright 4 $10,329 13405 Mr. Ethan Bryant 4 $10,309 11429 Mr. Marco Lopez 6 $10,290 12632 Mrs. Bonnie Nath 4 $10,283 11245 Mr. Ricky Vazquez 4 $10,166 Total 1272 $6,15,329 Mr. Maurice Shan Top Customer (by revenue) : 6 Orders : $12.41K Revenue : 2020 2022 Among Customers in skilled manual role in 2022, Ms. Ruben Suarez drove the most revenue Total Customers Revenue Per Customer
- 5. Power BI Desktop Help Q&A understand people better by adding synonyms. Add synonyms now Try one of these to get started top education levels by total customers top last names by quantity sold Show all suggestions Ask a question about your data CategoryName Total Orders Accessories 16983 Bikes 13929 Clothing 6976 Total 25164
- 6. Power BI Desktop Total Orders 25164 Accessories 16983 Bikes 13929 Clothing 6976 Tires and Tubes 9084 Helmets 6034 Bottles and Cages 4485 Fenders 1975 Cleaners 850 Hydration Packs 695 Bike Racks 302 Bike Stands 234 Bike Wash - Dissolver 850 CategoryName × Accessories SubcategoryName× Cleaners ProductName × 25K Total Orders DECOMPOSITION TREE