SlideShare a Scribd company logo
1 of 163
Round: 5
Dec. 31, 2018 C58538
Andrews
Eugene Ellis
Philip Mull
Baldwin
Lisa Chastain
Monica Dalke
matt rix
Chester
Digby Erie Ferris
Selected Financial Statistics
Andrews Baldwin Chester Digby Erie Ferris
ROS -19.6% -1.2% 6.8% 5.2% 10.2% 4.7%
Asset Turnover 0.75 1.21 1.11 1.03
0.97 1.18
ROA -14.7% -1.5% 7.5% 5.3% 9.9% 5.6%
Leverage
(Assets/Equity)
-2.4 2.1 2.1 2.1 1.9
2.0
ROE -35.0% -3.1% 15.5% 11.1% 19.0% 11.4%
Emergency Loan $105,583,142 $20,325,028 $0 $0 $0 $0
Sales $67,336,667 $108,130,631 $221,330,602 $233,665,953
$220,090,490 $242,146,784
EBIT $2,460,785 $4,571,252 $35,109,568 $32,357,440
$47,748,831 $29,612,346
Profits ($13,191,015) ($1,297,803) $15,037,220 $12,174,914
$22,360,139 $11,495,535
Cumulative Profit ($90,335,004) ($1,743,807) $62,774,268
$63,774,089 $57,636,889 $56,805,581
SG&A / Sales 11.1% 7.3% 9.8% 11.1% 6.7% 9.1%
Contrib. Margin % 6.9% 18.6% 32.1% 31.7% 36.2% 26.2%
CAPSTONE® COURIER Page 1
Stock & Bonds C58538 Round: 5Dec. 31, 2018
Stock Market Summary
Company Close Change Shares
MarketCap
($M)
Book Value EPS Dividend Yield P/E
Andrews $1.00 $0.00 2,291,939 $2 ($16.42) ($5.76) $0.00 0.0%
-0.2
Baldwin $6.27 $1.26 2,000,000 $13 $21.00 ($0.65) $0.00 0.0%
-9.7
Chester $89.62 $12.03 2,124,345 $190 $45.75 $7.08 $2.27 2.5%
12.7
Digby $88.94 $5.88 2,089,792 $186 $52.65 $5.83 $0.00 0.0%
15.3
Erie $84.15 $27.36 2,452,736 $206 $48.02 $9.12 $0.00 0.0%
9.2
Ferris $73.41 $5.35 2,187,083 $161 $45.97 $5.26 $0.00 0.0%
14.0
Bond Market Summary
Company Series# Face Yield Close$ S&P Company Series#
Face Yield Close$ S&P
Andrews Digby
14.0S2019 $20,850,000 14.2% 98.45 DDD 14.0S2019
$20,850,000 14.0% 100.09 B
Baldwin 11.6S2025 $3,523,690 12.9% 90.11 B
14.0S2019 $20,850,000 14.0% 99.91 CCC 12.2S2026
$8,623,471 13.2% 92.09 B
Chester 12.9S2027 $16,806,601 13.6% 95.04 B
14.0S2019 $20,850,000 14.0% 100.09 B 13.4S2028 $15,253,268
13.8% 97.38 B
12.1S2026 $13,308,235 13.2% 91.62 B Erie
12.9S2027 $12,249,416 13.6% 95.04 B 14.0S2019 $20,850,000
13.9% 100.44 B
13.4S2028 $10,916,191 13.8% 97.38 B 11.7S2025 $1,722,021
12.7% 92.16 B
12.3S2026 $11,199,852 13.0% 94.34 B
13.0S2027 $25,774,968 13.3% 97.48 B
13.5S2028 $15,359,294 13.5% 100.00 B
Ferris
14.0S2019 $20,850,000 14.0% 100.09 B
12.2S2026 $8,738,656 13.2% 92.09 B
12.9S2027 $15,268,932 13.6% 95.04 B
13.4S2028 $14,780,458 13.8% 97.38 B
Next Year's Prime Rate 9.50%
CAPSTONE® COURIER Page 2
Financial Summary C58538 Round: 5Dec. 31, 2018
Cash Flow Statement Survey Andrews Baldwin Chester Digby
Erie Ferris
CashFlows from operating activities
Net Income(Loss) ($13,191) ($1,298) $15,037 $12,175 $22,360
$11,496
Adjustment for non-cash items:
Depreciation $4,588 $7,587 $13,793 $15,000 $16,053 $11,400
Extraordinary gains/losses/writeoffs ($9,895) $0 $0 $0 $0
($550)
Changes in current assets and liablilities
Acounts payable ($3,984) ($2,083) $2,698 $1,775 $3,267
$3,856
Inventory $45,914 $8,396 ($8,052) ($10,962) $904 ($10,284)
Accounts Receivable $571 $1 ($1,935) ($549) ($4,638)
($3,400)
Net cash from operations $24,003 $12,603 $21,541 $17,439
$37,946 $12,518
Cash flows from investing activities
Plant improvements(net) $25,726 $0 ($43,600) ($54,100)
($50,500) ($44,570)
Cash flows from financing activities
Dividends paid $0 $0 ($4,824) $0 $0 $0
Sales of common stock $0 $0 $0 $2,979 $8,013 $5,433
Purchase of common stock $0 $0 $0 $0 $0 $0
Cash from long term debt issued $0 $0 $10,916 $15,253
$15,359 $14,780
Early retirement of long term debt $0 $0 $0 $0 $0 $0
Retirement of current debt ($155,312) ($32,928) ($35,285)
($39,209) ($27,955) ($30,911)
Cash from current debt borrowing $0 $0 $32,758 $38,773
$22,515 $30,255
Cash from emergency loan $105,583 $20,325 $0 $0 $0 $0
Net cash from financing activities ($49,728) ($12,603) $3,565
$17,796 $17,932 $19,558
Net change in cash position $0 $0 ($18,493) ($18,865) $5,378
($12,495)
Balance Sheet Survey Andrews Baldwin Chester Digby Erie
Ferris
Cash $0 $0 $35,035 $35,068 $49,536 $31,007
Accounts Receivable $5,535 $8,887 $18,192 $19,205 $18,090
$19,902
Inventory $61,098 $42,492 $20,052 $28,816 $4,387 $23,994
Total Current Assets $66,633 $51,380 $73,279 $83,090 $72,012
$74,903
Plant and equipment $68,822 $113,800 $206,900 $225,000
$240,800 $187,800
Accumulated Depreciation ($45,881) ($75,867) ($80,100)
($80,500) ($86,200) ($56,980)
Total Fixed Assets $22,941 $37,933 $126,800 $144,500
$154,600 $130,820
Total Assets $89,573 $89,313 $200,079 $227,590 $226,612
$205,723
Account Payable $776 $6,128 $12,817 $13,726 $11,416 $15,301
CurrentDebt $105,583 $20,325 $32,758 $38,773 $22,515
$30,255
Long Term Debt $20,850 $20,850 $57,324 $65,057 $74,906
$59,638
Total Liabilities $127,209 $47,303 $102,899 $117,556 $108,837
$105,194
Common Stock $28,360 $18,360 $23,767 $23,657 $40,177
$30,294
Retained Earnings ($65,996) $23,650 $73,412 $86,377 $77,598
$70,235
Total Equity ($37,636) $42,010 $97,179 $110,034 $117,775
$100,530
Total Liabilities & Owners'' Equity $89,573 $89,313 $200,079
$227,590 $226,612 $205,723
Income Statement Survey Andrews Baldwin Chester Digby Erie
Ferris
Sales $67,337 $108,131 $221,331 $233,666 $220,090 $242,147
Variable Costs(Labor,Material,Carry) $62,690 $88,058
$150,295 $159,498 $140,330 $178,752
Depreciation $4,588 $7,587 $13,793 $15,000 $16,053 $11,400
SGA(R&D,Promo,Sales,Admin) $7,492 $7,914 $21,587 $25,899
$14,790 $21,922
Other(Fees,Writeoffs,TQM,Bonuses) ($9,895) $0 $546 $912
$1,169 $461
EBIT $2,461 $4,571 $35,110 $32,357 $47,749 $29,612
Interest(Short term,Long term) $22,755 $6,568 $11,503 $13,245
$12,647 $11,566
Taxes ($7,103) ($699) $8,262 $6,690 $12,286 $6,316
Profit Sharing $0 $0 $307 $248 $456 $235
Net Profit ($13,191) ($1,298) $15,037 $12,175 $22,360 $11,496
CAPSTONE® COURIER Page 3
Production Analysis C58538 Round: 5Dec. 31, 2018
Name
Primary
Segment
Units
Sold
Unit
Inven
tory Revision Date
Age
Dec.31 MTBF
Pfmn
Coord
Size
Coord Price
Material
Cost
Labor
Cost
Contr.
Marg.
2nd
Shift
&
Over-
time
Auto
mation
Next
Round
Capacity
Next
Round
Plant
Utiliz.
Able Trad 959 2,397 7/4/2018 2.3 20000 6.0 13.0 $23.50 $0.00
$0.00 -9% 0% 4.0 1 0%
Acre Low 1,515 0 7/10/2018 2.4 15000 4.5 17.0 $17.40 $5.82
$8.13 15% 0% 5.0 1,400 7%
Adam Size 244 221 5/23/2018 2.1 22000 8.9 8.8 $33.00 $12.70
$10.83 18% 0% 3.0 900 6%
Aft Pfmn 92 56 6/5/2018 2.1 22000 11.8 14.5 $29.90 $12.12
$10.83 15% 0% 3.0 300 50%
Agape Size 262 322 6/10/2018 2.3 20000 5.8 8.0 $29.00 $11.68
$10.83 10% 0% 3.0 600 25%
Baker Trad 1,949 478 8/16/2018 2.0 17500 7.5 12.2 $25.00
$9.44 $9.46 23% 0% 4.0 1,800 99%
Bead Low 2,609 395 5/25/2009 9.6 14000 3.0 17.0 $18.50 $4.82
$9.85 18% 82% 5.0 1,400 180%
Bid High 49 868 6/9/2016 4.1 22000 9.9 10.0 $36.50 $0.00
$0.00 -107% 0% 3.0 900 0%
Bold Pfmn 137 38 7/16/2016 3.9 26000 11.4 15.1 $33.00 $13.02
$10.81 24% 0% 3.0 600 25%
Buddy Size 146 270 5/4/2017 3.3 19000 5.4 8.6 $33.00 $0.00
$0.00 20% 0% 3.0 600 0%
Cake Trad 1,994 0 9/14/2017 2.4 14000 7.8 12.2 $25.50 $8.51
$8.36 33% 100% 6.5 1,300 198%
Cedar Low 2,806 311 2/5/2020 9.6 12000 3.0 17.0 $18.50 $4.22
$4.68 50% 49% 8.5 1,900 147%
Cid High 1,194 354 11/15/2018 1.1 23000 13.6 6.4 $36.50
$15.67 $12.75 21% 61% 3.5 1,150 160%
Coat Pfmn 1,049 145 12/14/2018 1.2 27000 14.7 12.3 $31.50
$15.53 $9.35 21% 16% 5.0 1,150 115%
Cure Size 1,332 173 12/14/2018 1.2 17000 7.7 5.3 $31.50
$12.53 $9.97 29% 40% 5.0 1,400 139%
Daze Trad 1,957 193 9/18/2018 1.4 19000 8.9 11.2 $28.50
$10.82 $9.20 30% 100% 6.0 1,300 198%
Dell Low 1,783 361 6/19/2019 9.6 14000 3.0 17.0 $21.00 $4.82
$4.98 51% 13% 8.0 1,600 111%
Dixie High 845 352 1/1/2018 2.1 25000 13.5 6.5 $38.50 $16.19
$11.06 25% 5% 3.5 1,100 104%
Dot Pfmn 945 150 10/6/2018 1.3 27000 14.8 12.1 $33.50 $15.62
$9.45 24% 0% 4.5 1,100 99%
Dune Size 1,350 195 1/9/2019 2.3 19000 7.2 6.4 $33.50 $12.47
$10.25 30% 22% 4.5 1,450 121%
Doom Pfmn 928 151 11/30/2018 1.0 27000 14.7 12.2 $33.50
$15.55 $7.98 29% 62% 6.0 1,200 160%
Dust 0 0 5/25/2018 0.6 19000 7.8 5.4 $0.00 $0.00 $0.00 0% 0%
1.0 600 0%
Eat Low 1,973 119 1/15/2018 5.1 12500 5.5 14.5 $20.00 $6.29
$4.56 43% 36% 8.5 1,400 134%
Ebb Low 3,224 246 6/18/2019 9.6 12000 3.0 17.0 $18.00 $4.22
$4.94 47% 86% 8.5 2,000 184%
Echo Trad 2,235 42 10/19/2018 1.3 14000 8.5 11.5 $25.50 $9.05
$7.52 35% 100% 6.5 1,700 198%
Egg Trad 2,573 2 10/30/2018 1.4 15000 8.7 11.3 $25.50 $9.50
$10.03 24% 100% 5.5 1,800 198%
Fast Low 877 0 1/29/2017 5.1 12000 5.5 14.5 $20.50 $6.14
$11.71 12% 100% 4.0 400 198%
Feat Low 1,161 262 7/27/2018 5.0 27000 13.8 12.9 $22.50
$14.95 $7.12 24% 13% 6.0 1,250 112%
Fist High 1,576 263 12/26/2018 1.0 25000 13.7 6.4 $37.50
$16.31 $13.38 21% 100% 4.0 1,150 198%
Foam Pfmn 1,012 128 10/19/2018 1.2 27000 14.8 12.1 $32.50
$15.62 $8.84 24% 24% 5.5 950 122%
Fume Size 1,347 157 11/19/2018 1.1 17000 7.4 4.8 $32.50
$12.72 $9.25 32% 42% 5.5 1,100 141%
Fox High 1,661 221 11/16/2018 0.9 25000 13.9 6.1 $37.50
$16.50 $8.54 33% 46% 5.5 1,500 145%
Fuel 0 0 6/3/2019 0.0 0 0.0 0.0 $0.00 $0.00 $0.00 0% 0% 5.5
600 0%
CAPSTONE® COURIER Page 4
Traditional Segment Analysis C58538 Round: 5Dec. 31, 2018
Traditional Statistics
Total Industry Unit Demand 11,471
Actual Industry Unit Sales 11,471
Segment % of Total Industry 27.5%
Next Year's Segment Growth Rate 9.2%
Traditional Customer Buying Criteria
Expectations Importance
1. Age Ideal Age = 2.0 47%
2. Price $17.50 - 27.50 23%
3. Ideal Position Pfmn 8.5 Size 11.5 21%
4. Reliability MTBF 14000-19000 9%
Top Products in Traditional Segment
Name
Market
Share
Units
Sold to
Seg
Revision
Date
Stock
Out
Pfmn
Coord
Size
Coord
List
Price MTBF
Age
Dec.31
Promo
Budget
Cust.
Aware-
ness
Sales
Budget
Cust.
Access-
ibility
Dec.
Cust.
Survey
Egg 22% 2,573 10/30/2018 8.7 11.3 $25.50 15000 1.43
$1,500 87% $1,056 77% 38
Echo 19% 2,235 10/19/2018 8.5 11.5 $25.50 14000 1.26
$1,500 87% $1,056 77% 33
Cake 17% 1,994 9/14/2017 YES 7.8 12.2 $25.50 14000
2.45 $1,300 78% $1,930 55% 30
Daze 17% 1,957 9/18/2018 8.9 11.2 $28.50 19000 1.36
$1,350 84% $1,556 45% 25
Baker 16% 1,865 8/16/2018 7.5 12.2 $25.00 17500 1.96
$1,350 74% $1,350 35% 33
Able 7% 759 7/4/2018 6.0 13.0 $23.50 20000 2.27 $200
22% $200 14% 11
Eat 1% 64 1/15/2018 5.5 14.5 $20.00 12500 5.09 $1,500
89% $1,056 77% 0
Fast 0% 25 1/29/2017 YES 5.5 14.5 $20.50 12000 5.08
$500 45% $715 18% 0
CAPSTONE® COURIER Page 5
Low End Segment Analysis C58538 Round: 5Dec. 31, 2018
Low End Statistics
Total Industry Unit Demand 15,581
Actual Industry Unit Sales 15,581
Segment % of Total Industry 37.3%
Next Year's Segment Growth Rate 11.7%
Low End Customer Buying Criteria
Expectations Importance
1. Price $12.50 - 22.50 53%
2. Age Ideal Age = 7.0 24%
3. Ideal Position Pfmn 4.2 Size 15.8 16%
4. Reliability MTBF 12000-17000 7%
Top Products in Low End Segment
Name
Market
Share
Units
Sold to
Seg
Revision
Date
Stock
Out
Pfmn
Coord
Size
Coord
List
Price MTBF
Age
Dec.31
Promo
Budget
Cust.
Aware-
ness
Sales
Budget
Cust.
Access-
ibility
Dec.
Cust.
Survey
Ebb 21% 3,224 6/18/2019 3.0 17.0 $18.00 12000 9.60
$1,500 88% $1,056 61% 13
Cedar 18% 2,806 2/5/2020 3.0 17.0 $18.50 12000 9.60
$1,300 78% $2,026 56% 11
Bead 17% 2,609 5/25/2009 3.0 17.0 $18.50 14000 9.60
$1,350 69% $1,350 42% 11
Eat 12% 1,909 1/15/2018 5.5 14.5 $20.00 12500 5.09
$1,500 89% $1,056 61% 13
Dell 11% 1,783 6/19/2019 3.0 17.0 $21.00 14000 9.60
$1,350 83% $1,556 49% 7
Acre 10% 1,515 7/10/2018 YES 4.5 17.0 $17.40 15000
2.44 $200 21% $200 13% 8
Fast 5% 852 1/29/2017 YES 5.5 14.5 $20.50 12000 5.08
$500 45% $715 58% 8
Feat 4% 597 7/27/2018 13.8 12.9 $22.50 27000 5.01 $1,400
80% $1,287 58% 0
Able 1% 201 7/4/2018 6.0 13.0 $23.50 20000 2.27 $200
22% $200 13% 1
Baker 1% 84 8/16/2018 7.5 12.2 $25.00 17500 1.96 $1,350
74% $1,350 42% 0
CAPSTONE® COURIER Page 6
High End Segment Analysis C58538 Round: 5Dec. 31, 2018
High End Statistics
Total Industry Unit Demand 5,410
Actual Industry Unit Sales 5,410
Segment % of Total Industry 13.0%
Next Year's Segment Growth Rate 16.2%
High End Customer Buying Criteria
Expectations Importance
1. Ideal Position Pfmn 13.4 Size 6.6 43%
2. Age Ideal Age = 0.0 29%
3. Reliability MTBF 20000-25000 19%
4. Price $27.50 - 37.50 9%
Top Products in High End Segment
Name
Market
Share
Units
Sold to
Seg
Revision
Date
Stock
Out
Pfmn
Coord
Size
Coord
List
Price MTBF
Age
Dec.31
Promo
Budget
Cust.
Aware-
ness
Sales
Budget
Cust.
Access-
ibility
Dec.
Cust.
Survey
Fox 31% 1,661 11/16/2018 13.9 6.1 $37.50 25000 0.94
$1,450 74% $1,287 73% 45
Fist 29% 1,576 12/26/2018 13.7 6.4 $37.50 25000 1.03
$1,450 85% $1,287 73% 56
Cid 22% 1,194 11/15/2018 13.6 6.4 $36.50 23000 1.12
$1,250 73% $2,026 56% 41
Dixie 16% 845 1/1/2018 13.5 6.5 $38.50 25000 2.07 $1,375
84% $1,653 47% 29
Adam 2% 86 5/23/2018 8.9 8.8 $33.00 22000 2.12 $200
24% $200 13% 1
Bid 1% 49 6/9/2016 9.9 10.0 $36.50 22000 4.14 $0 40% $0
14% 0
CAPSTONE® COURIER Page 7
Performance Segment Analysis C58538 Round: 5Dec. 31, 2018
Performance Statistics
Total Industry Unit Demand 4,726
Actual Industry Unit Sales 4,726
Segment % of Total Industry 11.3%
Next Year's Segment Growth Rate 19.8%
Performance Customer Buying Criteria
Expectations Importance
1. Reliability MTBF 22000-27000 43%
2. Ideal Position Pfmn 14.4 Size 12.5 29%
3. Price $22.50 - 32.50 19%
4. Age Ideal Age = 1.0 9%
Top Products in Performance Segment
Name
Market
Share
Units
Sold to
Seg
Revision
Date
Stock
Out
Pfmn
Coord
Size
Coord
List
Price MTBF
Age
Dec.31
Promo
Budget
Cust.
Aware-
ness
Sales
Budget
Cust.
Access-
ibility
Dec.
Cust.
Survey
Coat 22% 1,049 12/14/2018 14.7 12.3 $31.50 27000 1.23
$1,200 71% $1,833 48% 45
Foam 21% 1,012 10/19/2018 14.8 12.1 $32.50 27000 1.24
$1,400 83% $1,287 36% 41
Dot 20% 945 10/6/2018 14.8 12.1 $33.50 27000 1.28
$1,350 82% $1,653 57% 38
Doom 20% 928 11/30/2018 14.7 12.2 $33.50 27000 0.97
$1,350 74% $1,653 57% 37
Feat 12% 564 7/27/2018 13.8 12.9 $22.50 27000 5.01
$1,400 80% $1,287 36% 49
Bold 3% 137 7/16/2016 11.4 15.1 $33.00 26000 3.92 $0
16% $0 8% 5
Aft 2% 92 6/5/2018 11.8 14.5 $29.90 22000 2.05 $100 22%
$100 10% 2
CAPSTONE® COURIER Page 8
Size Segment Analysis C58538 Round: 5Dec. 31, 2018
Size Statistics
Total Industry Unit Demand 4,596
Actual Industry Unit Sales 4,596
Segment % of Total Industry 11.0%
Next Year's Segment Growth Rate 18.3%
Size Customer Buying Criteria
Expectations Importance
1. Ideal Position Pfmn 7.5 Size 5.6 43%
2. Age Ideal Age = 1.5 29%
3. Reliability MTBF 16000-21000 19%
4. Price $22.50 - 32.50 9%
Top Products in Size Segment
Name
Market
Share
Units
Sold to
Seg
Revision
Date
Stock
Out
Pfmn
Coord
Size
Coord
List
Price MTBF
Age
Dec.31
Promo
Budget
Cust.
Aware-
ness
Sales
Budget
Cust.
Access-
ibility
Dec.
Cust.
Survey
Dune 29% 1,350 1/9/2019 7.2 6.4 $33.50 19000 2.29
$1,350 82% $1,653 42% 24
Fume 29% 1,347 11/19/2018 7.4 4.8 $32.50 17000 1.14
$1,400 83% $1,287 37% 27
Cure 29% 1,332 12/14/2018 7.7 5.3 $31.50 17000 1.19
$1,200 72% $1,833 49% 37
Agape 6% 262 6/10/2018 5.8 8.0 $29.00 20000 2.32 $200
23% $200 13% 7
Adam 3% 159 5/23/2018 8.9 8.8 $33.00 22000 2.12 $200
24% $200 13% 5
Buddy 3% 146 5/4/2017 5.4 8.6 $33.00 19000 3.29 $0 30%
$0 14% 2
CAPSTONE® COURIER Page 9
Market Share C58538 Round: 5Dec. 31, 2018
Actual Market Share in Units Potential Market Share in Units
Trad Low High Pfmn Size Total Trad Low High Pfmn Size
Total
Industry Unit Sales 11,471 15,581 5,410 4,726 4,596 41,784
Units Demanded 11,471 15,581 5,410 4,726 4,596 41,784
% of Market 27.5% 37.3% 13.0% 11.3% 11.0% 100.0% % of
Market 27.5% 37.3% 13.0% 11.3% 11.0% 100.0%
Able 6.6% 1.3% 2.3% Able 5.3% 1.3% 1.9%
Acre 9.7% 3.6% Acre 9.8% 3.7%
Adam 1.6% 3.5% 0.6% Adam 1.6% 3.5% 0.6%
Aft 2.0% 0.2% Aft 3.5% 0.4%
Agape 5.7% 0.6% Agape 5.7% 0.6%
Total 6.6% 11.0% 1.6% 2.0% 9.2% 7.4% Total 5.3% 11.1%
1.6% 3.5% 9.2% 7.2%
Baker 16.3% 0.5% 4.7% Baker 13.2% 0.5% 3.8%
Bead 16.8% 6.3% Bead 16.3% 6.1%
Bid 0.9% 0.1% Bid 0.9%
Bold 2.9% 0.3% Bold 2.9% 0.3%
Buddy 3.2% 0.4% Buddy 3.2% 0.3%
Total 16.3% 17.3% 0.9% 2.9% 3.2% 11.7% Total 13.2% 16.9%
0.9% 2.9% 3.2% 10.7%
Cake 17.4% 4.8% Cake 19.5% 5.4%
Cedar 18.0% 6.7% Cedar 17.6% 6.6%
Cid 22.1% 2.9% Cid 22.1% 2.9%
Coat 22.2% 2.5% Coat 21.8% 2.5%
Cure 29.0% 3.2% Cure 29.0% 3.2%
Total 17.4% 18.0% 22.1% 22.2% 29.0% 20.0% Total 19.5%
17.6% 22.1% 21.8% 29.0% 20.4%
Daze 17.1% 4.7% Daze 15.4% 4.2%
Dell 11.4% 4.3% Dell 11.2% 4.2%
Dixie 15.6% 2.0% Dixie 15.6% 2.0%
Dot 20.0% 2.3% Dot 19.6% 2.2%
Dune 29.4% 3.2% Dune 29.4% 3.2%
Doom 19.6% 2.2% Doom 19.3% 2.2%
Total 17.1% 11.4% 15.6% 39.6% 29.4% 18.7% Total 15.4%
11.2% 15.6% 38.9% 29.4% 18.0%
Eat 0.6% 12.2% 4.7% Eat 0.4% 11.8% 4.5%
Ebb 20.7% 7.7% Ebb 20.2% 7.5%
Echo 19.5% 5.3% Echo 21.8% 6.0%
Egg 22.4% 6.2% Egg 24.2% 6.6%
Total 42.5% 32.9% 23.9% Total 46.4% 32.0% 24.7%
Fast 0.2% 5.5% 2.1% Fast 0.2% 7.4% 2.8%
Feat 3.8% 11.9% 2.8% Feat 3.8% 11.9% 2.8%
Fist 29.1% 3.8% Fist 29.1% 3.8%
Foam 21.4% 2.4% Foam 21.0% 2.4%
Fume 29.3% 3.2% Fume 29.3% 3.2%
Fox 30.7% 4.0% Fox 30.7% 4.0%
Total 0.2% 9.3% 59.8% 33.3% 29.3% 18.3% Total 0.2% 11.2%
59.8% 33.0% 29.3% 18.9%
CAPSTONE® COURIER Page 10
Perceptual Map C58538 Round: 5Dec. 31, 2018
Andrews Baldwin Chester
Name Pfmn Size Revised Name Pfmn Size Revised Name Pfmn
Size Revised
Able 6.0 13.0 7/4/2018 Baker 7.5 12.2 8/16/2018 Cake
7.8 12.2 9/14/2017
Acre 4.5 17.0 7/10/2018 Bead 3.0 17.0 5/25/2009 Cedar
3.0 17.0 2/5/2020
Adam 8.9 8.8 5/23/2018 Bid 9.9 10.0 6/9/2016 Cid
13.6 6.4 11/15/2018
Aft 11.8 14.5 6/5/2018 Bold 11.4 15.1 7/16/2016 Coat
14.7 12.3 12/14/2018
Agape 5.8 8.0 6/10/2018 Buddy 5.4 8.6 5/4/2017 Cure
7.7 5.3 12/14/2018
Abum 5.5 14.8 4/7/2018
Ajoy 6.1 14.8 2/18/2018
Apps 5.9 14.5 3/31/2018
Digby Erie Ferris
Name Pfmn Size Revised Name Pfmn Size Revised Name Pfmn
Size Revised
Daze 8.9 11.2 9/18/2018 Eat 5.5 14.5 1/15/2018 Fast
5.5 14.5 1/29/2017
Dell 3.0 17.0 6/19/2019 Ebb 3.0 17.0 6/18/2019 Feat
13.8 12.9 7/27/2018
Dixie 13.5 6.5 1/1/2018 Echo 8.5 11.5 10/19/2018 Fist
13.7 6.4 12/26/2018
Dot 14.8 12.1 10/6/2018 Egg 8.7 11.3 10/30/2018 Foam
14.8 12.1 10/19/2018
Dune 7.2 6.4 1/9/2019 Fume 7.4 4.8 11/19/2018
Doom 14.7 12.2 11/30/2018 Fox 13.9 6.1 11/16/2018
Dust 7.8 5.4 5/25/2018
CAPSTONE® COURIER Page 11
HR/TQM Report C58538 Round: 5Dec. 31, 2018
HUMAN RESOURCES SUMMARY
Andrews Baldwin Chester Digby Erie Ferris
Needed Complement 82 700 1,108 1,151 995 1,215
Complement 82 700 1,108 1,151 995 1,215
1st Shift Complement 82 534 731 896 539 800
2nd Shift Complement 0 166 377 255 456 415
Overtime Percent 0.0% 0.0% 0.0% 0.0% 0.0% 0.0%
Turnover Rate 10.0% 10.0% 10.0% 10.0% 10.0% 10.0%
New Employees 8 70 322 240 335 309
Separated Employees 449 211 0 0 0 0
Recruiting Spend $0 $0 $0 $0 $0 $0
Training Hours 0 0 0 0 0 0
Productivity Index 100.0% 100.0% 100.0% 100.0% 100.0%
100.0%
Recruiting Cost $8 $70 $322 $240 $335 $309
Separation Cost $2,245 $1,055 $0 $0 $0 $0
Training Cost $0 $0 $0 $0 $0 $0
Total HR Admin Cost $2,253 $1,125 $322 $240 $335 $309
Labor Contract Next Year
Wages $26.81 $26.81 $26.81 $26.81 $26.81 $26.81
Benefits 2,500 2,500 2,500 2,500 2,500 2,500
Profit Sharing 2.0% 2.0% 2.0% 2.0% 2.0% 2.0%
Annual Raise 5.0% 5.0% 5.0% 5.0% 5.0% 5.0%
Starting Negotiation Position
Wages
Benefits
Profit Sharing
Annual Raise
Ceiling Negotiation Position
Wages
Benefits
Profit Sharing
Annual Raise
Adjusted Labor Demands
Wages
Benefits
Profit Sharing
Annual Raise
Strike Days
TQM SUMMARY
Andrews Baldwin Chester Digby Erie Ferris
Process Mgt Budgets Last Year
CPI Systems $0 $0 $0 $0 $0 $0
Vendor/JIT $0 $0 $0 $0 $0 $0
Quality Initiative Training $0 $0 $0 $0 $0 $0
Channel Support Systems $0 $0 $0 $0 $0 $0
Concurrent Engineering $0 $0 $0 $0 $0 $0
UNEP Green Programs $0 $0 $0 $0 $0 $0
TQM Budgets Last Year
Benchmarking $0 $0 $0 $0 $0 $0
Quality Function Deployment Effort $0 $0 $0 $0 $0 $0
CCE/6 Sigma Training $0 $0 $0 $0 $0 $0
GEMI TQEM Sustainability Initiatives $0 $0 $0 $0 $0 $0
Total Expenditures $0 $0 $0 $0 $0 $0
Cumulative Impacts
Material Cost Reduction 0.00% 0.00% 0.00% 0.00% 0.00%
0.00%
Labor Cost Reduction 0.00% 0.00% 0.00% 0.00% 0.00% 0.00%
Reduction R&D Cycle Time 0.00% 0.00% 0.00% 0.00% 0.00%
0.00%
Reduction Admin Costs 0.00% 0.00% 0.00% 0.00% 0.00%
0.00%
Demand Increase 0.00% 0.00% 0.00% 0.00% 0.00% 0.00%
CAPSTONE® COURIER Page 12
Ethics Report C58538 Round: 5Dec. 31, 2018
ETHICS SUMMARY
Other (Fees, Writeoffs, etc.) The actual dollar impact. Example,
$120 means Other increased by $120.
Demand Factor The % of normal. 98% means demand fell 2%.
Material Cost Impact The % of normal. 104% means matieral
costs rose 4%.
Admin Cost Impact The % of normal. 103% means admin costs
rose 3%.
Productivity Impact The % of normal. 104% means productivity
increased by 4%.
Awareness Impact The % of normal. 105% means normal
awareness was multiplied by 1.05.
Accessibility Impact The % of normal. 98% means normal
accessiblity was multiplied by 0.98.
Normal means the value that would have been produced if the
problem had not been presented.
No Impact Andrews Baldwin Chester Digby Erie Ferris
Total
Other (Fees, Writeoffs, etc.) $0 $0 $0 $0 $0 $0 $0
Demand Factor 100% 100% 100% 100% 100% 100% 100%
Material Cost Impact 100% 100% 100% 100% 100% 100%
100%
Admin Cost Impact 100% 100% 100% 100% 100% 100% 100%
Productivity Impact 100% 100% 100% 100% 100% 100% 100%
Awareness Impact 100% 100% 100% 100% 100% 100% 100%
Accessibility Impact 100% 100% 100% 100% 100% 100% 100%
CAPSTONE® COURIER Page 13
Annual Report
Annual Report Andrews C58538 Round: 5Dec. 31, 2018
Balance Sheet
DEFINITIONS:
Common Size: The common size
column simply represents each item as a
percentage of total assets for that year.
Cash: Your end-of-year cash position.
Accounts Receivable: Reflects the lag
between delivery and payment of your
products. Inventories: The current
value of your inventory across all products. A
zero indicates your company stocked out.
Unmet demand would, of course, fall to your
competitors. Plant & Equipment: The
current value of your plant. Accum
Deprec: The total accumulated
depreciation from your plant. Accts
Payable: What the company currently
owes suppliers for materials and services.
Current Debt: The debt the company
is obligated to pay during the next year of
operations. It includes emergency loans used
to keep your company solvent should you run
out of cash during the year. Long
Term Debt: The company's
long term debt is in the form of bonds, and this
represents the total value of your bonds.
Common Stock: The amount of
capital invested by shareholders in the
company. Retained Earnings:
The profits that the company chose to keep
instead of paying to shareholders as dividends.
ASSETS 2018
Common
Size
2017
Cash $0 0.0% $0
Account Receivable $5,535 6.2% $6,105
Inventory $61,098 68.2% $107,012
Total Current Assets $66,633 74.4% $113,117
Plant & Equipment $68,822 76.8% $108,400
Accumulated Depreciation ($45,881) -51.2% ($65,040)
Total Fixed Assets $22,941 25.6% $43,360
Total Assets $89,573 100.0% $156,477
LIABILITIES & OWNER'S
EQUITY
Accounts Payable $776 0.9% $4,760
Current Debt $105,583 118.0% $155,312
Long Term Debt $20,850 23.3% $20,850
Total Liabilities $127,209 142.0% $180,922
Common Stock $28,360 31.7% $28,360
Retained Earnings ($65,996) -73.7% ($52,805)
Total Equity ($37,636) -42.0% ($24,445)
Total Liab. & O. Equity $89,573 100.0% $156,477
Cash Flow Statement
The Cash Flow Statement examines what happened in the Cash
Account during the year. Cash injections appear as positive
numbers and
cash withdrawals as negative numbers. The Cash Flow
Statement is an
excellent tool for diagnosing emergency loans. When negative
cash flows
exceed positives, you are forced to seek emergency funding. For
example,
if sales are bad and you find yourself carrying an abundance of
excess
inventory, the report would show the increase in inventory as a
huge
negative cash flow. Too much unexpected inventory could
outstrip your
inflows, exhaust your starting cash and force you to beg for
money to keep
your company afloat.
Cash Flows from Operating Activities 2018 2017
NetIncome(Loss) ($13,191) ($28,964)
Depreciation $4,588 $7,227
Extraordinary gains/losses/writeoffs ($9,895) $0
Accounts Payable ($3,984) ($171)
Inventory $45,914 $3,669
Accounts Receivable $571 ($355)
Net cash from operation $24,003 ($18,594)
Cash Flows from Investing Activities
Plant Improvements $25,726 $0
Cash Flows from Financing Activities
Dividends Paid $0 $0
Sales of Common Stock $0 $0
Purchase of Common Stock $0 $0
Cash from long term debt $0 $0
Retirement of long term debt $0 ($10,925)
Change in current debt(net) ($49,728) $29,518
Net Cash from financing activities ($49,728) $18,594
Net Change in cash position $0 $0
Closing cash position $0 $0
Annual Report Page 14
Annual Report Andrews C58538 Round: 5Dec. 31, 2018
2018 Income Statement
(Product Name) Able Acre Adam Aft Agape Abum Ajoy Apps
2018
Total
Common
Size
Sales $22,543 $26,364 $8,064 $2,757 $7,609 $0 $0 $0 $67,337
100.0%
Variable Costs:
Direct Labor $8,555 $11,719 $2,431 $999 $2,714 $0 $0 $0
$26,418 39.2%
Direct Material $10,263 $10,689 $3,555 $1,190 $3,244 $0 $0 $0
$28,941 43.0%
Inventory Carry $5,643 $0 $650 $160 $878 $0 $0 $0 $7,332
10.9%
Total Variable $24,461 $22,408 $6,636 $2,350 $6,836 $0 $0 $0
$62,690 93.1%
Contribution Margin ($1,918) $3,956 $1,428 $408 $773 $0 $0
$0 $4,647 6.9%
Period Costs:
Depreciation $1 $2,427 $1,080 $360 $720 $0 $0 $0 $4,588 6.8%
SG&A: R&D $512 $530 $396 $432 $445 $269 $134 $249
$2,968 4.4%
Promotions $200 $200 $200 $100 $200 $0 $0 $0 $900 1.3%
Sales $200 $200 $200 $100 $200 $0 $0 $0 $900 1.3%
Admin $912 $1,067 $326 $112 $308 $0 $0 $0 $2,725 4.0%
Total Period $1,826 $4,423 $2,203 $1,104 $1,873 $269 $134
$249 $12,080 17.9%
Net Margin ($3,744) ($467) ($775) ($696) ($1,101) ($269)
($134) ($249) ($7,434) -11.0%
Definitions: Sales: Unit Sales times list price. Direct Labor:
Labor costs incurred to produce the
product that was sold. Inventory Carry Cost: the cost unsold
goods in inventory. Depreciation:
Calculated on straight-line. 15-year depreciation of plant value.
R&D Costs: R&D department
expenditures for each product. Admin: Administration overhead
is estimated at 1.5% of sales.
Promotions: The promotion budget for each product. Sales: The
sales force budget for each
product. Other: Chargs not included in other categories such as
Fees, Write offs, and TQM. The fees
include money paid to investment bankers and brokerage firms
to issue new stocks or bonds plus consulting
fees your instructor might assess. Write-offs include the loss
you might experience when you sell capacity or
liquidate inventory as the result of eliminating a production
line. If the amount appears as a negative amount,
then you actually made money on the liquidation of capacity or
inventory. EBIT: Earnings Before Interest
and Taxes. Short Term Interest: Interest expense based on last
year''s current debt, including short term
debt, long term notes that have become due, and emergency
loans, Long Term Interest: Interest paid on
outstanding bonds. Taxes: Income tax based upon a 35% tax
rate. Profit Sharing: Profits shared
with employees under the labor contract. Net Profit: EBIT
minus interest, taxes, and profit sharing.
Other ($9,895) -14.7%
EBIT $2,461 3.7%
Short Term Interest $19,836 29.5%
Long Term Interest $2,919 4.3%
Taxes ($7,103) -10.5%
Profit Sharing $0 0.0%
Net Profit ($13,191) -19.6%
Annual Report Page 15
C58538Front PageStock & BondsFinancial SummaryProduction
AnalysisTraditional Segment AnalysisLow End Segment
AnalysisHigh End Segment AnalysisPerformance Segment
AnalysisSize Segment AnalysisMarket SharePerceptual
MapHR/TQM ReportEthics ReportAnnual
ReportAndrewsBalance SheetIncome Statement
Round: 4
Dec. 31, 2017 C58538
Andrews
Eugene Ellis
Philip Mull
Baldwin
Lisa Chastain
Monica Dalke
matt rix
Chester
Digby Erie Ferris
Selected Financial Statistics
Andrews Baldwin Chester Digby Erie Ferris
ROS -39.0% -2.4% 9.1% 7.9% 6.2% 6.1%
Asset Turnover 0.47 1.03 1.11 1.16
0.89 1.18
ROA -18.5% -2.5% 10.1% 9.2% 5.5% 7.2%
Leverage
(Assets/Equity)
-6.4 2.4 2.1 2.1 2.1
2.0
ROE -118.5% -6.1% 20.8% 18.9% 11.6% 14.7%
Emergency Loan $144,387,047 $19,028,216 $0 $0 $0 $0
Sales $74,279,337 $108,140,184 $197,793,741 $226,989,314
$163,657,275 $200,781,475
EBIT ($13,609,560) $3,692,335 $38,518,462 $39,191,926
$27,033,430 $28,824,169
Profits ($28,964,077) ($2,628,021) $18,059,732 $17,922,007
$10,154,948 $12,303,415
Cumulative Profit ($77,143,989) ($446,004) $47,737,048
$51,599,176 $35,276,750 $45,310,045
SG&A / Sales 8.4% 8.3% 9.4% 10.3% 8.7% 10.3%
Contrib. Margin % -0.2% 18.7% 34.7% 32.9% 34.0% 29.7%
CAPSTONE® COURIER Page 1
Stock & Bonds C58538 Round: 4Dec. 31, 2017
Stock Market Summary
Company Close Change Shares
MarketCap
($M)
Book Value EPS Dividend Yield P/E
Andrews $1.00 $0.00 2,291,939 $2 ($10.67) ($12.64) $0.00
0.0% -0.0
Baldwin $5.00 ($7.57) 2,000,000 $10 $21.65 ($1.31) $0.00
0.0% -3.8
Chester $77.59 $17.05 2,124,345 $165 $40.94 $8.50 $3.36 4.3%
9.1
Digby $83.06 $18.15 2,053,924 $171 $46.19 $8.73 $1.36 1.6%
9.5
Erie $56.79 $5.20 2,311,647 $131 $37.81 $4.39 $0.00 0.0%
12.9
Ferris $68.06 $6.77 2,107,251 $143 $39.67 $5.84 $0.00 0.0%
11.7
Bond Market Summary
Company Series# Face Yield Close$ S&P Company Series#
Face Yield Close$ S&P
Andrews Digby
14.0S2019 $20,850,000 14.3% 97.89 DDD 14.0S2019
$20,850,000 13.9% 101.00 B
Baldwin 11.6S2025 $3,523,690 12.7% 91.48 B
14.0S2019 $20,850,000 14.0% 99.67 CC 12.2S2026 $8,623,471
13.0% 93.93 B
Chester 12.9S2027 $16,806,601 13.3% 97.33 B
14.0S2019 $20,850,000 13.9% 101.00 B Erie
12.1S2026 $13,308,235 13.0% 93.43 B 14.0S2019 $20,850,000
13.9% 100.83 CCC
12.9S2027 $12,249,416 13.3% 97.33 B 11.7S2025 $1,722,021
12.8% 91.51 CCC
12.3S2026 $11,199,852 13.1% 93.95 CCC
13.0S2027 $25,774,968 13.4% 97.34 CCC
Ferris
14.0S2019 $20,850,000 13.9% 101.00 B
12.2S2026 $8,738,656 13.0% 93.93 B
12.9S2027 $15,268,932 13.3% 97.33 B
Next Year's Prime Rate 9.00%
CAPSTONE® COURIER Page 2
Financial Summary C58538 Round: 4Dec. 31, 2017
Cash Flow Statement Survey Andrews Baldwin Chester Digby
Erie Ferris
CashFlows from operating activities
Net Income(Loss) ($28,964) ($2,628) $18,060 $17,922 $10,155
$12,303
Adjustment for non-cash items:
Depreciation $7,227 $7,587 $10,887 $11,393 $12,687 $9,600
Extraordinary gains/losses/writeoffs $0 $0 $0 $0 $0 ($403)
Changes in current assets and liablilities
Acounts payable ($171) $89 $738 $598 ($1,743) $360
Inventory $3,669 ($18,140) $4,614 $4,676 $8,155 $221
Accounts Receivable ($355) ($990) ($3,145) ($3,398) ($783)
($1,256)
Net cash from operations ($18,594) ($14,083) $31,153 $31,192
$28,470 $20,825
Cash flows from investing activities
Plant improvements(net) $0 $0 ($4,800) ($12,500) ($32,200)
($29,870)
Cash flows from financing activities
Dividends paid $0 $0 ($7,141) ($2,791) $0 $0
Sales of common stock $0 $0 $0 $0 $8,217 $5,768
Purchase of common stock $0 $0 $0 $0 $0 $0
Cash from long term debt issued $0 $0 $12,249 $16,807
$25,775 $15,269
Early retirement of long term debt $0 $0 $0 $0 $0 $0
Retirement of current debt ($125,793) ($4,945) ($22,524)
($26,194) ($16,972) ($22,433)
Cash from current debt borrowing $0 $0 $21,385 $25,380
$14,055 $26,294
Cash from emergency loan $144,387 $19,028 $0 $0 $0 $0
Net cash from financing activities $18,594 $14,083 $3,969
$13,201 $31,076 $24,898
Net change in cash position $0 $0 $30,322 $31,893 $27,346
$15,853
Balance Sheet Survey Andrews Baldwin Chester Digby Erie
Ferris
Cash $0 $0 $53,528 $53,933 $44,158 $43,502
Accounts Receivable $6,105 $8,888 $16,257 $18,657 $13,451
$16,503
Inventory $107,012 $50,888 $12,000 $17,854 $5,291 $13,710
Total Current Assets $113,117 $59,777 $81,785 $90,444
$62,900 $73,714
Plant and equipment $108,400 $113,800 $163,300 $170,900
$190,300 $144,000
Accumulated Depreciation ($65,040) ($68,280) ($66,307)
($65,500) ($70,147) ($46,900)
Total Fixed Assets $43,360 $45,520 $96,993 $105,400 $120,153
$97,100
Total Assets $156,477 $105,297 $178,778 $195,844 $183,054
$170,814
Account Payable $4,760 $8,211 $10,119 $11,951 $8,149
$11,445
CurrentDebt $155,312 $32,928 $35,285 $39,209 $27,955
$30,911
Long Term Debt $20,850 $20,850 $46,408 $49,804 $59,547
$44,858
Total Liabilities $180,922 $61,989 $91,812 $100,964 $95,651
$87,213
Common Stock $28,360 $18,360 $23,767 $20,678 $32,164
$24,861
Retained Earnings ($52,805) $24,948 $63,199 $74,202 $55,238
$58,740
Total Equity ($24,445) $43,307 $86,966 $94,880 $87,402
$83,601
Total Liabilities & Owners'' Equity $156,477 $105,297
$178,778 $195,844 $183,054 $170,814
Income Statement Survey Andrews Baldwin Chester Digby Erie
Ferris
Sales $74,279 $108,140 $197,794 $226,989 $163,657 $200,781
Variable Costs(Labor,Material,Carry) $74,429 $87,869
$129,174 $152,226 $107,941 $141,109
Depreciation $7,227 $7,587 $10,887 $11,393 $12,687 $9,600
SGA(R&D,Promo,Sales,Admin) $6,233 $8,992 $18,602 $23,338
$14,297 $20,600
Other(Fees,Writeoffs,TQM,Bonuses) $0 $0 $612 $840 $1,700
$648
EBIT ($13,610) $3,692 $38,518 $39,192 $27,033 $28,824
Interest(Short term,Long term) $30,951 $7,735 $10,167 $11,057
$11,092 $9,510
Taxes ($15,596) ($1,415) $9,923 $9,847 $5,580 $6,760
Profit Sharing $0 $0 $369 $366 $207 $251
Net Profit ($28,964) ($2,628) $18,060 $17,922 $10,155 $12,303
CAPSTONE® COURIER Page 3
Production Analysis C58538 Round: 4Dec. 31, 2017
Name
Primary
Segment
Units
Sold
Unit
Inven
tory Revision Date
Age
Dec.31 MTBF
Pfmn
Coord
Size
Coord Price
Material
Cost
Labor
Cost
Contr.
Marg.
2nd
Shift
&
Over-
time
Auto
mation
Next
Round
Capacity
Next
Round
Plant
Utiliz.
Able Trad 1,085 3,357 10/4/2016 3.1 17000 6.4 13.5 $23.50
$9.02 $9.02 -14% 0% 4.0 1,800 52%
Acre Low 1,355 1,416 11/5/2016 3.4 16000 3.8 17.0 $17.40
$6.24 $7.73 4% 0% 5.0 1,400 99%
Adam High 206 416 11/21/2016 2.6 22000 9.6 8.9 $33.00
$13.76 $10.31 7% 0% 3.0 900 28%
Aft Pfmn 347 0 10/15/2016 2.5 27000 11.4 14.6 $29.90 $14.16
$11.01 15% 17% 3.0 300 116%
Agape Size 278 436 7/30/2016 3.1 19000 5.4 8.6 $29.00 $11.76
$10.31 7% 0% 3.0 600 46%
Baker Trad 1,795 645 12/23/2016 2.6 17500 6.5 12.8 $25.00
$9.51 $9.02 22% 0% 4.0 1,800 99%
Bead Low 2,241 479 5/25/2009 8.6 14000 3.0 17.0 $18.50 $5.27
$9.39 17% 82% 5.0 1,400 180%
Bid High 141 916 6/9/2016 3.1 22000 9.9 10.0 $36.50 $13.41
$10.31 -17% 0% 3.0 900 61%
Bold Pfmn 237 27 7/16/2016 2.9 26000 11.4 15.1 $33.00 $13.76
$10.31 25% 0% 3.0 600 41%
Buddy Size 268 416 5/4/2017 2.3 19000 5.4 8.6 $33.00 $11.76
$10.31 22% 0% 3.0 600 74%
Cake Trad 1,872 14 9/14/2017 1.4 14000 7.8 12.2 $26.00 $9.23
$7.65 35% 65% 6.0 1,000 163%
Cedar Low 2,426 394 1/29/2014 8.6 12000 3.0 17.0 $19.00
$4.67 $4.32 49% 32% 8.0 1,850 131%
Cid High 1,033 112 11/15/2017 1.1 23000 12.5 7.5 $37.00
$15.81 $11.01 28% 17% 3.0 900 116%
Coat Pfmn 907 104 9/21/2017 1.4 27000 13.4 13.2 $32.00
$15.55 $8.60 23% 6% 4.5 950 105%
Cure Size 1,118 119 9/21/2017 1.3 17000 6.8 6.6 $32.00 $12.55
$9.24 31% 28% 4.5 1,000 127%
Daze Trad 1,898 70 9/18/2017 1.4 18700 8.2 11.9 $28.50 $10.93
$8.48 32% 70% 5.5 1,050 168%
Dell Low 1,961 361 6/19/2019 8.6 14000 3.0 17.0 $21.00 $5.27
$4.69 48% 9% 7.5 1,600 108%
Dixie High 967 207 1/1/2018 2.1 24500 11.3 8.7 $38.50 $15.27
$10.78 30% 11% 3.0 950 109%
Dot Pfmn 834 104 10/6/2017 1.3 27000 13.8 12.8 $33.50 $15.85
$9.02 25% 0% 4.0 1,000 94%
Dune Size 1,241 159 10/6/2017 1.3 19000 7.2 6.4 $33.50 $13.35
$10.18 29% 37% 4.0 1,150 135%
Doom Pfmn 746 39 8/31/2017 0.9 27000 13.7 12.9 $33.50
$15.78 $7.47 30% 50% 6.0 650 149%
Eat Low 1,226 210 1/15/2017 4.1 13500 5.5 14.5 $20.50 $7.19
$4.51 37% 0% 8.0 1,400 74%
Ebb Low 2,763 252 6/18/2019 8.6 12000 3.0 17.0 $18.50 $4.67
$5.24 43% 51% 8.0 1,750 150%
Echo Trad 2,174 0 9/14/2017 1.3 15000 7.8 12.2 $26.00 $9.53
$7.94 33% 95% 6.5 1,150 193%
Egg Trad 1,188 0 7/21/2017 1.7 16000 7.8 12.2 $26.00 $9.83
$11.17 19% 100% 5.0 1,300 198%
Fast Low 675 85 1/29/2017 4.1 12000 5.5 14.5 $21.00 $6.74
$9.73 17% 20% 4.0 500 119%
Feat Low 1,796 135 7/27/2018 8.6 13000 3.0 17.0 $21.00 $4.97
$7.70 38% 70% 6.0 1,150 168%
Fist High 1,311 156 12/26/2017 1.1 25000 12.5 7.5 $38.00
$16.41 $12.12 26% 59% 3.0 850 157%
Foam Pfmn 876 101 10/7/2017 1.3 27000 13.8 12.8 $33.00
$15.85 $8.61 25% 6% 5.0 850 105%
Fume Size 977 168 11/23/2017 1.2 17000 6.8 6.0 $33.00 $12.87
$9.66 32% 18% 5.0 950 116%
Fox High 998 0 12/22/2017 0.8 25000 13.0 7.0 $38.00 $16.82
$8.77 34% 100% 5.5 1,300 198%
CAPSTONE® COURIER Page 4
Traditional Segment Analysis C58538 Round: 4Dec. 31, 2017
Traditional Statistics
Total Industry Unit Demand 10,504
Actual Industry Unit Sales 10,504
Segment % of Total Industry 28.4%
Next Year's Segment Growth Rate 9.2%
Traditional Customer Buying Criteria
Expectations Importance
1. Age Ideal Age = 2.0 47%
2. Price $18.00 - 28.00 23%
3. Ideal Position Pfmn 7.8 Size 12.2 21%
4. Reliability MTBF 14000-19000 9%
Top Products in Traditional Segment
Name
Market
Share
Units
Sold to
Seg
Revision
Date
Stock
Out
Pfmn
Coord
Size
Coord
List
Price MTBF
Age
Dec.31
Promo
Budget
Cust.
Aware-
ness
Sales
Budget
Cust.
Access-
ibility
Dec.
Cust.
Survey
Echo 21% 2,173 9/14/2017 YES 7.8 12.2 $26.00 15000
1.33 $1,350 76% $1,056 77% 34
Daze 18% 1,896 9/18/2017 8.2 11.9 $28.50 18700 1.44
$1,225 77% $1,670 51% 30
Cake 18% 1,871 9/14/2017 7.8 12.2 $26.00 14000 1.45
$1,150 71% $1,675 50% 30
Baker 17% 1,765 12/23/2016 6.5 12.8 $25.00 17500 2.56
$1,000 63% $1,000 32% 24
Egg 11% 1,188 7/21/2017 YES 7.8 12.2 $26.00 16000 1.70
$1,350 76% $1,056 77% 44
Able 9% 988 10/4/2016 6.4 13.5 $23.50 17000 3.05 $500
31% $500 20% 10
Eat 4% 447 1/15/2017 5.5 14.5 $20.50 13500 4.09 $1,350
79% $1,056 77% 3
Fast 2% 176 1/29/2017 5.5 14.5 $21.00 12000 4.08 $900
57% $710 27% 1
CAPSTONE® COURIER Page 5
Low End Segment Analysis C58538 Round: 4Dec. 31, 2017
Low End Statistics
Total Industry Unit Demand 13,949
Actual Industry Unit Sales 13,949
Segment % of Total Industry 37.8%
Next Year's Segment Growth Rate 11.7%
Low End Customer Buying Criteria
Expectations Importance
1. Price $13.00 - 23.00 53%
2. Age Ideal Age = 7.0 24%
3. Ideal Position Pfmn 3.7 Size 16.3 16%
4. Reliability MTBF 12000-17000 7%
Top Products in Low End Segment
Name
Market
Share
Units
Sold to
Seg
Revision
Date
Stock
Out
Pfmn
Coord
Size
Coord
List
Price MTBF
Age
Dec.31
Promo
Budget
Cust.
Aware-
ness
Sales
Budget
Cust.
Access-
ibility
Dec.
Cust.
Survey
Ebb 20% 2,763 6/18/2019 3.0 17.0 $18.50 12000 8.60
$1,350 78% $1,056 56% 23
Cedar 17% 2,426 1/29/2014 3.0 17.0 $19.00 12000 8.60
$1,150 70% $1,758 50% 20
Bead 16% 2,241 5/25/2009 3.0 17.0 $18.50 14000 8.60
$900 56% $1,000 34% 19
Dell 14% 1,961 6/19/2019 3.0 17.0 $21.00 14000 8.60
$1,225 76% $1,753 50% 16
Feat 13% 1,796 7/27/2018 3.0 17.0 $21.00 13000 8.60
$1,100 70% $1,278 53% 14
Acre 10% 1,355 11/5/2016 3.8 17.0 $17.40 16000 3.41
$500 30% $500 17% 13
Eat 6% 780 1/15/2017 5.5 14.5 $20.50 13500 4.09 $1,350
79% $1,056 56% 9
Fast 4% 499 1/29/2017 5.5 14.5 $21.00 12000 4.08 $900
57% $710 53% 6
Able 1% 97 10/4/2016 6.4 13.5 $23.50 17000 3.05 $500
31% $500 17% 1
Baker 0% 30 12/23/2016 6.5 12.8 $25.00 17500 2.56
$1,000 63% $1,000 34% 0
CAPSTONE® COURIER Page 6
High End Segment Analysis C58538 Round: 4Dec. 31, 2017
High End Statistics
Total Industry Unit Demand 4,656
Actual Industry Unit Sales 4,656
Segment % of Total Industry 12.6%
Next Year's Segment Growth Rate 16.2%
High End Customer Buying Criteria
Expectations Importance
1. Ideal Position Pfmn 12.5 Size 7.5 43%
2. Age Ideal Age = 0.0 29%
3. Reliability MTBF 20000-25000 19%
4. Price $28.00 - 38.00 9%
Top Products in High End Segment
Name
Market
Share
Units
Sold to
Seg
Revision
Date
Stock
Out
Pfmn
Coord
Size
Coord
List
Price MTBF
Age
Dec.31
Promo
Budget
Cust.
Aware-
ness
Sales
Budget
Cust.
Access-
ibility
Dec.
Cust.
Survey
Fist 28% 1,311 12/26/2017 12.5 7.5 $38.00 25000 1.06
$1,300 74% $1,278 67% 52
Cid 22% 1,033 11/15/2017 12.5 7.5 $37.00 23000 1.13
$1,100 65% $1,758 50% 38
Fox 21% 998 12/22/2017 YES 13.0 7.0 $38.00 25000 0.78
$1,300 58% $1,278 67% 41
Dixie 21% 967 1/1/2018 11.3 8.7 $38.50 24500 2.15 $1,250
77% $1,753 52% 19
Adam 4% 203 11/21/2016 9.6 8.9 $33.00 22000 2.63 $600
35% $660 19% 4
Bid 3% 141 6/9/2016 9.9 10.0 $36.50 22000 3.14 $1,000
60% $700 20% 3
Daze 0% 3 9/18/2017 8.2 11.9 $28.50 18700 1.44 $1,225
77% $1,670 52% 0
CAPSTONE® COURIER Page 7
Performance Segment Analysis C58538 Round: 4Dec. 31, 2017
Performance Statistics
Total Industry Unit Demand 3,945
Actual Industry Unit Sales 3,945
Segment % of Total Industry 10.7%
Next Year's Segment Growth Rate 19.8%
Performance Customer Buying Criteria
Expectations Importance
1. Reliability MTBF 22000-27000 43%
2. Ideal Position Pfmn 13.4 Size 13.2 29%
3. Price $23.00 - 33.00 19%
4. Age Ideal Age = 1.0 9%
Top Products in Performance Segment
Name
Market
Share
Units
Sold to
Seg
Revision
Date
Stock
Out
Pfmn
Coord
Size
Coord
List
Price MTBF
Age
Dec.31
Promo
Budget
Cust.
Aware-
ness
Sales
Budget
Cust.
Access-
ibility
Dec.
Cust.
Survey
Coat 23% 907 9/21/2017 13.4 13.2 $32.00 27000 1.42
$1,100 64% $1,591 41% 41
Foam 22% 876 10/7/2017 13.8 12.8 $33.00 27000 1.30
$1,300 74% $1,278 35% 38
Dot 21% 834 10/6/2017 13.8 12.8 $33.50 27000 1.33
$1,200 74% $1,586 42% 37
Doom 19% 746 8/31/2017 13.7 12.9 $33.50 27000 0.86
$1,200 63% $0 42% 33
Aft 9% 347 10/15/2016 YES 11.4 14.6 $29.90 27000 2.54
$600 33% $600 15% 16
Bold 6% 237 7/16/2016 11.4 15.1 $33.00 26000 2.92 $300
24% $300 12% 8
CAPSTONE® COURIER Page 8
Size Segment Analysis C58538 Round: 4Dec. 31, 2017
Size Statistics
Total Industry Unit Demand 3,885
Actual Industry Unit Sales 3,885
Segment % of Total Industry 10.5%
Next Year's Segment Growth Rate 18.3%
Size Customer Buying Criteria
Expectations Importance
1. Ideal Position Pfmn 6.8 Size 6.6 43%
2. Age Ideal Age = 1.5 29%
3. Reliability MTBF 16000-21000 19%
4. Price $23.00 - 33.00 9%
Top Products in Size Segment
Name
Market
Share
Units
Sold to
Seg
Revision
Date
Stock
Out
Pfmn
Coord
Size
Coord
List
Price MTBF
Age
Dec.31
Promo
Budget
Cust.
Aware-
ness
Sales
Budget
Cust.
Access-
ibility
Dec.
Cust.
Survey
Dune 32% 1,241 10/6/2017 7.2 6.4 $33.50 19000 1.29
$1,200 74% $1,586 44% 37
Cure 29% 1,118 9/21/2017 6.8 6.6 $32.00 17000 1.35
$1,150 66% $1,591 43% 37
Fume 25% 977 11/23/2017 6.8 6.0 $33.00 17000 1.18
$1,300 74% $1,278 37% 30
Agape 7% 278 7/30/2016 5.4 8.6 $29.00 19000 3.09 $600
32% $600 19% 5
Buddy 7% 268 5/4/2017 5.4 8.6 $33.00 19000 2.29 $800
45% $800 22% 8
Adam 0% 2 11/21/2016 9.6 8.9 $33.00 22000 2.63 $600
35% $660 19% 0
CAPSTONE® COURIER Page 9
Market Share C58538 Round: 4Dec. 31, 2017
Actual Market Share in Units Potential Market Share in Units
Trad Low High Pfmn Size Total Trad Low High Pfmn Size
Total
Industry Unit Sales 10,504 13,949 4,656 3,945 3,885 36,939
Units Demanded 10,504 13,949 4,656 3,945 3,885 36,939
% of Market 28.4% 37.8% 12.6% 10.7% 10.5% 100.0% % of
Market 28.4% 37.8% 12.6% 10.7% 10.5% 100.0%
Able 9.4% 0.7% 2.9% Able 8.4% 0.7% 2.7%
Acre 9.7% 3.7% Acre 9.7% 3.7%
Adam 4.4% 0.6% Adam 3.9% 0.5%
Aft 8.8% 0.9% Aft 11.2% 1.2%
Agape 7.1% 0.7% Agape 7.1% 0.8%
Total 9.4% 10.4% 4.4% 8.8% 7.2% 8.8% Total 8.4% 10.4%
3.9% 11.2% 7.2% 8.8%
Baker 16.8% 0.2% 4.9% Baker 14.9% 0.2% 4.3%
Bead 16.1% 6.1% Bead 16.1% 6.1%
Bid 3.0% 0.4% Bid 2.7% 0.3%
Bold 6.0% 0.6% Bold 5.8% 0.6%
Buddy 6.9% 0.7% Buddy 6.9% 0.7%
Total 16.8% 16.3% 3.0% 6.0% 6.9% 12.7% Total 14.9% 16.3%
2.7% 5.8% 6.9% 12.1%
Cake 17.8% 5.1% Cake 15.9% 4.5%
Cedar 17.4% 6.6% Cedar 17.4% 6.6%
Cid 22.2% 2.8% Cid 19.7% 2.5%
Coat 23.0% 2.5% Coat 22.4% 2.4%
Cure 28.8% 3.0% Cure 28.8% 3.0%
Total 17.8% 17.4% 22.2% 23.0% 28.8% 19.9% Total 15.9%
17.4% 19.7% 22.4% 28.8% 19.0%
Daze 18.0% 5.1% Daze 16.1% 4.6%
Dell 14.1% 5.3% Dell 14.1% 5.3%
Dixie 20.8% 2.6% Dixie 18.4% 2.3%
Dot 21.1% 2.3% Dot 20.6% 2.2%
Dune 31.9% 3.4% Dune 31.9% 3.4%
Doom 18.9% 2.0% Doom 18.4% 2.0%
Total 18.0% 14.1% 20.8% 40.0% 31.9% 20.7% Total 16.1%
14.1% 18.5% 39.0% 31.9% 19.7%
Eat 4.3% 5.6% 3.3% Eat 3.8% 5.6% 3.2%
Ebb 19.8% 7.5% Ebb 19.8% 7.5%
Echo 20.7% 5.9% Echo 18.6% 5.3%
Egg 11.3% 3.2% Egg 20.8% 5.9%
Total 36.2% 25.4% 19.9% Total 43.2% 25.4% 21.9%
Fast 1.7% 3.6% 1.8% Fast 1.5% 3.6% 1.8%
Feat 12.9% 4.9% Feat 12.9% 4.9%
Fist 28.2% 3.5% Fist 25.0% 3.2%
Foam 22.2% 2.4% Foam 21.6% 2.3%
Fume 25.2% 2.6% Fume 25.2% 2.6%
Fox 21.4% 2.7% Fox 30.2% 3.8%
Total 1.7% 16.5% 49.6% 22.2% 25.2% 18.0% Total 1.5% 16.5%
55.2% 21.6% 25.2% 18.5%
CAPSTONE® COURIER Page 10
Perceptual Map C58538 Round: 4Dec. 31, 2017
Andrews Baldwin Chester
Name Pfmn Size Revised Name Pfmn Size Revised Name Pfmn
Size Revised
Able 6.4 13.5 10/4/2016 Baker 6.5 12.8 12/23/2016 Cake
7.8 12.2 9/14/2017
Acre 3.8 17.0 11/5/2016 Bead 3.0 17.0 5/25/2009 Cedar
3.0 17.0 1/29/2014
Adam 9.6 8.9 11/21/2016 Bid 9.9 10.0 6/9/2016 Cid
12.5 7.5 11/15/2017
Aft 11.4 14.6 10/15/2016 Bold 11.4 15.1 7/16/2016 Coat
13.4 13.2 9/21/2017
Agape 5.4 8.6 7/30/2016 Buddy 5.4 8.6 5/4/2017 Cure
6.8 6.6 9/21/2017
Abum 6.0 15.0 4/17/2016
Ajoy 6.2 15.0 5/1/2016
Apps 5.9 15.0 4/19/2016
Digby Erie Ferris
Name Pfmn Size Revised Name Pfmn Size Revised Name Pfmn
Size Revised
Daze 8.2 11.9 9/18/2017 Eat 5.5 14.5 1/15/2017 Fast
5.5 14.5 1/29/2017
Dell 3.0 17.0 6/19/2019 Ebb 3.0 17.0 6/18/2019 Feat
3.0 17.0 7/27/2018
Dixie 11.3 8.7 1/1/2018 Echo 7.8 12.2 9/14/2017 Fist
12.5 7.5 12/26/2017
Dot 13.8 12.8 10/6/2017 Egg 7.8 12.2 7/21/2017 Foam
13.8 12.8 10/7/2017
Dune 7.2 6.4 10/6/2017 Fume 6.8 6.0 11/23/2017
Doom 13.7 12.9 8/31/2017 Fox 13.0 7.0 12/22/2017
CAPSTONE® COURIER Page 11
HR/TQM Report C58538 Round: 4Dec. 31, 2017
HUMAN RESOURCES SUMMARY
Andrews Baldwin Chester Digby Erie Ferris
Needed Complement 531 911 897 1,026 760 1,028
Complement 531 911 897 1,026 760 1,028
1st Shift Complement 521 745 700 813 463 720
2nd Shift Complement 10 166 197 213 297 308
Overtime Percent 0.0% 0.0% 0.0% 0.0% 0.0% 0.0%
Turnover Rate 10.0% 10.0% 10.0% 10.0% 10.0% 10.0%
New Employees 53 91 132 103 76 144
Separated Employees 0 0 0 11 228 0
Recruiting Spend $0 $0 $0 $0 $0 $0
Training Hours 0 0 0 0 0 0
Productivity Index 100.0% 100.0% 100.0% 100.0% 100.0%
100.0%
Recruiting Cost $53 $91 $132 $103 $76 $144
Separation Cost $0 $0 $0 $55 $1,140 $0
Training Cost $0 $0 $0 $0 $0 $0
Total HR Admin Cost $53 $91 $132 $158 $1,216 $144
Labor Contract Next Year
Wages $25.53 $25.53 $25.53 $25.53 $25.53 $25.53
Benefits 2,500 2,500 2,500 2,500 2,500 2,500
Profit Sharing 2.0% 2.0% 2.0% 2.0% 2.0% 2.0%
Annual Raise 5.0% 5.0% 5.0% 5.0% 5.0% 5.0%
Starting Negotiation Position
Wages
Benefits
Profit Sharing
Annual Raise
Ceiling Negotiation Position
Wages
Benefits
Profit Sharing
Annual Raise
Adjusted Labor Demands
Wages
Benefits
Profit Sharing
Annual Raise
Strike Days
TQM SUMMARY
Andrews Baldwin Chester Digby Erie Ferris
Process Mgt Budgets Last Year
CPI Systems $0 $0 $0 $0 $0 $0
Vendor/JIT $0 $0 $0 $0 $0 $0
Quality Initiative Training $0 $0 $0 $0 $0 $0
Channel Support Systems $0 $0 $0 $0 $0 $0
Concurrent Engineering $0 $0 $0 $0 $0 $0
UNEP Green Programs $0 $0 $0 $0 $0 $0
TQM Budgets Last Year
Benchmarking $0 $0 $0 $0 $0 $0
Quality Function Deployment Effort $0 $0 $0 $0 $0 $0
CCE/6 Sigma Training $0 $0 $0 $0 $0 $0
GEMI TQEM Sustainability Initiatives $0 $0 $0 $0 $0 $0
Total Expenditures $0 $0 $0 $0 $0 $0
Cumulative Impacts
Material Cost Reduction 0.00% 0.00% 0.00% 0.00% 0.00%
0.00%
Labor Cost Reduction 0.00% 0.00% 0.00% 0.00% 0.00% 0.00%
Reduction R&D Cycle Time 0.00% 0.00% 0.00% 0.00% 0.00%
0.00%
Reduction Admin Costs 0.00% 0.00% 0.00% 0.00% 0.00%
0.00%
Demand Increase 0.00% 0.00% 0.00% 0.00% 0.00% 0.00%
CAPSTONE® COURIER Page 12
Ethics Report C58538 Round: 4Dec. 31, 2017
ETHICS SUMMARY
Other (Fees, Writeoffs, etc.) The actual dollar impact. Example,
$120 means Other increased by $120.
Demand Factor The % of normal. 98% means demand fell 2%.
Material Cost Impact The % of normal. 104% means matieral
costs rose 4%.
Admin Cost Impact The % of normal. 103% means admin costs
rose 3%.
Productivity Impact The % of normal. 104% means productivity
increased by 4%.
Awareness Impact The % of normal. 105% means normal
awareness was multiplied by 1.05.
Accessibility Impact The % of normal. 98% means normal
accessiblity was multiplied by 0.98.
Normal means the value that would have been produced if the
problem had not been presented.
No Impact Andrews Baldwin Chester Digby Erie Ferris
Total
Other (Fees, Writeoffs, etc.) $0 $0 $0 $0 $0 $0 $0
Demand Factor 100% 100% 100% 100% 100% 100% 100%
Material Cost Impact 100% 100% 100% 100% 100% 100%
100%
Admin Cost Impact 100% 100% 100% 100% 100% 100% 100%
Productivity Impact 100% 100% 100% 100% 100% 100% 100%
Awareness Impact 100% 100% 100% 100% 100% 100% 100%
Accessibility Impact 100% 100% 100% 100% 100% 100% 100%
CAPSTONE® COURIER Page 13
Annual Report
Annual Report Andrews C58538 Round: 4Dec. 31, 2017
Balance Sheet
DEFINITIONS:
Common Size: The common size
column simply represents each item as a
percentage of total assets for that year.
Cash: Your end-of-year cash position.
Accounts Receivable: Reflects the lag
between delivery and payment of your
products. Inventories: The current
value of your inventory across all products. A
zero indicates your company stocked out.
Unmet demand would, of course, fall to your
competitors. Plant & Equipment: The
current value of your plant. Accum
Deprec: The total accumulated
depreciation from your plant. Accts
Payable: What the company currently
owes suppliers for materials and services.
Current Debt: The debt the company
is obligated to pay during the next year of
operations. It includes emergency loans used
to keep your company solvent should you run
out of cash during the year. Long
Term Debt: The company's
long term debt is in the form of bonds, and this
represents the total value of your bonds.
Common Stock: The amount of
capital invested by shareholders in the
company. Retained Earnings:
The profits that the company chose to keep
instead of paying to shareholders as dividends.
ASSETS 2017
Common
Size
2016
Cash $0 0.0% $0
Account Receivable $6,105 3.9% $5,750
Inventory $107,012 68.4% $110,681
Total Current Assets $113,117 72.3% $116,431
Plant & Equipment $108,400 69.3% $108,400
Accumulated Depreciation ($65,040) -41.6% ($57,813)
Total Fixed Assets $43,360 27.7% $50,587
Total Assets $156,477 100.0% $167,018
LIABILITIES & OWNER'S
EQUITY
Accounts Payable $4,760 3.0% $4,931
Current Debt $155,312 99.3% $125,793
Long Term Debt $20,850 13.3% $31,775
Total Liabilities $180,922 116.0% $162,499
Common Stock $28,360 18.1% $28,360
Retained Earnings ($52,805) -33.7% ($23,841)
Total Equity ($24,445) -15.6% $4,519
Total Liab. & O. Equity $156,477 100.0% $167,018
Cash Flow Statement
The Cash Flow Statement examines what happened in the Cash
Account during the year. Cash injections appear as positive
numbers and
cash withdrawals as negative numbers. The Cash Flow
Statement is an
excellent tool for diagnosing emergency loans. When negative
cash flows
exceed positives, you are forced to seek emergency funding. For
example,
if sales are bad and you find yourself carrying an abundance of
excess
inventory, the report would show the increase in inventory as a
huge
negative cash flow. Too much unexpected inventory could
outstrip your
inflows, exhaust your starting cash and force you to beg for
money to keep
your company afloat.
Cash Flows from Operating Activities 2017 2016
NetIncome(Loss) ($28,964) ($32,474)
Depreciation $7,227 $7,227
Extraordinary gains/losses/writeoffs $0 $0
Accounts Payable ($171) ($6,042)
Inventory $3,669 ($1,387)
Accounts Receivable ($355) ($2,261)
Net cash from operation ($18,594) ($34,937)
Cash Flows from Investing Activities
Plant Improvements $0 $0
Cash Flows from Financing Activities
Dividends Paid $0 $0
Sales of Common Stock $0 $0
Purchase of Common Stock $0 $0
Cash from long term debt $0 $0
Retirement of long term debt ($10,925) $0
Change in current debt(net) $29,518 $34,937
Net Cash from financing activities $18,594 $34,937
Net Change in cash position $0 $0
Closing cash position $0 $0
Annual Report Page 14
Annual Report Andrews C58538 Round: 4Dec. 31, 2017
2017 Income Statement
(Product Name) Able Acre Adam Aft Agape Abum Ajoy Apps
2017
Total
Common
Size
Sales $25,501 $23,581 $6,782 $10,362 $8,054 $0 $0 $0 $74,279
100.0%
Variable Costs:
Direct Labor $9,677 $10,444 $2,023 $3,815 $2,827 $0 $0 $0
$28,786 38.8%
Direct Material $11,609 $9,662 $3,026 $5,003 $3,502 $0 $0 $0
$32,802 44.2%
Inventory Carry $7,902 $2,521 $1,227 $0 $1,192 $0 $0 $0
$12,841 17.3%
Total Variable $29,188 $22,627 $6,276 $8,817 $7,520 $0 $0 $0
$74,429 100.2%
Contribution Margin ($3,688) $954 $506 $1,545 $533 $0 $0 $0
($150) -0.2%
Period Costs:
Depreciation $2,640 $2,427 $1,080 $360 $720 $0 $0 $0 $7,227
9.7%
SG&A: R&D $0 $0 $0 $0 $0 $0 $0 $0 $0 0.0%
Promotions $500 $500 $600 $600 $600 $0 $0 $0 $2,800 3.8%
Sales $500 $500 $660 $600 $600 $0 $0 $0 $2,860 3.9%
Admin $197 $182 $52 $80 $62 $0 $0 $0 $573 0.8%
Total Period $3,837 $3,609 $2,392 $1,640 $1,982 $0 $0 $0
$13,460 18.1%
Net Margin ($7,524) ($2,655) ($1,886) ($95) ($1,449) $0 $0 $0
($13,610) -18.3%
Definitions: Sales: Unit Sales times list price. Direct Labor:
Labor costs incurred to produce the
product that was sold. Inventory Carry Cost: the cost unsold
goods in inventory. Depreciation:
Calculated on straight-line. 15-year depreciation of plant value.
R&D Costs: R&D department
expenditures for each product. Admin: Administration overhead
is estimated at 1.5% of sales.
Promotions: The promotion budget for each product. Sales: The
sales force budget for each
product. Other: Chargs not included in other categories such as
Fees, Write offs, and TQM. The fees
include money paid to investment bankers and brokerage firms
to issue new stocks or bonds plus consulting
fees your instructor might assess. Write-offs include the loss
you might experience when you sell capacity or
liquidate inventory as the result of eliminating a production
line. If the amount appears as a negative amount,
then you actually made money on the liquidation of capacity or
inventory. EBIT: Earnings Before Interest
and Taxes. Short Term Interest: Interest expense based on last
year''s current debt, including short term
debt, long term notes that have become due, and emergency
loans, Long Term Interest: Interest paid on
outstanding bonds. Taxes: Income tax based upon a 35% tax
rate. Profit Sharing: Profits shared
with employees under the labor contract. Net Profit: EBIT
minus interest, taxes, and profit sharing.
Other $0 0.0%
EBIT ($13,610) -18.3%
Short Term Interest $28,032 37.7%
Long Term Interest $2,919 3.9%
Taxes ($15,596) -21.0%
Profit Sharing $0 0.0%
Net Profit ($28,964) -39.0%
Annual Report Page 15
C58538Front PageStock & BondsFinancial SummaryProduction
AnalysisTraditional Segment AnalysisLow End Segment
AnalysisHigh End Segment AnalysisPerformance Segment
AnalysisSize Segment AnalysisMarket SharePerceptual
MapHR/TQM ReportEthics ReportAnnual
ReportAndrewsBalance SheetIncome Statement
Round: 3
Dec. 31, 2016 C58538
Andrews
Eugene Ellis
Philip Mull
Baldwin
Lisa Chastain
Monica Dalke
matt rix
Chester
Digby Erie Ferris
Selected Financial Statistics
Andrews Baldwin Chester Digby Erie Ferris
ROS -46.4% -3.3% 5.2% 5.2% 4.1% 5.9%
Asset Turnover 0.42 1.02 1.02 1.13
1.07 1.39
ROA -19.4% -3.4% 5.3% 5.8% 4.4% 8.2%
Leverage
(Assets/Equity)
37.0 2.0 2.1 2.1 2.1
2.0
ROE -718.6% -7.0% 10.9% 12.0% 9.0% 16.7%
Emergency Loan $125,793,089 $4,945,006 $0 $0 $0 $0
Sales $69,961,561 $96,089,579 $159,532,219 $185,644,482
$154,127,338 $185,494,213
EBIT ($23,116,007) $566,964 $21,655,955 $23,974,920
$17,892,517 $24,157,919
Profits ($32,473,914) ($3,194,122) $8,267,684 $9,578,890
$6,247,090 $10,939,194
Cumulative Profit ($48,179,912) $2,182,017 $29,677,316
$33,677,169 $25,121,802 $33,006,630
SG&A / Sales 20.0% 12.1% 10.9% 11.2% 7.5% 10.7%
Contrib. Margin % -2.8% 20.6% 31.6% 29.8% 26.3% 27.8%
CAPSTONE® COURIER Page 1
Stock & Bonds C58538 Round: 3Dec. 31, 2016
Stock Market Summary
Company Close Change Shares
MarketCap
($M)
Book Value EPS Dividend Yield P/E
Andrews $1.00 $0.00 2,291,939 $2 $1.97 ($14.17) $0.00 0.0%
-0.0
Baldwin $12.57 ($11.61) 2,000,000 $25 $22.97 ($1.60) $0.00
0.0% -7.9
Chester $60.54 $5.40 2,124,345 $129 $35.80 $3.89 $0.00 0.0%
15.6
Digby $64.91 $5.20 2,053,924 $133 $38.83 $4.66 $0.00 0.0%
13.9
Erie $51.59 $2.17 2,152,363 $111 $32.07 $2.90 $0.00 0.0%
17.8
Ferris $61.28 $5.40 2,013,135 $123 $32.55 $5.43 $0.00 0.0%
11.3
Bond Market Summary
Company Series# Face Yield Close$ S&P Company Series#
Face Yield Close$ S&P
Andrews Digby
12.5S2017 $10,924,506 12.8% 98.00 DDD 12.5S2017
$13,828,904 12.5% 99.65 B
14.0S2019 $20,850,000 14.3% 98.17 DDD 14.0S2019
$20,850,000 13.6% 102.60 B
Baldwin 11.6S2025 $3,523,690 12.4% 93.30 B
12.5S2017 $13,900,000 12.5% 99.65 B 12.2S2026 $8,623,471
12.7% 96.19 B
14.0S2019 $20,850,000 13.6% 102.60 B Erie
Chester 12.5S2017 $13,900,000 12.6% 99.56 CCC
12.5S2017 $13,900,000 12.5% 99.65 B 14.0S2019 $20,850,000
13.7% 102.36 CCC
14.0S2019 $20,850,000 13.6% 102.60 B 11.7S2025 $1,722,021
12.5% 93.33 CCC
12.1S2026 $13,308,235 12.7% 95.64 B 12.3S2026 $11,199,852
12.8% 96.20 CCC
Ferris
12.5S2017 $4,616,365 12.5% 99.65 B
14.0S2019 $20,850,000 13.6% 102.60 B
12.2S2026 $8,738,656 12.7% 96.19 B
Next Year's Prime Rate 8.50%
CAPSTONE® COURIER Page 2
Financial Summary C58538 Round: 3Dec. 31, 2016
Cash Flow Statement Survey Andrews Baldwin Chester Digby
Erie Ferris
CashFlows from operating activities
Net Income(Loss) ($32,474) ($3,194) $8,268 $9,579 $6,247
$10,939
Adjustment for non-cash items:
Depreciation $7,227 $7,587 $10,567 $10,560 $10,540 $7,660
Extraordinary gains/losses/writeoffs $0 $0 $0 ($340) ($2)
($513)
Changes in current assets and liablilities
Acounts payable ($6,042) ($6,220) $63 $1,805 $2,966 $2,835
Inventory ($1,387) ($26,452) ($6,969) ($10,581) ($8,415)
($2,646)
Accounts Receivable ($2,261) $8,859 $77 ($1,732) ($2,251)
($3,580)
Net cash from operations ($34,937) ($19,421) $12,006 $9,291
$9,086 $14,695
Cash flows from investing activities
Plant improvements(net) $0 $0 ($42,900) ($30,420) ($34,288)
($26,640)
Cash flows from financing activities
Dividends paid $0 $0 $0 $0 $0 $0
Sales of common stock $0 $0 $3,031 $207 $1,200 $734
Purchase of common stock $0 $0 $0 $0 $0 $0
Cash from long term debt issued $0 $0 $13,308 $8,623 $11,200
$8,739
Early retirement of long term debt $0 $0 $0 $0 $0 $0
Retirement of current debt ($90,856) ($6,950) ($17,989)
($20,549) ($19,677) ($19,431)
Cash from current debt borrowing $0 $0 $22,524 $26,194
$16,972 $22,433
Cash from emergency loan $125,793 $4,945 $0 $0 $0 $0
Net cash from financing activities $34,937 ($2,005) $20,875
$14,476 $9,695 $12,475
Net change in cash position $0 ($21,426) ($10,020) ($6,653)
($15,508) $530
Balance Sheet Survey Andrews Baldwin Chester Digby Erie
Ferris
Cash $0 $0 $23,206 $22,040 $16,812 $27,649
Accounts Receivable $5,750 $7,898 $13,112 $15,258 $12,668
$15,246
Inventory $110,681 $32,748 $16,613 $22,531 $13,446 $13,931
Total Current Assets $116,431 $40,646 $52,932 $59,829
$42,926 $56,826
Plant and equipment $108,400 $113,800 $158,500 $158,400
$158,100 $114,900
Accumulated Depreciation ($57,813) ($60,693) ($55,420)
($54,107) ($57,460) ($38,473)
Total Fixed Assets $50,587 $53,107 $103,080 $104,293
$100,640 $76,427
Total Assets $167,018 $93,753 $156,012 $164,123 $143,566
$133,253
Account Payable $4,931 $8,122 $9,382 $11,353 $9,892 $11,085
CurrentDebt $125,793 $4,945 $22,524 $26,194 $16,972 $22,433
Long Term Debt $31,775 $34,750 $48,058 $46,826 $47,672
$34,205
Total Liabilities $162,499 $47,818 $79,964 $84,373 $74,536
$67,723
Common Stock $28,360 $18,360 $23,767 $20,678 $23,947
$19,094
Retained Earnings ($23,841) $27,576 $52,281 $59,071 $45,083
$46,436
Total Equity $4,519 $45,935 $76,048 $79,749 $69,030 $65,530
Total Liabilities & Owners'' Equity $167,018 $93,753 $156,012
$164,123 $143,566 $133,253
Income Statement Survey Andrews Baldwin Chester Digby Erie
Ferris
Sales $69,962 $96,090 $159,532 $185,644 $154,127 $185,494
Variable Costs(Labor,Material,Carry) $71,890 $76,301
$109,170 $130,251 $113,557 $133,891
Depreciation $7,227 $7,587 $10,567 $10,560 $10,540 $7,660
SGA(R&D,Promo,Sales,Admin) $13,961 $11,635 $17,323
$20,757 $11,520 $19,825
Other(Fees,Writeoffs,TQM,Bonuses) $0 $0 $817 $102 $618
($40)
EBIT ($23,116) $567 $21,656 $23,975 $17,893 $24,158
Interest(Short term,Long term) $26,844 $5,481 $8,677 $8,937
$8,085 $6,985
Taxes ($17,486) ($1,720) $4,543 $5,263 $3,432 $6,011
Profit Sharing $0 $0 $169 $195 $127 $223
Net Profit ($32,474) ($3,194) $8,268 $9,579 $6,247 $10,939
CAPSTONE® COURIER Page 3
Production Analysis C58538 Round: 3Dec. 31, 2016
Name
Primary
Segment
Units
Sold
Unit
Inven
tory Revision Date
Age
Dec.31 MTBF
Pfmn
Coord
Size
Coord Price
Material
Cost
Labor
Cost
Contr.
Marg.
2nd
Shift
&
Over-
time
Auto
mation
Next
Round
Capacity
Next
Round
Plant
Utiliz.
Able Trad 815 3,501 10/4/2016 2.1 17000 6.4 13.5 $23.50 $9.75
$8.61 -29% 0% 4.0 1,800 52%
Acre Low 1,160 1,385 11/5/2016 2.4 16000 3.8 17.0 $17.40
$6.78 $7.38 -2% 0% 5.0 1,400 99%
Adam High 284 374 11/21/2016 1.6 22000 9.6 8.9 $33.00
$14.72 $9.84 13% 0% 3.0 900 28%
Aft Pfmn 355 0 10/15/2016 1.5 27000 11.4 14.6 $29.90 $15.00
$10.51 16% 17% 3.0 300 116%
Agape Size 368 436 7/30/2016 2.1 19000 5.4 8.6 $29.00 $12.60
$9.84 9% 0% 3.0 600 46%
Baker Trad 1,125 657 12/23/2016 1.6 17500 6.5 12.8 $25.00
$10.26 $8.61 22% 0% 4.0 1,800 99%
Bead Low 2,330 195 5/25/2009 7.6 14000 3.0 17.0 $18.50 $5.79
$8.96 18% 82% 5.0 1,400 180%
Bid High 254 513 6/9/2016 2.1 22000 9.9 10.0 $36.50 $14.34
$9.84 18% 0% 3.0 900 61%
Bold Pfmn 266 16 7/16/2016 1.9 26000 11.4 15.1 $33.00 $14.59
$9.84 26% 0% 3.0 600 41%
Buddy Size 207 239 5/4/2017 2.9 19000 4.7 10.8 $33.00 $11.16
$9.84 27% 0% 3.0 600 74%
Cake Trad 1,357 252 8/26/2016 1.6 14000 7.1 12.9 $26.00 $9.42
$7.76 32% 45% 6.0 1,000 144%
Cedar Low 2,378 394 1/29/2014 7.6 12000 3.0 17.0 $19.00
$5.19 $5.33 42% 100% 8.0 1,850 198%
Cid High 700 106 12/17/2016 1.1 23000 11.4 8.6 $37.00 $15.92
$10.20 29% 8% 3.0 900 107%
Coat Pfmn 844 120 5/1/2016 1.6 27000 12.4 13.9 $32.00 $15.75
$10.12 17% 58% 4.5 850 157%
Cure Size 818 99 9/11/2016 1.4 17000 6.1 7.6 $32.00 $12.75
$9.81 29% 42% 4.5 900 140%
Daze Trad 1,514 285 8/21/2016 1.6 18400 7.5 12.6 $28.50
$11.05 $8.76 30% 65% 5.5 1,000 163%
Dell Low 1,984 590 5/25/2009 7.6 14000 3.0 17.0 $21.00 $5.79
$6.00 41% 86% 7.5 1,600 184%
Dixie High 846 134 12/2/2016 1.1 24500 11.3 8.7 $38.50
$16.29 $10.71 30% 23% 3.0 950 122%
Dot Pfmn 834 96 8/2/2016 1.4 27000 12.8 13.5 $33.50 $16.08
$11.14 18% 38% 4.0 900 137%
Dune Size 998 112 10/16/2016 1.3 19000 6.5 7.4 $33.50 $13.56
$11.24 26% 43% 4.0 950 141%
Doom Pfmn 206 42 8/8/2016 0.4 27000 13.0 13.4 $33.50 $16.22
$6.81 29% 29% 6.0 500 50%
Eat Trad 1,752 396 1/15/2016 3.1 14500 5.5 14.5 $21.00 $8.15
$5.66 30% 46% 7.5 1,400 145%
Ebb Low 2,381 391 1/15/2015 7.6 12000 3.0 17.0 $19.00 $5.19
$7.61 30% 100% 7.5 1,750 198%
Echo Trad 1,441 144 8/20/2016 1.4 15000 7.1 12.9 $26.50 $9.72
$8.85 28% 72% 6.0 1,050 171%
Egg Trad 1,280 0 5/18/2016 2.0 16000 7.1 12.9 $26.50 $10.02
$12.18 15% 100% 4.0 600 198%
Fast Trad 1,243 167 4/22/2015 3.1 14000 5.5 14.5 $21.50 $8.00
$10.66 10% 100% 4.0 600 198%
Feat Low 1,386 0 7/27/2018 7.6 13000 3.0 17.0 $21.50 $5.49
$7.61 38% 100% 6.0 1,150 198%
Fist High 927 130 12/13/2016 1.1 25000 11.3 8.6 $38.50 $16.48
$11.40 28% 50% 3.0 850 149%
Foam Pfmn 788 135 9/18/2016 1.4 27000 12.8 13.5 $33.40
$16.08 $9.97 21% 50% 4.5 800 149%
Fume Size 870 155 12/11/2016 1.3 16000 6.1 7.2 $33.50 $12.68
$10.12 30% 58% 4.0 850 157%
Fox High 983 8 12/11/2016 0.5 25000 12.0 8.0 $38.50 $17.05
$8.37 35% 100% 5.5 500 198%
CAPSTONE® COURIER Page 4
Traditional Segment Analysis C58538 Round: 3Dec. 31, 2016
Traditional Statistics
Total Industry Unit Demand 9,619
Actual Industry Unit Sales 9,619
Segment % of Total Industry 29.4%
Next Year's Segment Growth Rate 9.2%
Traditional Customer Buying Criteria
Expectations Importance
1. Age Ideal Age = 2.0 47%
2. Price $18.50 - 28.50 23%
3. Ideal Position Pfmn 7.1 Size 12.9 21%
4. Reliability MTBF 14000-19000 9%
Top Products in Traditional Segment
Name
Market
Share
Units
Sold to
Seg
Revision
Date
Stock
Out
Pfmn
Coord
Size
Coord
List
Price MTBF
Age
Dec.31
Promo
Budget
Cust.
Aware-
ness
Sales
Budget
Cust.
Access-
ibility
Dec.
Cust.
Survey
Daze 16% 1,495 8/21/2016 7.5 12.6 $28.50 18400 1.60
$1,225 73% $1,670 53% 35
Echo 15% 1,437 8/20/2016 7.1 12.9 $26.50 15000 1.38
$1,200 66% $1,056 69% 32
Cake 14% 1,353 8/26/2016 7.1 12.9 $26.00 14000 1.60
$1,025 66% $1,610 48% 33
Eat 13% 1,296 1/15/2016 5.5 14.5 $21.00 14500 3.09
$1,200 70% $1,056 69% 18
Egg 13% 1,277 5/18/2016 YES 7.1 12.9 $26.50 16000 1.96
$1,200 65% $1,056 69% 42
Baker 11% 1,015 12/23/2016 6.5 12.8 $25.00 17500 1.56
$1,000 62% $1,000 37% 33
Fast 9% 910 4/22/2015 5.5 14.5 $21.50 14000 3.08 $900
58% $725 36% 13
Able 8% 753 10/4/2016 6.4 13.5 $23.50 17000 2.05 $500
37% $500 27% 28
Acre 1% 49 11/5/2016 3.8 17.0 $17.40 16000 2.41 $500
35% $500 27% 0
Buddy 0% 32 5/4/2017 4.7 10.8 $33.00 19000 2.93 $800
44% $800 37% 0
Adam 0% 3 11/21/2016 9.6 8.9 $33.00 22000 1.63 $600
38% $660 27% 0
CAPSTONE® COURIER Page 5
Low End Segment Analysis C58538 Round: 3Dec. 31, 2016
Low End Statistics
Total Industry Unit Demand 12,488
Actual Industry Unit Sales 12,488
Segment % of Total Industry 38.2%
Next Year's Segment Growth Rate 11.7%
Low End Customer Buying Criteria
Expectations Importance
1. Price $13.50 - 23.50 53%
2. Age Ideal Age = 7.0 24%
3. Ideal Position Pfmn 3.2 Size 16.8 16%
4. Reliability MTBF 12000-17000 7%
Top Products in Low End Segment
Name
Market
Share
Units
Sold to
Seg
Revision
Date
Stock
Out
Pfmn
Coord
Size
Coord
List
Price MTBF
Age
Dec.31
Promo
Budget
Cust.
Aware-
ness
Sales
Budget
Cust.
Access-
ibility
Dec.
Cust.
Survey
Ebb 19% 2,381 1/15/2015 3.0 17.0 $19.00 12000 7.60
$1,200 69% $1,056 48% 27
Cedar 19% 2,378 1/29/2014 3.0 17.0 $19.00 12000 7.60
$1,025 65% $1,690 47% 27
Bead 19% 2,330 5/25/2009 3.0 17.0 $18.50 14000 7.60
$900 56% $1,000 37% 26
Dell 16% 1,984 5/25/2009 3.0 17.0 $21.00 14000 7.60
$1,225 72% $1,753 47% 22
Feat 11% 1,386 7/27/2018 YES 3.0 17.0 $21.50 13000 7.60
$1,100 68% $1,305 46% 19
Acre 9% 1,111 11/5/2016 3.8 17.0 $17.40 16000 2.41 $500
35% $500 19% 14
Eat 4% 457 1/15/2016 5.5 14.5 $21.00 14500 3.09 $1,200
70% $1,056 48% 6
Fast 3% 333 4/22/2015 5.5 14.5 $21.50 14000 3.08 $900
58% $725 46% 5
Baker 1% 110 12/23/2016 6.5 12.8 $25.00 17500 1.56
$1,000 62% $1,000 37% 0
Able 0% 10 10/4/2016 6.4 13.5 $23.50 17000 2.05 $500
37% $500 19% 0
Cake 0% 4 8/26/2016 7.1 12.9 $26.00 14000 1.60 $1,025
66% $1,610 47% 0
Echo 0% 4 8/20/2016 7.1 12.9 $26.50 15000 1.38 $1,200
66% $1,056 48% 0
CAPSTONE® COURIER Page 6
High End Segment Analysis C58538 Round: 3Dec. 31, 2016
High End Statistics
Total Industry Unit Demand 4,007
Actual Industry Unit Sales 4,007
Segment % of Total Industry 12.3%
Next Year's Segment Growth Rate 16.2%
High End Customer Buying Criteria
Expectations Importance
1. Ideal Position Pfmn 11.6 Size 8.4 43%
2. Age Ideal Age = 0.0 29%
3. Reliability MTBF 20000-25000 19%
4. Price $28.50 - 38.50 9%
Top Products in High End Segment
Name
Market
Share
Units
Sold to
Seg
Revision
Date
Stock
Out
Pfmn
Coord
Size
Coord
List
Price MTBF
Age
Dec.31
Promo
Budget
Cust.
Aware-
ness
Sales
Budget
Cust.
Access-
ibility
Dec.
Cust.
Survey
Fox 25% 983 12/11/2016 12.0 8.0 $38.50 25000 0.54
$1,100 41% $1,305 58% 41
Fist 23% 927 12/13/2016 11.3 8.6 $38.50 25000 1.11
$1,100 65% $1,305 58% 45
Dixie 21% 846 12/2/2016 11.3 8.7 $38.50 24500 1.15
$1,250 71% $1,753 53% 43
Cid 17% 700 12/17/2016 11.4 8.6 $37.00 23000 1.14
$1,000 60% $1,690 47% 36
Adam 7% 280 11/21/2016 9.6 8.9 $33.00 22000 1.63 $600
38% $660 23% 11
Bid 6% 251 6/9/2016 9.9 10.0 $36.50 22000 2.14 $1,000
57% $700 25% 8
Daze 0% 19 8/21/2016 7.5 12.6 $28.50 18400 1.60 $1,225
73% $1,670 53% 0
Egg 0% 2 5/18/2016 YES 7.1 12.9 $26.50 16000 1.96
$1,200 65% $1,056 17% 0
CAPSTONE® COURIER Page 7
Performance Segment Analysis C58538 Round: 3Dec. 31, 2016
Performance Statistics
Total Industry Unit Demand 3,293
Actual Industry Unit Sales 3,293
Segment % of Total Industry 10.1%
Next Year's Segment Growth Rate 19.8%
Performance Customer Buying Criteria
Expectations Importance
1. Reliability MTBF 22000-27000 43%
2. Ideal Position Pfmn 12.4 Size 13.9 29%
3. Price $23.50 - 33.50 19%
4. Age Ideal Age = 1.0 9%
Top Products in Performance Segment
Name
Market
Share
Units
Sold to
Seg
Revision
Date
Stock
Out
Pfmn
Coord
Size
Coord
List
Price MTBF
Age
Dec.31
Promo
Budget
Cust.
Aware-
ness
Sales
Budget
Cust.
Access-
ibility
Dec.
Cust.
Survey
Coat 26% 844 5/1/2016 12.4 13.9 $32.00 27000 1.57
$1,000 59% $1,529 37% 39
Dot 25% 834 8/2/2016 12.8 13.5 $33.50 27000 1.44 $1,200
69% $1,586 42% 39
Foam 24% 788 9/18/2016 12.8 13.5 $33.40 27000 1.37
$1,100 64% $1,305 35% 36
Aft 11% 355 10/15/2016 YES 11.4 14.6 $29.90 27000 1.54
$600 36% $600 18% 26
Bold 8% 266 7/16/2016 11.4 15.1 $33.00 26000 1.92 $300
32% $300 17% 15
Doom 6% 206 8/8/2016 13.0 13.4 $33.50 27000 0.39
$1,200 53% $0 42% 32
CAPSTONE® COURIER Page 8
Size Segment Analysis C58538 Round: 3Dec. 31, 2016
Size Statistics
Total Industry Unit Demand 3,284
Actual Industry Unit Sales 3,284
Segment % of Total Industry 10.1%
Next Year's Segment Growth Rate 18.3%
Size Customer Buying Criteria
Expectations Importance
1. Ideal Position Pfmn 6.1 Size 7.6 43%
2. Age Ideal Age = 1.5 29%
3. Reliability MTBF 16000-21000 19%
4. Price $23.50 - 33.50 9%
Top Products in Size Segment
Name
Market
Share
Units
Sold to
Seg
Revision
Date
Stock
Out
Pfmn
Coord
Size
Coord
List
Price MTBF
Age
Dec.31
Promo
Budget
Cust.
Aware-
ness
Sales
Budget
Cust.
Access-
ibility
Dec.
Cust.
Survey
Dune 30% 998 10/16/2016 6.5 7.4 $33.50 19000 1.35
$1,200 69% $1,586 45% 40
Fume 26% 870 12/11/2016 6.1 7.2 $33.50 16000 1.26
$1,100 64% $1,305 38% 29
Cure 25% 818 9/11/2016 6.1 7.6 $32.00 17000 1.43 $1,000
59% $1,529 40% 35
Agape 11% 368 7/30/2016 5.4 8.6 $29.00 19000 2.09 $600
34% $600 23% 17
Buddy 5% 175 5/4/2017 4.7 10.8 $33.00 19000 2.93 $800
44% $800 24% 5
Able 2% 53 10/4/2016 6.4 13.5 $23.50 17000 2.05 $500
37% $500 23% 0
Bid 0% 3 6/9/2016 9.9 10.0 $36.50 22000 2.14 $1,000 57%
$700 24% 0
CAPSTONE® COURIER Page 9
Market Share C58538 Round: 3Dec. 31, 2016
Actual Market Share in Units Potential Market Share in Units
Trad Low High Pfmn Size Total Trad Low High Pfmn Size
Total
Industry Unit Sales 9,619 12,488 4,007 3,293 3,284 32,691
Units Demanded 9,619 12,488 4,007 3,293 3,284 32,691
% of Market 29.4% 38.2% 12.3% 10.1% 10.1% 100.0% % of
Market 29.4% 38.2% 12.3% 10.1% 10.1% 100.0%
Able 7.8% 1.6% 2.5% Able 7.5% 1.6% 2.4%
Acre 0.5% 8.9% 3.5% Acre 0.5% 8.7% 3.5%
Adam 7.0% 0.9% Adam 6.4% 0.8%
Aft 10.8% 1.1% Aft 12.6% 1.3%
Agape 11.2% 1.1% Agape 11.2% 1.1%
Total 8.4% 9.0% 7.0% 10.8% 12.8% 9.1% Total 8.0% 8.8%
6.4% 12.6% 12.8% 9.0%
Baker 10.5% 0.9% 3.4% Baker 10.2% 0.9% 3.3%
Bead 18.7% 7.1% Bead 18.2% 7.0%
Bid 6.3% 0.8% Bid 5.6% 0.7%
Bold 8.1% 0.8% Bold 7.9% 0.8%
Buddy 0.3% 5.3% 0.6% Buddy 0.3% 5.3% 0.6%
Total 10.9% 19.5% 6.3% 8.1% 5.4% 12.8% Total 10.5% 19.1%
5.6% 7.9% 5.4% 12.4%
Cake 14.1% 4.2% Cake 13.5% 4.0%
Cedar 19.0% 7.3% Cedar 18.6% 7.1%
Cid 17.5% 2.1% Cid 16.0% 2.0%
Coat 25.6% 2.6% Coat 25.1% 2.5%
Cure 24.9% 2.5% Cure 24.9% 2.5%
Total 14.1% 19.1% 17.5% 25.6% 24.9% 18.6% Total 13.5%
18.6% 16.0% 25.1% 24.9% 18.1%
Daze 15.5% 0.5% 4.6% Daze 14.9% 0.4% 4.4%
Dell 15.9% 6.1% Dell 15.5% 5.9%
Dixie 21.1% 2.6% Dixie 19.4% 2.4%
Dot 25.3% 2.5% Dot 24.8% 2.5%
Dune 30.4% 3.0% Dune 30.4% 3.1%
Doom 6.3% 0.6% Doom 6.1% 0.6%
Total 15.5% 15.9% 21.6% 31.6% 30.4% 19.5% Total 14.9%
15.5% 19.8% 30.9% 30.4% 18.9%
Eat 13.5% 3.7% 5.4% Eat 13.0% 3.6% 5.2%
Ebb 19.1% 7.3% Ebb 18.6% 7.1%
Echo 14.9% 4.4% Echo 14.4% 4.2%
Egg 13.3% 3.9% Egg 16.5% 4.9%
Total 41.7% 22.8% 21.0% Total 43.9% 22.3% 21.4%
Fast 9.5% 2.7% 3.8% Fast 9.1% 2.6% 3.7%
Feat 11.1% 4.2% Feat 13.1% 5.0%
Fist 23.1% 2.8% Fist 21.2% 2.6%
Foam 23.9% 2.4% Foam 23.4% 2.4%
Fume 26.5% 2.7% Fume 26.5% 2.7%
Fox 24.5% 3.0% Fox 30.9% 3.8%
Total 9.5% 13.8% 47.7% 23.9% 26.5% 19.0% Total 9.1% 15.7%
52.1% 23.4% 26.5% 20.1%
CAPSTONE® COURIER Page 10
Perceptual Map C58538 Round: 3Dec. 31, 2016
Andrews Baldwin Chester
Name Pfmn Size Revised Name Pfmn Size Revised Name Pfmn
Size Revised
Able 6.4 13.5 10/4/2016 Baker 6.5 12.8 12/23/2016 Cake
7.1 12.9 8/26/2016
Acre 3.8 17.0 11/5/2016 Bead 3.0 17.0 5/25/2009 Cedar
3.0 17.0 1/29/2014
Adam 9.6 8.9 11/21/2016 Bid 9.9 10.0 6/9/2016 Cid
11.4 8.6 12/17/2016
Aft 11.4 14.6 10/15/2016 Bold 11.4 15.1 7/16/2016 Coat
12.4 13.9 5/1/2016
Agape 5.4 8.6 7/30/2016 Buddy 4.7 10.8 5/4/2017 Cure
6.1 7.6 9/11/2016
Abum 6.0 15.0 4/17/2016
Ajoy 6.2 15.0 5/1/2016
Apps 5.9 15.0 4/19/2016
Digby Erie Ferris
Name Pfmn Size Revised Name Pfmn Size Revised Name Pfmn
Size Revised
Daze 7.5 12.6 8/21/2016 Eat 5.5 14.5 1/15/2016 Fast
5.5 14.5 4/22/2015
Dell 3.0 17.0 5/25/2009 Ebb 3.0 17.0 1/15/2015 Feat
3.0 17.0 7/27/2018
Dixie 11.3 8.7 12/2/2016 Echo 7.1 12.9 8/20/2016 Fist
11.3 8.6 12/13/2016
Dot 12.8 13.5 8/2/2016 Egg 7.1 12.9 5/18/2016 Foam
12.8 13.5 9/18/2016
Dune 6.5 7.4 10/16/2016 Fume 6.1 7.2 12/11/2016
Doom 13.0 13.4 8/8/2016 Fox 12.0 8.0 12/11/2016
CAPSTONE® COURIER Page 11
HR/TQM Report C58538 Round: 3Dec. 31, 2016
HUMAN RESOURCES SUMMARY
Andrews Baldwin Chester Digby Erie Ferris
Needed Complement 531 911 855 1,037 988 987
Complement 531 911 855 1,037 988 987
1st Shift Complement 521 745 567 687 548 569
2nd Shift Complement 10 166 288 350 440 418
Overtime Percent 0.0% 0.0% 0.0% 0.0% 0.0% 0.0%
Turnover Rate 10.0% 10.0% 10.0% 10.0% 10.0% 10.0%
New Employees 53 176 86 213 346 264
Separated Employees 580 0 68 0 0 0
Recruiting Spend $0 $0 $0 $0 $0 $0
Training Hours 0 0 0 0 0 0
Productivity Index 100.0% 100.0% 100.0% 100.0% 100.0%
100.0%
Recruiting Cost $53 $176 $86 $213 $346 $264
Separation Cost $2,900 $0 $340 $0 $0 $0
Training Cost $0 $0 $0 $0 $0 $0
Total HR Admin Cost $2,953 $176 $426 $213 $346 $264
Labor Contract Next Year
Wages $24.31 $24.31 $24.31 $24.31 $24.31 $24.31
Benefits 2,500 2,500 2,500 2,500 2,500 2,500
Profit Sharing 2.0% 2.0% 2.0% 2.0% 2.0% 2.0%
Annual Raise 5.0% 5.0% 5.0% 5.0% 5.0% 5.0%
Starting Negotiation Position
Wages
Benefits
Profit Sharing
Annual Raise
Ceiling Negotiation Position
Wages
Benefits
Profit Sharing
Annual Raise
Adjusted Labor Demands
Wages
Benefits
Profit Sharing
Annual Raise
Strike Days
TQM SUMMARY
Andrews Baldwin Chester Digby Erie Ferris
Process Mgt Budgets Last Year
CPI Systems $0 $0 $0 $0 $0 $0
Vendor/JIT $0 $0 $0 $0 $0 $0
Quality Initiative Training $0 $0 $0 $0 $0 $0
Channel Support Systems $0 $0 $0 $0 $0 $0
Concurrent Engineering $0 $0 $0 $0 $0 $0
UNEP Green Programs $0 $0 $0 $0 $0 $0
TQM Budgets Last Year
Benchmarking $0 $0 $0 $0 $0 $0
Quality Function Deployment Effort $0 $0 $0 $0 $0 $0
CCE/6 Sigma Training $0 $0 $0 $0 $0 $0
GEMI TQEM Sustainability Initiatives $0 $0 $0 $0 $0 $0
Total Expenditures $0 $0 $0 $0 $0 $0
Cumulative Impacts
Material Cost Reduction 0.00% 0.00% 0.00% 0.00% 0.00%
0.00%
Labor Cost Reduction 0.00% 0.00% 0.00% 0.00% 0.00% 0.00%
Reduction R&D Cycle Time 0.00% 0.00% 0.00% 0.00% 0.00%
0.00%
Reduction Admin Costs 0.00% 0.00% 0.00% 0.00% 0.00%
0.00%
Demand Increase 0.00% 0.00% 0.00% 0.00% 0.00% 0.00%
CAPSTONE® COURIER Page 12
Ethics Report C58538 Round: 3Dec. 31, 2016
ETHICS SUMMARY
Other (Fees, Writeoffs, etc.) The actual dollar impact. Example,
$120 means Other increased by $120.
Demand Factor The % of normal. 98% means demand fell 2%.
Material Cost Impact The % of normal. 104% means matieral
costs rose 4%.
Admin Cost Impact The % of normal. 103% means admin costs
rose 3%.
Productivity Impact The % of normal. 104% means productivity
increased by 4%.
Awareness Impact The % of normal. 105% means normal
awareness was multiplied by 1.05.
Accessibility Impact The % of normal. 98% means normal
accessiblity was multiplied by 0.98.
Normal means the value that would have been produced if the
problem had not been presented.
No Impact Andrews Baldwin Chester Digby Erie Ferris
Total
Other (Fees, Writeoffs, etc.) $0 $0 $0 $0 $0 $0 $0
Demand Factor 100% 100% 100% 100% 100% 100% 100%
Material Cost Impact 100% 100% 100% 100% 100% 100%
100%
Admin Cost Impact 100% 100% 100% 100% 100% 100% 100%
Productivity Impact 100% 100% 100% 100% 100% 100% 100%
Awareness Impact 100% 100% 100% 100% 100% 100% 100%
Accessibility Impact 100% 100% 100% 100% 100% 100% 100%
CAPSTONE® COURIER Page 13
Annual Report
Annual Report Andrews C58538 Round: 3Dec. 31, 2016
Balance Sheet
DEFINITIONS:
Common Size: The common size
column simply represents each item as a
percentage of total assets for that year.
Cash: Your end-of-year cash position.
Accounts Receivable: Reflects the lag
between delivery and payment of your
products. Inventories: The current
value of your inventory across all products. A
zero indicates your company stocked out.
Unmet demand would, of course, fall to your
competitors. Plant & Equipment: The
current value of your plant. Accum
Deprec: The total accumulated
depreciation from your plant. Accts
Payable: What the company currently
owes suppliers for materials and services.
Current Debt: The debt the company
is obligated to pay during the next year of
operations. It includes emergency loans used
to keep your company solvent should you run
out of cash during the year. Long
Term Debt: The company's
long term debt is in the form of bonds, and this
represents the total value of your bonds.
Common Stock: The amount of
capital invested by shareholders in the
company. Retained Earnings:
The profits that the company chose to keep
instead of paying to shareholders as dividends.
ASSETS 2016
Common
Size
2015
Cash $0 0.0% $0
Account Receivable $5,750 3.4% $3,489
Inventory $110,681 66.3% $109,294
Total Current Assets $116,431 69.7% $112,783
Plant & Equipment $108,400 64.9% $108,400
Accumulated Depreciation ($57,813) -34.6% ($50,587)
Total Fixed Assets $50,587 30.3% $57,813
Total Assets $167,018 100.0% $170,597
LIABILITIES & OWNER'S
EQUITY
Accounts Payable $4,931 3.0% $10,973
Current Debt $125,793 75.3% $90,856
Long Term Debt $31,775 19.0% $31,775
Total Liabilities $162,499 97.3% $133,604
Common Stock $28,360 17.0% $28,360
Retained Earnings ($23,841) -14.3% $8,633
Total Equity $4,519 2.7% $36,993
Total Liab. & O. Equity $167,018 100.0% $170,597
Cash Flow Statement
The Cash Flow Statement examines what happened in the Cash
Account during the year. Cash injections appear as positive
numbers and
cash withdrawals as negative numbers. The Cash Flow
Statement is an
excellent tool for diagnosing emergency loans. When negative
cash flows
exceed positives, you are forced to seek emergency funding. For
example,
if sales are bad and you find yourself carrying an abundance of
excess
inventory, the report would show the increase in inventory as a
huge
negative cash flow. Too much unexpected inventory could
outstrip your
inflows, exhaust your starting cash and force you to beg for
money to keep
your company afloat.
Cash Flows from Operating Activities 2016 2015
NetIncome(Loss) ($32,474) ($14,820)
Depreciation $7,227 $7,227
Extraordinary gains/losses/writeoffs $0 $0
Accounts Payable ($6,042) $3,651
Inventory ($1,387) ($75,921)
Accounts Receivable ($2,261) $135
Net cash from operation ($34,937) ($79,728)
Cash Flows from Investing Activities
Plant Improvements $0 $0
Cash Flows from Financing Activities
Dividends Paid $0 $0
Sales of Common Stock $0 $0
Purchase of Common Stock $0 $0
Cash from long term debt $0 $0
Retirement of long term debt $0 $0
Change in current debt(net) $34,937 $79,728
Net Cash from financing activities $34,937 $79,728
Net Change in cash position $0 $0
Closing cash position $0 $0
Annual Report Page 14
Annual Report Andrews C58538 Round: 3Dec. 31, 2016
2016 Income Statement
(Product Name) Able Acre Adam Aft Agape Abum Ajoy Apps
2016
Total
Common
Size
Sales $19,157 $20,181 $9,356 $10,609 $10,659 $0 $0 $0
$69,962 100.0%
Variable Costs:
Direct Labor $7,248 $8,912 $2,704 $3,727 $3,711 $0 $0 $0
$26,302 37.6%
Direct Material $9,032 $9,053 $4,296 $5,156 $4,769 $0 $0 $0
$32,306 46.2%
Inventory Carry $8,391 $2,575 $1,108 $0 $1,208 $0 $0 $0
$13,282 19.0%
Total Variable $24,671 $20,539 $8,109 $8,883 $9,688 $0 $0 $0
$71,890 102.8%
Contribution Margin ($5,514) ($358) $1,247 $1,726 $971 $0 $0
$0 ($1,928) -2.8%
Period Costs:
Depreciation $2,640 $2,427 $1,080 $360 $720 $0 $0 $0 $7,227
10.3%
SG&A: R&D $771 $859 $904 $801 $586 $297 $337 $304
$4,858 6.9%
Promotions $500 $500 $600 $600 $600 $0 $0 $0 $2,800 4.0%
Sales $500 $500 $660 $600 $600 $0 $0 $0 $2,860 4.1%
Admin $943 $993 $460 $522 $525 $0 $0 $0 $3,443 4.9%
Total Period $5,353 $5,279 $3,704 $2,883 $3,031 $297 $337
$304 $21,188 30.3%
Net Margin ($10,868) ($5,636) ($2,457) ($1,157) ($2,060)
($297) ($337) ($304) ($23,116) -33.0%
Definitions: Sales: Unit Sales times list price. Direct Labor:
Labor costs incurred to produce the
product that was sold. Inventory Carry Cost: the cost unsold
goods in inventory. Depreciation:
Calculated on straight-line. 15-year depreciation of plant value.
R&D Costs: R&D department
expenditures for each product. Admin: Administration overhead
is estimated at 1.5% of sales.
Promotions: The promotion budget for each product. Sales: The
sales force budget for each
product. Other: Chargs not included in other categories such as
Fees, Write offs, and TQM. The fees
include money paid to investment bankers and brokerage firms
to issue new stocks or bonds plus consulting
fees your instructor might assess. Write-offs include the loss
you might experience when you sell capacity or
liquidate inventory as the result of eliminating a production
line. If the amount appears as a negative amount,
then you actually made money on the liquidation of capacity or
inventory. EBIT: Earnings Before Interest
and Taxes. Short Term Interest: Interest expense based on last
year''s current debt, including short term
debt, long term notes that have become due, and emergency
loans, Long Term Interest: Interest paid on
outstanding bonds. Taxes: Income tax based upon a 35% tax
rate. Profit Sharing: Profits shared
with employees under the labor contract. Net Profit: EBIT
minus interest, taxes, and profit sharing.
Other $0 0.0%
EBIT ($23,116) -33.0%
Short Term Interest $22,559 32.2%
Long Term Interest $4,285 6.1%
Taxes ($17,486) -25.0%
Profit Sharing $0 0.0%
Net Profit ($32,474) -46.4%
Annual Report Page 15
C58538Front PageStock & BondsFinancial SummaryProduction
AnalysisTraditional Segment AnalysisLow End Segment
AnalysisHigh End Segment AnalysisPerformance Segment
AnalysisSize Segment AnalysisMarket SharePerceptual
MapHR/TQM ReportEthics ReportAnnual
ReportAndrewsBalance SheetIncome Statement
Round: 2
Dec. 31, 2015 C58538
Andrews
Eugene Ellis
Philip Mull
Baldwin
Lisa Chastain
Monica Dalke
matt rix
Chester
Digby Erie Ferris
Selected Financial Statistics
Andrews Baldwin Chester Digby Erie Ferris
ROS -17.5% -3.1% 7.6% 7.5% 6.9% 7.3%
Asset Turnover 0.50 0.97 1.26 1.19
1.02 1.33
ROA -8.7% -3.0% 9.6% 9.0% 7.0% 9.6%
Leverage
(Assets/Equity)
4.6 2.1 2.0 2.0 2.0
2.0
ROE -40.1% -6.4% 18.7% 17.7% 14.3% 19.1%
Emergency Loan $90,856,063 $0 $0 $0 $0 $0
Sales $84,906,613 $101,934,574 $160,473,126 $164,573,195
$126,745,923 $141,932,500
EBIT ($4,019,505) $575,275 $25,536,640 $26,615,239
$20,679,294 $21,642,788
Profits ($14,819,574) ($3,131,651) $12,120,371 $12,397,854
$8,787,171 $10,296,970
Cumulative Profit ($15,705,998) $5,376,139 $21,409,632
$24,098,279 $18,874,712 $22,067,437
SG&A / Sales 13.0% 11.5% 10.0% 11.3% 8.9% 12.5%
Contrib. Margin % 16.7% 19.5% 30.7% 32.2% 31.3% 31.4%
CAPSTONE® COURIER Page 1
Stock & Bonds C58538 Round: 2Dec. 31, 2015
Stock Market Summary
Company Close Change Shares
MarketCap
($M)
Book Value EPS Dividend Yield P/E
Andrews $1.00 ($16.30) 2,291,939 $2 $16.14 ($6.47) $0.00
0.0% -0.1
Baldwin $24.19 ($14.61) 2,000,000 $48 $24.56 ($1.57) $0.00
0.0% -15.5
Chester $55.14 $14.77 2,069,366 $114 $31.29 $5.86 $1.35 2.4%
9.4
Digby $59.71 $14.57 2,050,451 $122 $34.12 $6.05 $0.00 0.0%
9.9
Erie $49.42 $7.56 2,128,085 $105 $28.94 $4.13 $2.55 5.2%
12.0
Ferris $55.88 $10.61 2,000,000 $112 $26.93 $5.15 $2.13 3.8%
10.8
Bond Market Summary
Company Series# Face Yield Close$ S&P Company Series#
Face Yield Close$ S&P
Andrews Digby
12.5S2017 $10,924,506 12.9% 97.21 DDD 12.5S2017
$13,828,904 12.4% 100.51 B
14.0S2019 $20,850,000 14.1% 99.42 DDD 14.0S2019
$20,850,000 13.3% 105.44 B
Baldwin 11.6S2025 $3,523,690 12.0% 96.64 B
12.5S2017 $13,900,000 12.5% 99.83 CCC Erie
14.0S2019 $20,850,000 13.4% 104.20 CCC 12.5S2017
$13,900,000 12.5% 100.34 B
Chester 14.0S2019 $20,850,000 13.3% 105.13 B
12.5S2017 $13,900,000 12.4% 100.67 B 11.7S2025 $1,722,021
12.1% 96.65 B
14.0S2019 $20,850,000 13.2% 105.76 B Ferris
12.5S2017 $4,616,365 12.4% 100.51 B
14.0S2019 $20,850,000 13.3% 105.44 B
Next Year's Prime Rate 8.00%
CAPSTONE® COURIER Page 2
Financial Summary C58538 Round: 2Dec. 31, 2015
Cash Flow Statement Survey Andrews Baldwin Chester Digby
Erie Ferris
CashFlows from operating activities
Net Income(Loss) ($14,820) ($3,132) $12,120 $12,398 $8,787
$10,297
Adjustment for non-cash items:
Depreciation $7,227 $7,587 $7,707 $7,653 $8,255 $5,987
Extraordinary gains/losses/writeoffs $0 $0 $8 $7 ($539) ($802)
Changes in current assets and liablilities
Acounts payable $3,651 $12 $2,546 $3,222 $571 $1,977
Inventory ($75,921) ($5,906) ($3,356) ($6,085) $2,160
($4,336)
Accounts Receivable $135 $3,847 ($3,151) ($3,515) ($1,014)
($1,929)
Net cash from operations ($79,728) $2,408 $15,874 $13,680
$18,219 $11,194
Cash flows from investing activities
Plant improvements(net) $0 $0 ($5,640) ($22,620) ($7,792)
($7,810)
Cash flows from financing activities
Dividends paid $0 $0 ($2,790) $0 ($5,433) ($4,265)
Sales of common stock $0 $0 $0 $1,588 $0 $0
Purchase of common stock $0 $0 $0 $0 $0 $0
Cash from long term debt issued $0 $0 $0 $3,524 $1,722 $0
Early retirement of long term debt $0 $0 ($858) $0 $0 ($1,311)
Retirement of current debt ($11,128) $0 ($11,359) ($11,359)
($11,359) ($11,359)
Cash from current debt borrowing $0 $0 $17,065 $20,549
$15,867 $19,431
Cash from emergency loan $90,856 $0 $0 $0 $0 $0
Net cash from financing activities $79,728 $0 $2,057 $14,302
$798 $2,496
Net change in cash position $0 $2,408 $12,291 $5,362 $11,225
$5,881
Balance Sheet Survey Andrews Baldwin Chester Digby Erie
Ferris
Cash $0 $21,426 $33,226 $28,693 $32,320 $27,119
Accounts Receivable $3,489 $16,756 $13,190 $13,527 $10,417
$11,666
Inventory $109,294 $6,296 $9,644 $11,949 $5,031 $11,285
Total Current Assets $112,783 $44,478 $56,060 $54,169
$47,768 $50,070
Plant and equipment $108,400 $113,800 $115,600 $129,800
$123,818 $89,800
Accumulated Depreciation ($50,587) ($53,107) ($44,853)
($45,707) ($46,928) ($32,867)
Total Fixed Assets $57,813 $60,693 $70,747 $84,093 $76,890
$56,933
Total Assets $170,597 $105,172 $126,806 $138,262 $124,658
$107,004
Account Payable $10,973 $14,342 $9,318 $9,548 $6,926 $8,250
CurrentDebt $90,856 $6,950 $17,989 $20,549 $19,677 $19,431
Long Term Debt $31,775 $34,750 $34,750 $38,203 $36,472
$25,466
Total Liabilities $133,604 $56,042 $62,057 $68,299 $63,075
$53,147
Common Stock $28,360 $18,360 $20,736 $20,471 $22,747
$18,360
Retained Earnings $8,633 $30,770 $44,013 $49,492 $38,836
$35,497
Total Equity $36,993 $49,129 $64,749 $69,963 $61,583 $53,857
Total Liabilities & Owners'' Equity $170,597 $105,172
$126,806 $138,262 $124,658 $107,004
Income Statement Survey Andrews Baldwin Chester Digby Erie
Ferris
Sales $84,907 $101,935 $160,473 $164,573 $126,746 $141,933
Variable Costs(Labor,Material,Carry) $70,701 $82,098
$111,175 $111,513 $87,035 $97,389
Depreciation $7,227 $7,587 $7,707 $7,653 $8,255 $5,987
SGA(R&D,Promo,Sales,Admin) $10,999 $11,674 $16,034
$18,529 $11,230 $17,696
Other(Fees,Writeoffs,TQM,Bonuses) $0 $0 $21 $262 ($453)
($782)
EBIT ($4,020) $575 $25,537 $26,615 $20,679 $21,643
Interest(Short term,Long term) $18,780 $5,393 $6,509 $7,152
$6,885 $5,478
Taxes ($7,980) ($1,686) $6,660 $6,812 $4,828 $5,658
Profit Sharing $0 $0 $247 $253 $179 $210
Net Profit ($14,820) ($3,132) $12,120 $12,398 $8,787 $10,297
CAPSTONE® COURIER Page 3
Production Analysis C58538 Round: 2Dec. 31, 2015
Name
Primary
Segment
Units
Sold
Unit
Inven
tory Revision Date
Age
Dec.31 MTBF
Pfmn
Coord
Size
Coord Price
Material
Cost
Labor
Cost
Contr.
Marg.
2nd
Shift
&
Over-
time
Auto
mation
Next
Round
Capacity
Next
Round
Plant
Utiliz.
Able Trad 630 3,376 5/3/2015 2.9 19000 6.0 12.5 $29.50 $11.49
$9.42 -12% 44% 4.0 1,800 143%
Acre Low 822 1,159 4/3/2015 3.7 16000 4.5 16.0 $24.50 $8.18
$8.05 23% 43% 5.0 1,400 141%
Adam High 460 410 5/12/2015 2.2 24000 8.9 10.0 $39.00
$15.52 $9.40 30% 0% 3.0 900 88%
Aft Pfmn 399 8 4/10/2015 1.9 26000 10.4 15.3 $34.00 $14.84
$10.51 24% 33% 3.0 300 132%
Agape Size 432 527 1/29/2015 2.8 19000 5.0 9.5 $34.00 $12.88
$10.51 21% 33% 3.0 600 132%
Baker Trad 1,474 0 3/9/2015 2.1 17500 5.6 14.2 $24.00 $10.00
$8.83 20% 0% 4.0 1,800 82%
Bead Low 1,750 0 5/25/2009 6.6 14000 3.0 17.0 $17.50 $6.38
$8.52 13% 36% 5.0 1,400 125%
Bid High 343 222 6/9/2016 2.7 23000 8.0 11.5 $34.50 $14.07
$10.10 23% 0% 3.0 900 62%
Bold Pfmn 397 34 9/15/2015 2.4 24000 10.5 15.1 $31.50 $14.36
$10.10 21% 0% 3.0 600 71%
Buddy Size 373 0 5/9/2015 1.9 19000 4.7 10.8 $31.00 $12.00
$10.10 28% 0% 3.0 600 61%
Cake Trad 1,381 173 8/26/2015 1.9 14000 6.4 13.6 $26.50 $9.61
$8.08 32% 45% 5.5 1,000 144%
Cedar Low 2,601 0 1/29/2014 6.6 12000 3.0 17.0 $19.50 $5.78
$6.44 36% 86% 7.5 1,400 184%
Cid High 837 161 11/15/2015 1.3 23000 10.2 9.8 $37.50 $15.92
$11.03 28% 58% 3.0 600 157%
Coat Pfmn 643 23 11/3/2015 1.5 27000 11.8 13.9 $32.50 $16.38
$9.39 23% 0% 4.0 600 99%
Cure Size 642 75 9/10/2015 1.6 17000 5.4 8.6 $32.50 $12.94
$10.03 28% 17% 4.0 600 116%
Daze Trad 1,465 165 8/22/2015 1.8 18100 6.8 13.3 $29.00
$11.17 $7.80 34% 29% 5.0 1,200 128%
Dell Low 2,125 0 5/25/2009 6.6 14000 3.0 17.0 $21.50 $6.38
$6.80 37% 50% 7.0 1,400 149%
Dixie High 846 188 12/3/2015 1.2 24000 10.2 9.8 $39.00
$16.22 $11.62 29% 100% 3.0 650 198%
Dot Pfmn 647 39 11/13/2015 1.5 27000 11.8 13.9 $34.00 $16.38
$9.74 25% 8% 3.0 650 107%
Dune Size 629 120 11/13/2015 1.5 19000 5.8 8.6 $34.00 $13.65
$10.03 30% 17% 3.0 700 116%
Doom 0 0 8/8/2016 0.0 0 0.0 0.0 $0.00 $0.00 $0.00 0% 0% 6.0
500 0%
Eat Trad 1,550 119 4/8/2015 2.1 15500 5.5 14.5 $27.00 $9.21
$7.47 36% 14% 7.0 1,400 113%
Ebb Low 2,406 0 1/15/2015 6.6 12000 3.0 17.0 $19.50 $5.78
$7.03 33% 71% 6.0 1,400 170%
Echo Trad 1,216 50 7/20/2015 1.4 16000 6.4 13.6 $27.00 $10.21
$9.20 24% 33% 5.0 900 132%
Edge Pfmn 83 0 6/30/2011 4.5 25000 9.4 15.5 $34.00 $13.87
$11.62 28% 99% 3.0 1 198%
Egg Size 68 91 12/24/2015 2.3 19000 6.9 13.4 $34.00 $11.44
$9.40 26% 0% 3.0 600 17%
Fast Trad 1,146 221 4/22/2015 2.1 14000 5.5 14.5 $29.00 $8.76
$9.72 33% 63% 4.0 800 161%
Feat Low 1,478 0 7/27/2018 6.6 13000 3.0 17.0 $22.00 $6.08
$8.72 32% 100% 6.0 700 198%
Fist High 847 165 12/22/2015 1.2 25000 10.2 9.8 $39.00 $16.52
$11.50 29% 90% 3.0 600 188%
Foam Pfmn 622 31 11/11/2015 1.5 27000 11.8 14.2 $34.00
$16.30 $8.22 29% 0% 4.0 600 99%
Fume Size 647 84 11/9/2015 1.5 19000 5.4 8.4 $34.00 $13.67
$8.78 34% 17% 4.0 600 116%
Fox 0 0 12/12/2015 0.0 25000 11.0 9.0 $39.00 $0.00 $0.00 0%
0% 5.5 500 0%
CAPSTONE® COURIER Page 4
Traditional Segment Analysis C58538 Round: 2Dec. 31, 2015
Traditional Statistics
Total Industry Unit Demand 8,809
Actual Industry Unit Sales 8,809
Segment % of Total Industry 30.4%
Next Year's Segment Growth Rate 9.2%
Traditional Customer Buying Criteria
Expectations Importance
1. Age Ideal Age = 2.0 47%
2. Price $19.00 - 29.00 23%
3. Ideal Position Pfmn 6.4 Size 13.6 21%
4. Reliability MTBF 14000-19000 9%
Top Products in Traditional Segment
Name
Market
Share
Units
Sold to
Seg
Revision
Date
Stock
Out
Pfmn
Coord
Size
Coord
List
Price MTBF
Age
Dec.31
Promo
Budget
Cust.
Aware-
ness
Sales
Budget
Cust.
Access-
ibility
Dec.
Cust.
Survey
Eat 16% 1,443 4/8/2015 5.5 14.5 $27.00 15500 2.09 $1,050
63% $1,085 54% 31
Daze 16% 1,424 8/22/2015 6.8 13.3 $29.00 18100 1.84
$1,100 66% $1,440 53% 36
Baker 16% 1,413 3/9/2015 YES 5.6 14.2 $24.00 17500 2.12
$1,000 61% $1,000 43% 40
Cake 15% 1,343 8/26/2015 6.4 13.6 $26.50 14000 1.87
$1,100 66% $1,270 47% 35
Echo 13% 1,177 7/20/2015 6.4 13.6 $27.00 16000 1.40
$1,050 57% $775 54% 29
Fast 13% 1,146 4/22/2015 5.5 14.5 $29.00 14000 2.08 $900
59% $1,235 48% 24
Able 6% 536 5/3/2015 6.0 12.5 $29.50 19000 2.88 $500
46% $500 35% 12
Acre 2% 198 4/3/2015 4.5 16.0 $24.50 16000 3.67 $500
42% $500 35% 3
Buddy 1% 115 5/9/2015 YES 4.7 10.8 $31.00 19000 1.93
$800 44% $800 43% 6
Bold 0% 8 9/15/2015 10.5 15.1 $31.50 24000 2.39 $800
44% $800 43% 0
Dell 0% 1 5/25/2009 YES 3.0 17.0 $21.50 14000 6.60
$1,100 64% $1,512 53% 0
Ebb 0% 1 1/15/2015 YES 3.0 17.0 $19.50 12000 6.60
$1,050 62% $1,085 54% 0
CAPSTONE® COURIER Page 5
Low End Segment Analysis C58538 Round: 2Dec. 31, 2015
Low End Statistics
Total Industry Unit Demand 11,180
Actual Industry Unit Sales 11,180
Segment % of Total Industry 38.6%
Next Year's Segment Growth Rate 11.7%
Low End Customer Buying Criteria
Expectations Importance
1. Price $14.00 - 24.00 53%
2. Age Ideal Age = 7.0 24%
3. Ideal Position Pfmn 2.7 Size 17.3 16%
4. Reliability MTBF 12000-17000 7%
Top Products in Low End Segment
Name
Market
Share
Units
Sold to
Seg
Revision
Date
Stock
Out
Pfmn
Coord
Size
Coord
List
Price MTBF
Age
Dec.31
Promo
Budget
Cust.
Aware-
ness
Sales
Budget
Cust.
Access-
ibility
Dec.
Cust.
Survey
Cedar 23% 2,600 1/29/2014 YES 3.0 17.0 $19.50 12000
6.60 $1,100 64% $1,333 40% 25
Ebb 22% 2,405 1/15/2015 YES 3.0 17.0 $19.50 12000 6.60
$1,050 62% $1,085 36% 23
Dell 19% 2,124 5/25/2009 YES 3.0 17.0 $21.50 14000 6.60
$1,100 64% $1,512 42% 20
Bead 16% 1,750 5/25/2009 YES 3.0 17.0 $17.50 14000
6.60 $900 56% $800 31% 32
Feat 13% 1,477 7/27/2018 YES 3.0 17.0 $22.00 13000 6.60
$1,100 64% $1,235 36% 17
Acre 6% 624 4/3/2015 4.5 16.0 $24.50 16000 3.67 $500
42% $500 24% 2
Eat 1% 107 4/8/2015 5.5 14.5 $27.00 15500 2.09 $1,050
63% $1,085 36% 0
Baker 1% 56 3/9/2015 YES 5.6 14.2 $24.00 17500 2.12
$1,000 61% $1,000 31% 1
Cake 0% 36 8/26/2015 6.4 13.6 $26.50 14000 1.87 $1,100
66% $1,270 40% 0
CAPSTONE® COURIER Page 6
High End Segment Analysis C58538 Round: 2Dec. 31, 2015
High End Statistics
Total Industry Unit Demand 3,448
Actual Industry Unit Sales 3,448
Segment % of Total Industry 11.9%
Next Year's Segment Growth Rate 16.2%
High End Customer Buying Criteria
Expectations Importance
1. Ideal Position Pfmn 10.7 Size 9.3 43%
2. Age Ideal Age = 0.0 29%
3. Reliability MTBF 20000-25000 19%
4. Price $29.00 - 39.00 9%
Top Products in High End Segment
Name
Market
Share
Units
Sold to
Seg
Revision
Date
Stock
Out
Pfmn
Coord
Size
Coord
List
Price MTBF
Age
Dec.31
Promo
Budget
Cust.
Aware-
ness
Sales
Budget
Cust.
Access-
ibility
Dec.
Cust.
Survey
Fist 25% 847 12/22/2015 10.2 9.8 $39.00 25000 1.18
$1,100 61% $1,235 44% 36
Dixie 25% 846 12/3/2015 10.2 9.8 $39.00 24000 1.23
$1,100 63% $1,512 51% 36
Cid 24% 837 11/15/2015 10.2 9.8 $37.50 23000 1.25
$1,000 58% $1,333 44% 30
Adam 13% 460 5/12/2015 8.9 10.0 $39.00 24000 2.17 $600
43% $660 30% 10
Bid 10% 340 6/9/2016 8.0 11.5 $34.50 23000 2.72 $1,000
53% $700 31% 5
Daze 1% 36 8/22/2015 6.8 13.3 $29.00 18100 1.84 $1,100
66% $1,440 51% 0
Echo 1% 24 7/20/2015 6.4 13.6 $27.00 16000 1.40 $1,050
57% $775 26% 0
Able 1% 19 5/3/2015 6.0 12.5 $29.50 19000 2.88 $500 46%
$500 30% 0
Dot 0% 14 11/13/2015 11.8 13.9 $34.00 27000 1.47 $1,100
62% $1,368 51% 0
Coat 0% 13 11/3/2015 11.8 13.9 $32.50 27000 1.48 $1,000
56% $1,206 44% 0
Aft 0% 6 4/10/2015 10.4 15.3 $34.00 26000 1.87 $600 40%
$600 30% 0
Foam 0% 4 11/11/2015 11.8 14.2 $34.00 27000 1.47 $1,100
59% $1,235 44% 0
CAPSTONE® COURIER Page 7
Performance Segment Analysis C58538 Round: 2Dec. 31, 2015
Performance Statistics
Total Industry Unit Demand 2,749
Actual Industry Unit Sales 2,749
Segment % of Total Industry 9.5%
Next Year's Segment Growth Rate 19.8%
Performance Customer Buying Criteria
Expectations Importance
1. Reliability MTBF 22000-27000 43%
2. Ideal Position Pfmn 11.4 Size 14.6 29%
3. Price $24.00 - 34.00 19%
4. Age Ideal Age = 1.0 9%
Top Products in Performance Segment
Name
Market
Share
Units
Sold to
Seg
Revision
Date
Stock
Out
Pfmn
Coord
Size
Coord
List
Price MTBF
Age
Dec.31
Promo
Budget
Cust.
Aware-
ness
Sales
Budget
Cust.
Access-
ibility
Dec.
Cust.
Survey
Dot 23% 634 11/13/2015 11.8 13.9 $34.00 27000 1.47
$1,100 62% $1,368 38% 35
Coat 23% 629 11/3/2015 11.8 13.9 $32.50 27000 1.48
$1,000 56% $1,206 33% 34
Foam 22% 618 11/11/2015 11.8 14.2 $34.00 27000 1.47
$1,100 59% $1,235 35% 35
Aft 14% 393 4/10/2015 10.4 15.3 $34.00 26000 1.87 $600
40% $600 23% 17
Bold 14% 390 9/15/2015 10.5 15.1 $31.50 24000 2.39 $800
44% $800 25% 14
Edge 3% 83 6/30/2011 YES 9.4 15.5 $34.00 25000 4.50
$300 25% $155 17% 7
Daze 0% 1 8/22/2015 6.8 13.3 $29.00 18100 1.84 $1,100
66% $1,440 38% 0
CAPSTONE® COURIER Page 8
Size Segment Analysis C58538 Round: 2Dec. 31, 2015
Size Statistics
Total Industry Unit Demand 2,776
Actual Industry Unit Sales 2,776
Segment % of Total Industry 9.6%
Next Year's Segment Growth Rate 18.3%
Size Customer Buying Criteria
Expectations Importance
1. Ideal Position Pfmn 5.4 Size 8.6 43%
2. Age Ideal Age = 1.5 29%
3. Reliability MTBF 16000-21000 19%
4. Price $24.00 - 34.00 9%
Top Products in Size Segment
Name
Market
Share
Units
Sold to
Seg
Revision
Date
Stock
Out
Pfmn
Coord
Size
Coord
List
Price MTBF
Age
Dec.31
Promo
Budget
Cust.
Aware-
ness
Sales
Budget
Cust.
Access-
ibility
Dec.
Cust.
Survey
Fume 23% 647 11/9/2015 5.4 8.4 $34.00 19000 1.48 $1,100
59% $1,235 39% 39
Cure 23% 642 9/10/2015 5.4 8.6 $32.50 17000 1.56 $1,000
56% $1,206 37% 33
Dune 23% 628 11/13/2015 5.8 8.6 $34.00 19000 1.50
$1,100 62% $1,368 42% 39
Agape 16% 432 1/29/2015 5.0 9.5 $34.00 19000 2.76 $600
38% $600 26% 12
Buddy 9% 258 5/9/2015 YES 4.7 10.8 $31.00 19000 1.93
$800 44% $800 28% 12
Able 3% 74 5/3/2015 6.0 12.5 $29.50 19000 2.88 $500 46%
$500 26% 4
Egg 2% 67 12/24/2015 6.9 13.4 $34.00 19000 2.30 $1,050
56% $775 29% 0
Echo 1% 14 7/20/2015 6.4 13.6 $27.00 16000 1.40 $1,050
57% $775 29% 0
Baker 0% 5 3/9/2015 YES 5.6 14.2 $24.00 17500 2.12
$1,000 61% $1,000 28% 0
Daze 0% 3 8/22/2015 6.8 13.3 $29.00 18100 1.84 $1,100
66% $1,440 42% 0
Bid 0% 3 6/9/2016 8.0 11.5 $34.50 23000 2.72 $1,000 53%
$700 28% 0
Cake 0% 1 8/26/2015 6.4 13.6 $26.50 14000 1.87 $1,100
66% $1,270 37% 0
CAPSTONE® COURIER Page 9
Market Share C58538 Round: 2Dec. 31, 2015
Actual Market Share in Units Potential Market Share in Units
Trad Low High Pfmn Size Total Trad Low High Pfmn Size
Total
Industry Unit Sales 8,809 11,180 3,448 2,749 2,776 28,961
Units Demanded 8,809 11,180 3,448 2,749 2,776 28,961
% of Market 30.4% 38.6% 11.9% 9.5% 9.6% 100.0% % of
Market 30.4% 38.6% 11.9% 9.5% 9.6% 100.0%
Able 6.1% 0.5% 2.7% 2.2% Able 5.8% 0.6% 2.6% 2.1%
Acre 2.2% 5.6% 2.8% Acre 2.1% 2.6% 1.6%
Adam 13.4% 1.6% Adam 13.3% 1.6%
Aft 0.2% 14.3% 1.4% Aft 0.2% 14.4% 1.4%
Agape 15.6% 1.5% Agape 15.3% 1.5%
Total 8.3% 5.6% 14.1% 14.3% 18.2% 9.5% Total 7.9% 2.6%
14.1% 14.4% 18.0% 8.2%
Baker 16.0% 0.5% 0.2% 5.1% Baker 20.1% 0.6% 0.2% 6.4%
Round 5Dec. 31, 2018 C58538AndrewsEugene EllisPhili.docx

More Related Content

Similar to Round 5Dec. 31, 2018 C58538AndrewsEugene EllisPhili.docx

Case 2 aymaan hossain (1531434030)
Case 2  aymaan hossain (1531434030)Case 2  aymaan hossain (1531434030)
Case 2 aymaan hossain (1531434030)AymaanHossain1
 
Digital everywhere 2% growth with debt
Digital everywhere 2% growth with debtDigital everywhere 2% growth with debt
Digital everywhere 2% growth with debtBea Morales
 
Financial Forecasting
Financial ForecastingFinancial Forecasting
Financial ForecastingJamariHodges1
 
Excerpts taken from Lucas, S.E. (12th ed.) (2015). The Art .docx
Excerpts taken from  Lucas, S.E. (12th ed.) (2015).  The Art .docxExcerpts taken from  Lucas, S.E. (12th ed.) (2015).  The Art .docx
Excerpts taken from Lucas, S.E. (12th ed.) (2015). The Art .docxcravennichole326
 
Financial Forecasting
Financial ForecastingFinancial Forecasting
Financial ForecastingTravonnLee
 
Chap2 case athletics_solution
Chap2 case athletics_solutionChap2 case athletics_solution
Chap2 case athletics_solutionshearerpack
 
Chap2 case athletics_solution
Chap2 case athletics_solutionChap2 case athletics_solution
Chap2 case athletics_solutionshearerpack
 
Round 2 - 2020Sim ID Z79546_8High Level OverviewTe.docx
Round 2 - 2020Sim ID Z79546_8High Level OverviewTe.docxRound 2 - 2020Sim ID Z79546_8High Level OverviewTe.docx
Round 2 - 2020Sim ID Z79546_8High Level OverviewTe.docxdaniely50
 
limited brands annual report 1998_mda
limited brands annual report 1998_mdalimited brands annual report 1998_mda
limited brands annual report 1998_mdafinance26
 
Swifton - The Capital Network - Financial Projections
Swifton - The Capital Network - Financial ProjectionsSwifton - The Capital Network - Financial Projections
Swifton - The Capital Network - Financial ProjectionsDavid Fogel
 
Swifton CFOs - McCarter English - Fin Proj 100511
Swifton CFOs - McCarter English - Fin Proj 100511Swifton CFOs - McCarter English - Fin Proj 100511
Swifton CFOs - McCarter English - Fin Proj 100511David Fogel
 
Clinton Global Initiative Hult Prize Finalist Presentation - Harambee
Clinton Global Initiative Hult Prize Finalist Presentation - HarambeeClinton Global Initiative Hult Prize Finalist Presentation - Harambee
Clinton Global Initiative Hult Prize Finalist Presentation - HarambeeBig Fish Presentations
 
ACG_Cup_-_Valuation
ACG_Cup_-_ValuationACG_Cup_-_Valuation
ACG_Cup_-_ValuationIke Ekeh
 
Swifton CFOs LLC - Boston BizSpark presentation - Financial Projections for I...
Swifton CFOs LLC - Boston BizSpark presentation - Financial Projections for I...Swifton CFOs LLC - Boston BizSpark presentation - Financial Projections for I...
Swifton CFOs LLC - Boston BizSpark presentation - Financial Projections for I...David Fogel
 
whole food market fiveyeardata
whole food market  fiveyeardatawhole food market  fiveyeardata
whole food market fiveyeardatafinance44
 
Brunswick (BC) Pitch - Jonathan Chang - FINAL COPY
Brunswick (BC) Pitch - Jonathan Chang - FINAL COPYBrunswick (BC) Pitch - Jonathan Chang - FINAL COPY
Brunswick (BC) Pitch - Jonathan Chang - FINAL COPYJonathan Chang
 

Similar to Round 5Dec. 31, 2018 C58538AndrewsEugene EllisPhili.docx (20)

Case 2 aymaan hossain (1531434030)
Case 2  aymaan hossain (1531434030)Case 2  aymaan hossain (1531434030)
Case 2 aymaan hossain (1531434030)
 
Digital everywhere 2% growth with debt
Digital everywhere 2% growth with debtDigital everywhere 2% growth with debt
Digital everywhere 2% growth with debt
 
Financial Forecasting
Financial ForecastingFinancial Forecasting
Financial Forecasting
 
ABD Update
ABD UpdateABD Update
ABD Update
 
Excerpts taken from Lucas, S.E. (12th ed.) (2015). The Art .docx
Excerpts taken from  Lucas, S.E. (12th ed.) (2015).  The Art .docxExcerpts taken from  Lucas, S.E. (12th ed.) (2015).  The Art .docx
Excerpts taken from Lucas, S.E. (12th ed.) (2015). The Art .docx
 
Financial Forecasting
Financial ForecastingFinancial Forecasting
Financial Forecasting
 
Chap2 case athletics_solution
Chap2 case athletics_solutionChap2 case athletics_solution
Chap2 case athletics_solution
 
Chap2 case athletics_solution
Chap2 case athletics_solutionChap2 case athletics_solution
Chap2 case athletics_solution
 
Teacher Concessions
Teacher ConcessionsTeacher Concessions
Teacher Concessions
 
Round 2 - 2020Sim ID Z79546_8High Level OverviewTe.docx
Round 2 - 2020Sim ID Z79546_8High Level OverviewTe.docxRound 2 - 2020Sim ID Z79546_8High Level OverviewTe.docx
Round 2 - 2020Sim ID Z79546_8High Level OverviewTe.docx
 
limited brands annual report 1998_mda
limited brands annual report 1998_mdalimited brands annual report 1998_mda
limited brands annual report 1998_mda
 
Swifton - The Capital Network - Financial Projections
Swifton - The Capital Network - Financial ProjectionsSwifton - The Capital Network - Financial Projections
Swifton - The Capital Network - Financial Projections
 
Swifton CFOs - McCarter English - Fin Proj 100511
Swifton CFOs - McCarter English - Fin Proj 100511Swifton CFOs - McCarter English - Fin Proj 100511
Swifton CFOs - McCarter English - Fin Proj 100511
 
Clinton Global Initiative Hult Prize Finalist Presentation - Harambee
Clinton Global Initiative Hult Prize Finalist Presentation - HarambeeClinton Global Initiative Hult Prize Finalist Presentation - Harambee
Clinton Global Initiative Hult Prize Finalist Presentation - Harambee
 
ACG_Cup_-_Valuation
ACG_Cup_-_ValuationACG_Cup_-_Valuation
ACG_Cup_-_Valuation
 
Swifton CFOs LLC - Boston BizSpark presentation - Financial Projections for I...
Swifton CFOs LLC - Boston BizSpark presentation - Financial Projections for I...Swifton CFOs LLC - Boston BizSpark presentation - Financial Projections for I...
Swifton CFOs LLC - Boston BizSpark presentation - Financial Projections for I...
 
whole food market fiveyeardata
whole food market  fiveyeardatawhole food market  fiveyeardata
whole food market fiveyeardata
 
ACG Cup - Valuation
ACG Cup - ValuationACG Cup - Valuation
ACG Cup - Valuation
 
Brunswick (BC) Pitch - Jonathan Chang - FINAL COPY
Brunswick (BC) Pitch - Jonathan Chang - FINAL COPYBrunswick (BC) Pitch - Jonathan Chang - FINAL COPY
Brunswick (BC) Pitch - Jonathan Chang - FINAL COPY
 
Case 2
Case 2Case 2
Case 2
 

More from joellemurphey

Eastern European countries appear to have become dependent on Ru.docx
Eastern European countries appear to have become dependent on Ru.docxEastern European countries appear to have become dependent on Ru.docx
Eastern European countries appear to have become dependent on Ru.docxjoellemurphey
 
EAS 209 Second Response Paper Topic Assignment Due .docx
EAS 209 Second Response Paper Topic Assignment Due .docxEAS 209 Second Response Paper Topic Assignment Due .docx
EAS 209 Second Response Paper Topic Assignment Due .docxjoellemurphey
 
Earth Science LabIn what order do materials settle in waterSo t.docx
Earth Science LabIn what order do materials settle in waterSo t.docxEarth Science LabIn what order do materials settle in waterSo t.docx
Earth Science LabIn what order do materials settle in waterSo t.docxjoellemurphey
 
EarlyIntervention Strategies Paper (15 points)The pu.docx
EarlyIntervention Strategies Paper (15 points)The pu.docxEarlyIntervention Strategies Paper (15 points)The pu.docx
EarlyIntervention Strategies Paper (15 points)The pu.docxjoellemurphey
 
Early Hominids & Australopithecus SubscribeWhat is a too.docx
Early Hominids & Australopithecus SubscribeWhat is a too.docxEarly Hominids & Australopithecus SubscribeWhat is a too.docx
Early Hominids & Australopithecus SubscribeWhat is a too.docxjoellemurphey
 
Early scholarly and philosophical manuscripts were in Greek. However.docx
Early scholarly and philosophical manuscripts were in Greek. However.docxEarly scholarly and philosophical manuscripts were in Greek. However.docx
Early scholarly and philosophical manuscripts were in Greek. However.docxjoellemurphey
 
Early Learning & Developmental Guidelines July 2017 1 .docx
Early Learning & Developmental Guidelines July 2017 1 .docxEarly Learning & Developmental Guidelines July 2017 1 .docx
Early Learning & Developmental Guidelines July 2017 1 .docxjoellemurphey
 
Early Innovations and Their Impact Today Wilbur and Orville Wrig.docx
Early Innovations and Their Impact Today Wilbur and Orville Wrig.docxEarly Innovations and Their Impact Today Wilbur and Orville Wrig.docx
Early Innovations and Their Impact Today Wilbur and Orville Wrig.docxjoellemurphey
 
Early childhood professionals have an essential role in creating.docx
Early childhood professionals have an essential role in creating.docxEarly childhood professionals have an essential role in creating.docx
Early childhood professionals have an essential role in creating.docxjoellemurphey
 
Early Constitutional ControversiesIn 1788, Alexander Hamilton and .docx
Early Constitutional ControversiesIn 1788, Alexander Hamilton and .docxEarly Constitutional ControversiesIn 1788, Alexander Hamilton and .docx
Early Constitutional ControversiesIn 1788, Alexander Hamilton and .docxjoellemurphey
 
Early Civilizations MatrixUsing your readings and outside sour.docx
Early Civilizations MatrixUsing your readings and outside sour.docxEarly Civilizations MatrixUsing your readings and outside sour.docx
Early Civilizations MatrixUsing your readings and outside sour.docxjoellemurphey
 
Early childhood teachers need to stay connected to what is occurring.docx
Early childhood teachers need to stay connected to what is occurring.docxEarly childhood teachers need to stay connected to what is occurring.docx
Early childhood teachers need to stay connected to what is occurring.docxjoellemurphey
 
Early and Middle Adulthood PaperPrepare a 1,050- to 1,400-word.docx
Early and Middle Adulthood PaperPrepare a 1,050- to 1,400-word.docxEarly and Middle Adulthood PaperPrepare a 1,050- to 1,400-word.docx
Early and Middle Adulthood PaperPrepare a 1,050- to 1,400-word.docxjoellemurphey
 
Earlier this semester, you participated in a class discussion about .docx
Earlier this semester, you participated in a class discussion about .docxEarlier this semester, you participated in a class discussion about .docx
Earlier this semester, you participated in a class discussion about .docxjoellemurphey
 
EAP1640 - Level 6 Writing (Virtual College, MDC) Author P.docx
EAP1640 - Level 6 Writing (Virtual College, MDC) Author P.docxEAP1640 - Level 6 Writing (Virtual College, MDC) Author P.docx
EAP1640 - Level 6 Writing (Virtual College, MDC) Author P.docxjoellemurphey
 
Earlean, please write these notes for me. October 01, 20181. My .docx
Earlean, please write these notes for me. October 01, 20181. My .docxEarlean, please write these notes for me. October 01, 20181. My .docx
Earlean, please write these notes for me. October 01, 20181. My .docxjoellemurphey
 
eam Assignment 4 Teaming Across Distance and Culture..docx
eam Assignment 4 Teaming Across Distance and Culture..docxeam Assignment 4 Teaming Across Distance and Culture..docx
eam Assignment 4 Teaming Across Distance and Culture..docxjoellemurphey
 
ead the following articleMother Tongue Maintenance Among North .docx
ead the following articleMother Tongue Maintenance Among North .docxead the following articleMother Tongue Maintenance Among North .docx
ead the following articleMother Tongue Maintenance Among North .docxjoellemurphey
 
eActivityGo to the United States Equal Employment Oppo.docx
eActivityGo to the United States Equal Employment Oppo.docxeActivityGo to the United States Equal Employment Oppo.docx
eActivityGo to the United States Equal Employment Oppo.docxjoellemurphey
 
Each year on or around June 15, communities and municipalities aroun.docx
Each year on or around June 15, communities and municipalities aroun.docxEach year on or around June 15, communities and municipalities aroun.docx
Each year on or around June 15, communities and municipalities aroun.docxjoellemurphey
 

More from joellemurphey (20)

Eastern European countries appear to have become dependent on Ru.docx
Eastern European countries appear to have become dependent on Ru.docxEastern European countries appear to have become dependent on Ru.docx
Eastern European countries appear to have become dependent on Ru.docx
 
EAS 209 Second Response Paper Topic Assignment Due .docx
EAS 209 Second Response Paper Topic Assignment Due .docxEAS 209 Second Response Paper Topic Assignment Due .docx
EAS 209 Second Response Paper Topic Assignment Due .docx
 
Earth Science LabIn what order do materials settle in waterSo t.docx
Earth Science LabIn what order do materials settle in waterSo t.docxEarth Science LabIn what order do materials settle in waterSo t.docx
Earth Science LabIn what order do materials settle in waterSo t.docx
 
EarlyIntervention Strategies Paper (15 points)The pu.docx
EarlyIntervention Strategies Paper (15 points)The pu.docxEarlyIntervention Strategies Paper (15 points)The pu.docx
EarlyIntervention Strategies Paper (15 points)The pu.docx
 
Early Hominids & Australopithecus SubscribeWhat is a too.docx
Early Hominids & Australopithecus SubscribeWhat is a too.docxEarly Hominids & Australopithecus SubscribeWhat is a too.docx
Early Hominids & Australopithecus SubscribeWhat is a too.docx
 
Early scholarly and philosophical manuscripts were in Greek. However.docx
Early scholarly and philosophical manuscripts were in Greek. However.docxEarly scholarly and philosophical manuscripts were in Greek. However.docx
Early scholarly and philosophical manuscripts were in Greek. However.docx
 
Early Learning & Developmental Guidelines July 2017 1 .docx
Early Learning & Developmental Guidelines July 2017 1 .docxEarly Learning & Developmental Guidelines July 2017 1 .docx
Early Learning & Developmental Guidelines July 2017 1 .docx
 
Early Innovations and Their Impact Today Wilbur and Orville Wrig.docx
Early Innovations and Their Impact Today Wilbur and Orville Wrig.docxEarly Innovations and Their Impact Today Wilbur and Orville Wrig.docx
Early Innovations and Their Impact Today Wilbur and Orville Wrig.docx
 
Early childhood professionals have an essential role in creating.docx
Early childhood professionals have an essential role in creating.docxEarly childhood professionals have an essential role in creating.docx
Early childhood professionals have an essential role in creating.docx
 
Early Constitutional ControversiesIn 1788, Alexander Hamilton and .docx
Early Constitutional ControversiesIn 1788, Alexander Hamilton and .docxEarly Constitutional ControversiesIn 1788, Alexander Hamilton and .docx
Early Constitutional ControversiesIn 1788, Alexander Hamilton and .docx
 
Early Civilizations MatrixUsing your readings and outside sour.docx
Early Civilizations MatrixUsing your readings and outside sour.docxEarly Civilizations MatrixUsing your readings and outside sour.docx
Early Civilizations MatrixUsing your readings and outside sour.docx
 
Early childhood teachers need to stay connected to what is occurring.docx
Early childhood teachers need to stay connected to what is occurring.docxEarly childhood teachers need to stay connected to what is occurring.docx
Early childhood teachers need to stay connected to what is occurring.docx
 
Early and Middle Adulthood PaperPrepare a 1,050- to 1,400-word.docx
Early and Middle Adulthood PaperPrepare a 1,050- to 1,400-word.docxEarly and Middle Adulthood PaperPrepare a 1,050- to 1,400-word.docx
Early and Middle Adulthood PaperPrepare a 1,050- to 1,400-word.docx
 
Earlier this semester, you participated in a class discussion about .docx
Earlier this semester, you participated in a class discussion about .docxEarlier this semester, you participated in a class discussion about .docx
Earlier this semester, you participated in a class discussion about .docx
 
EAP1640 - Level 6 Writing (Virtual College, MDC) Author P.docx
EAP1640 - Level 6 Writing (Virtual College, MDC) Author P.docxEAP1640 - Level 6 Writing (Virtual College, MDC) Author P.docx
EAP1640 - Level 6 Writing (Virtual College, MDC) Author P.docx
 
Earlean, please write these notes for me. October 01, 20181. My .docx
Earlean, please write these notes for me. October 01, 20181. My .docxEarlean, please write these notes for me. October 01, 20181. My .docx
Earlean, please write these notes for me. October 01, 20181. My .docx
 
eam Assignment 4 Teaming Across Distance and Culture..docx
eam Assignment 4 Teaming Across Distance and Culture..docxeam Assignment 4 Teaming Across Distance and Culture..docx
eam Assignment 4 Teaming Across Distance and Culture..docx
 
ead the following articleMother Tongue Maintenance Among North .docx
ead the following articleMother Tongue Maintenance Among North .docxead the following articleMother Tongue Maintenance Among North .docx
ead the following articleMother Tongue Maintenance Among North .docx
 
eActivityGo to the United States Equal Employment Oppo.docx
eActivityGo to the United States Equal Employment Oppo.docxeActivityGo to the United States Equal Employment Oppo.docx
eActivityGo to the United States Equal Employment Oppo.docx
 
Each year on or around June 15, communities and municipalities aroun.docx
Each year on or around June 15, communities and municipalities aroun.docxEach year on or around June 15, communities and municipalities aroun.docx
Each year on or around June 15, communities and municipalities aroun.docx
 

Recently uploaded

POINT- BIOCHEMISTRY SEM 2 ENZYMES UNIT 5.pptx
POINT- BIOCHEMISTRY SEM 2 ENZYMES UNIT 5.pptxPOINT- BIOCHEMISTRY SEM 2 ENZYMES UNIT 5.pptx
POINT- BIOCHEMISTRY SEM 2 ENZYMES UNIT 5.pptxSayali Powar
 
“Oh GOSH! Reflecting on Hackteria's Collaborative Practices in a Global Do-It...
“Oh GOSH! Reflecting on Hackteria's Collaborative Practices in a Global Do-It...“Oh GOSH! Reflecting on Hackteria's Collaborative Practices in a Global Do-It...
“Oh GOSH! Reflecting on Hackteria's Collaborative Practices in a Global Do-It...Marc Dusseiller Dusjagr
 
Call Girls in Dwarka Mor Delhi Contact Us 9654467111
Call Girls in Dwarka Mor Delhi Contact Us 9654467111Call Girls in Dwarka Mor Delhi Contact Us 9654467111
Call Girls in Dwarka Mor Delhi Contact Us 9654467111Sapana Sha
 
EPANDING THE CONTENT OF AN OUTLINE using notes.pptx
EPANDING THE CONTENT OF AN OUTLINE using notes.pptxEPANDING THE CONTENT OF AN OUTLINE using notes.pptx
EPANDING THE CONTENT OF AN OUTLINE using notes.pptxRaymartEstabillo3
 
Class 11 Legal Studies Ch-1 Concept of State .pdf
Class 11 Legal Studies Ch-1 Concept of State .pdfClass 11 Legal Studies Ch-1 Concept of State .pdf
Class 11 Legal Studies Ch-1 Concept of State .pdfakmcokerachita
 
History Class XII Ch. 3 Kinship, Caste and Class (1).pptx
History Class XII Ch. 3 Kinship, Caste and Class (1).pptxHistory Class XII Ch. 3 Kinship, Caste and Class (1).pptx
History Class XII Ch. 3 Kinship, Caste and Class (1).pptxsocialsciencegdgrohi
 
Final demo Grade 9 for demo Plan dessert.pptx
Final demo Grade 9 for demo Plan dessert.pptxFinal demo Grade 9 for demo Plan dessert.pptx
Final demo Grade 9 for demo Plan dessert.pptxAvyJaneVismanos
 
Hybridoma Technology ( Production , Purification , and Application )
Hybridoma Technology  ( Production , Purification , and Application  ) Hybridoma Technology  ( Production , Purification , and Application  )
Hybridoma Technology ( Production , Purification , and Application ) Sakshi Ghasle
 
Sanyam Choudhary Chemistry practical.pdf
Sanyam Choudhary Chemistry practical.pdfSanyam Choudhary Chemistry practical.pdf
Sanyam Choudhary Chemistry practical.pdfsanyamsingh5019
 
The Most Excellent Way | 1 Corinthians 13
The Most Excellent Way | 1 Corinthians 13The Most Excellent Way | 1 Corinthians 13
The Most Excellent Way | 1 Corinthians 13Steve Thomason
 
Painted Grey Ware.pptx, PGW Culture of India
Painted Grey Ware.pptx, PGW Culture of IndiaPainted Grey Ware.pptx, PGW Culture of India
Painted Grey Ware.pptx, PGW Culture of IndiaVirag Sontakke
 
SOCIAL AND HISTORICAL CONTEXT - LFTVD.pptx
SOCIAL AND HISTORICAL CONTEXT - LFTVD.pptxSOCIAL AND HISTORICAL CONTEXT - LFTVD.pptx
SOCIAL AND HISTORICAL CONTEXT - LFTVD.pptxiammrhaywood
 
Computed Fields and api Depends in the Odoo 17
Computed Fields and api Depends in the Odoo 17Computed Fields and api Depends in the Odoo 17
Computed Fields and api Depends in the Odoo 17Celine George
 
CARE OF CHILD IN INCUBATOR..........pptx
CARE OF CHILD IN INCUBATOR..........pptxCARE OF CHILD IN INCUBATOR..........pptx
CARE OF CHILD IN INCUBATOR..........pptxGaneshChakor2
 
18-04-UA_REPORT_MEDIALITERAСY_INDEX-DM_23-1-final-eng.pdf
18-04-UA_REPORT_MEDIALITERAСY_INDEX-DM_23-1-final-eng.pdf18-04-UA_REPORT_MEDIALITERAСY_INDEX-DM_23-1-final-eng.pdf
18-04-UA_REPORT_MEDIALITERAСY_INDEX-DM_23-1-final-eng.pdfssuser54595a
 
Introduction to AI in Higher Education_draft.pptx
Introduction to AI in Higher Education_draft.pptxIntroduction to AI in Higher Education_draft.pptx
Introduction to AI in Higher Education_draft.pptxpboyjonauth
 
Science lesson Moon for 4th quarter lesson
Science lesson Moon for 4th quarter lessonScience lesson Moon for 4th quarter lesson
Science lesson Moon for 4th quarter lessonJericReyAuditor
 
How to Configure Email Server in Odoo 17
How to Configure Email Server in Odoo 17How to Configure Email Server in Odoo 17
How to Configure Email Server in Odoo 17Celine George
 
ENGLISH5 QUARTER4 MODULE1 WEEK1-3 How Visual and Multimedia Elements.pptx
ENGLISH5 QUARTER4 MODULE1 WEEK1-3 How Visual and Multimedia Elements.pptxENGLISH5 QUARTER4 MODULE1 WEEK1-3 How Visual and Multimedia Elements.pptx
ENGLISH5 QUARTER4 MODULE1 WEEK1-3 How Visual and Multimedia Elements.pptxAnaBeatriceAblay2
 

Recently uploaded (20)

POINT- BIOCHEMISTRY SEM 2 ENZYMES UNIT 5.pptx
POINT- BIOCHEMISTRY SEM 2 ENZYMES UNIT 5.pptxPOINT- BIOCHEMISTRY SEM 2 ENZYMES UNIT 5.pptx
POINT- BIOCHEMISTRY SEM 2 ENZYMES UNIT 5.pptx
 
TataKelola dan KamSiber Kecerdasan Buatan v022.pdf
TataKelola dan KamSiber Kecerdasan Buatan v022.pdfTataKelola dan KamSiber Kecerdasan Buatan v022.pdf
TataKelola dan KamSiber Kecerdasan Buatan v022.pdf
 
“Oh GOSH! Reflecting on Hackteria's Collaborative Practices in a Global Do-It...
“Oh GOSH! Reflecting on Hackteria's Collaborative Practices in a Global Do-It...“Oh GOSH! Reflecting on Hackteria's Collaborative Practices in a Global Do-It...
“Oh GOSH! Reflecting on Hackteria's Collaborative Practices in a Global Do-It...
 
Call Girls in Dwarka Mor Delhi Contact Us 9654467111
Call Girls in Dwarka Mor Delhi Contact Us 9654467111Call Girls in Dwarka Mor Delhi Contact Us 9654467111
Call Girls in Dwarka Mor Delhi Contact Us 9654467111
 
EPANDING THE CONTENT OF AN OUTLINE using notes.pptx
EPANDING THE CONTENT OF AN OUTLINE using notes.pptxEPANDING THE CONTENT OF AN OUTLINE using notes.pptx
EPANDING THE CONTENT OF AN OUTLINE using notes.pptx
 
Class 11 Legal Studies Ch-1 Concept of State .pdf
Class 11 Legal Studies Ch-1 Concept of State .pdfClass 11 Legal Studies Ch-1 Concept of State .pdf
Class 11 Legal Studies Ch-1 Concept of State .pdf
 
History Class XII Ch. 3 Kinship, Caste and Class (1).pptx
History Class XII Ch. 3 Kinship, Caste and Class (1).pptxHistory Class XII Ch. 3 Kinship, Caste and Class (1).pptx
History Class XII Ch. 3 Kinship, Caste and Class (1).pptx
 
Final demo Grade 9 for demo Plan dessert.pptx
Final demo Grade 9 for demo Plan dessert.pptxFinal demo Grade 9 for demo Plan dessert.pptx
Final demo Grade 9 for demo Plan dessert.pptx
 
Hybridoma Technology ( Production , Purification , and Application )
Hybridoma Technology  ( Production , Purification , and Application  ) Hybridoma Technology  ( Production , Purification , and Application  )
Hybridoma Technology ( Production , Purification , and Application )
 
Sanyam Choudhary Chemistry practical.pdf
Sanyam Choudhary Chemistry practical.pdfSanyam Choudhary Chemistry practical.pdf
Sanyam Choudhary Chemistry practical.pdf
 
The Most Excellent Way | 1 Corinthians 13
The Most Excellent Way | 1 Corinthians 13The Most Excellent Way | 1 Corinthians 13
The Most Excellent Way | 1 Corinthians 13
 
Painted Grey Ware.pptx, PGW Culture of India
Painted Grey Ware.pptx, PGW Culture of IndiaPainted Grey Ware.pptx, PGW Culture of India
Painted Grey Ware.pptx, PGW Culture of India
 
SOCIAL AND HISTORICAL CONTEXT - LFTVD.pptx
SOCIAL AND HISTORICAL CONTEXT - LFTVD.pptxSOCIAL AND HISTORICAL CONTEXT - LFTVD.pptx
SOCIAL AND HISTORICAL CONTEXT - LFTVD.pptx
 
Computed Fields and api Depends in the Odoo 17
Computed Fields and api Depends in the Odoo 17Computed Fields and api Depends in the Odoo 17
Computed Fields and api Depends in the Odoo 17
 
CARE OF CHILD IN INCUBATOR..........pptx
CARE OF CHILD IN INCUBATOR..........pptxCARE OF CHILD IN INCUBATOR..........pptx
CARE OF CHILD IN INCUBATOR..........pptx
 
18-04-UA_REPORT_MEDIALITERAСY_INDEX-DM_23-1-final-eng.pdf
18-04-UA_REPORT_MEDIALITERAСY_INDEX-DM_23-1-final-eng.pdf18-04-UA_REPORT_MEDIALITERAСY_INDEX-DM_23-1-final-eng.pdf
18-04-UA_REPORT_MEDIALITERAСY_INDEX-DM_23-1-final-eng.pdf
 
Introduction to AI in Higher Education_draft.pptx
Introduction to AI in Higher Education_draft.pptxIntroduction to AI in Higher Education_draft.pptx
Introduction to AI in Higher Education_draft.pptx
 
Science lesson Moon for 4th quarter lesson
Science lesson Moon for 4th quarter lessonScience lesson Moon for 4th quarter lesson
Science lesson Moon for 4th quarter lesson
 
How to Configure Email Server in Odoo 17
How to Configure Email Server in Odoo 17How to Configure Email Server in Odoo 17
How to Configure Email Server in Odoo 17
 
ENGLISH5 QUARTER4 MODULE1 WEEK1-3 How Visual and Multimedia Elements.pptx
ENGLISH5 QUARTER4 MODULE1 WEEK1-3 How Visual and Multimedia Elements.pptxENGLISH5 QUARTER4 MODULE1 WEEK1-3 How Visual and Multimedia Elements.pptx
ENGLISH5 QUARTER4 MODULE1 WEEK1-3 How Visual and Multimedia Elements.pptx
 

Round 5Dec. 31, 2018 C58538AndrewsEugene EllisPhili.docx

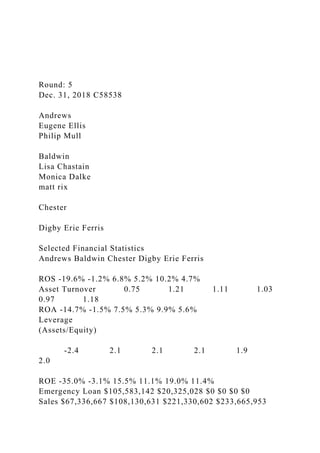
  • 1. Round: 5 Dec. 31, 2018 C58538 Andrews Eugene Ellis Philip Mull Baldwin Lisa Chastain Monica Dalke matt rix Chester Digby Erie Ferris Selected Financial Statistics Andrews Baldwin Chester Digby Erie Ferris ROS -19.6% -1.2% 6.8% 5.2% 10.2% 4.7% Asset Turnover 0.75 1.21 1.11 1.03 0.97 1.18 ROA -14.7% -1.5% 7.5% 5.3% 9.9% 5.6% Leverage (Assets/Equity) -2.4 2.1 2.1 2.1 1.9 2.0 ROE -35.0% -3.1% 15.5% 11.1% 19.0% 11.4% Emergency Loan $105,583,142 $20,325,028 $0 $0 $0 $0 Sales $67,336,667 $108,130,631 $221,330,602 $233,665,953
  • 2. $220,090,490 $242,146,784 EBIT $2,460,785 $4,571,252 $35,109,568 $32,357,440 $47,748,831 $29,612,346 Profits ($13,191,015) ($1,297,803) $15,037,220 $12,174,914 $22,360,139 $11,495,535 Cumulative Profit ($90,335,004) ($1,743,807) $62,774,268 $63,774,089 $57,636,889 $56,805,581 SG&A / Sales 11.1% 7.3% 9.8% 11.1% 6.7% 9.1% Contrib. Margin % 6.9% 18.6% 32.1% 31.7% 36.2% 26.2% CAPSTONE® COURIER Page 1 Stock & Bonds C58538 Round: 5Dec. 31, 2018 Stock Market Summary Company Close Change Shares MarketCap ($M) Book Value EPS Dividend Yield P/E Andrews $1.00 $0.00 2,291,939 $2 ($16.42) ($5.76) $0.00 0.0% -0.2 Baldwin $6.27 $1.26 2,000,000 $13 $21.00 ($0.65) $0.00 0.0% -9.7 Chester $89.62 $12.03 2,124,345 $190 $45.75 $7.08 $2.27 2.5% 12.7 Digby $88.94 $5.88 2,089,792 $186 $52.65 $5.83 $0.00 0.0% 15.3 Erie $84.15 $27.36 2,452,736 $206 $48.02 $9.12 $0.00 0.0% 9.2 Ferris $73.41 $5.35 2,187,083 $161 $45.97 $5.26 $0.00 0.0% 14.0
  • 3. Bond Market Summary Company Series# Face Yield Close$ S&P Company Series# Face Yield Close$ S&P Andrews Digby 14.0S2019 $20,850,000 14.2% 98.45 DDD 14.0S2019 $20,850,000 14.0% 100.09 B Baldwin 11.6S2025 $3,523,690 12.9% 90.11 B 14.0S2019 $20,850,000 14.0% 99.91 CCC 12.2S2026 $8,623,471 13.2% 92.09 B Chester 12.9S2027 $16,806,601 13.6% 95.04 B 14.0S2019 $20,850,000 14.0% 100.09 B 13.4S2028 $15,253,268 13.8% 97.38 B 12.1S2026 $13,308,235 13.2% 91.62 B Erie 12.9S2027 $12,249,416 13.6% 95.04 B 14.0S2019 $20,850,000 13.9% 100.44 B 13.4S2028 $10,916,191 13.8% 97.38 B 11.7S2025 $1,722,021 12.7% 92.16 B 12.3S2026 $11,199,852 13.0% 94.34 B 13.0S2027 $25,774,968 13.3% 97.48 B 13.5S2028 $15,359,294 13.5% 100.00 B Ferris 14.0S2019 $20,850,000 14.0% 100.09 B 12.2S2026 $8,738,656 13.2% 92.09 B 12.9S2027 $15,268,932 13.6% 95.04 B 13.4S2028 $14,780,458 13.8% 97.38 B Next Year's Prime Rate 9.50% CAPSTONE® COURIER Page 2
  • 4. Financial Summary C58538 Round: 5Dec. 31, 2018 Cash Flow Statement Survey Andrews Baldwin Chester Digby Erie Ferris CashFlows from operating activities Net Income(Loss) ($13,191) ($1,298) $15,037 $12,175 $22,360 $11,496 Adjustment for non-cash items: Depreciation $4,588 $7,587 $13,793 $15,000 $16,053 $11,400 Extraordinary gains/losses/writeoffs ($9,895) $0 $0 $0 $0 ($550) Changes in current assets and liablilities Acounts payable ($3,984) ($2,083) $2,698 $1,775 $3,267 $3,856 Inventory $45,914 $8,396 ($8,052) ($10,962) $904 ($10,284) Accounts Receivable $571 $1 ($1,935) ($549) ($4,638) ($3,400) Net cash from operations $24,003 $12,603 $21,541 $17,439 $37,946 $12,518 Cash flows from investing activities Plant improvements(net) $25,726 $0 ($43,600) ($54,100) ($50,500) ($44,570) Cash flows from financing activities Dividends paid $0 $0 ($4,824) $0 $0 $0 Sales of common stock $0 $0 $0 $2,979 $8,013 $5,433 Purchase of common stock $0 $0 $0 $0 $0 $0 Cash from long term debt issued $0 $0 $10,916 $15,253 $15,359 $14,780 Early retirement of long term debt $0 $0 $0 $0 $0 $0 Retirement of current debt ($155,312) ($32,928) ($35,285) ($39,209) ($27,955) ($30,911) Cash from current debt borrowing $0 $0 $32,758 $38,773 $22,515 $30,255 Cash from emergency loan $105,583 $20,325 $0 $0 $0 $0
  • 5. Net cash from financing activities ($49,728) ($12,603) $3,565 $17,796 $17,932 $19,558 Net change in cash position $0 $0 ($18,493) ($18,865) $5,378 ($12,495) Balance Sheet Survey Andrews Baldwin Chester Digby Erie Ferris Cash $0 $0 $35,035 $35,068 $49,536 $31,007 Accounts Receivable $5,535 $8,887 $18,192 $19,205 $18,090 $19,902 Inventory $61,098 $42,492 $20,052 $28,816 $4,387 $23,994 Total Current Assets $66,633 $51,380 $73,279 $83,090 $72,012 $74,903 Plant and equipment $68,822 $113,800 $206,900 $225,000 $240,800 $187,800 Accumulated Depreciation ($45,881) ($75,867) ($80,100) ($80,500) ($86,200) ($56,980) Total Fixed Assets $22,941 $37,933 $126,800 $144,500 $154,600 $130,820 Total Assets $89,573 $89,313 $200,079 $227,590 $226,612 $205,723 Account Payable $776 $6,128 $12,817 $13,726 $11,416 $15,301 CurrentDebt $105,583 $20,325 $32,758 $38,773 $22,515 $30,255 Long Term Debt $20,850 $20,850 $57,324 $65,057 $74,906 $59,638 Total Liabilities $127,209 $47,303 $102,899 $117,556 $108,837 $105,194 Common Stock $28,360 $18,360 $23,767 $23,657 $40,177 $30,294 Retained Earnings ($65,996) $23,650 $73,412 $86,377 $77,598
  • 6. $70,235 Total Equity ($37,636) $42,010 $97,179 $110,034 $117,775 $100,530 Total Liabilities & Owners'' Equity $89,573 $89,313 $200,079 $227,590 $226,612 $205,723 Income Statement Survey Andrews Baldwin Chester Digby Erie Ferris Sales $67,337 $108,131 $221,331 $233,666 $220,090 $242,147 Variable Costs(Labor,Material,Carry) $62,690 $88,058 $150,295 $159,498 $140,330 $178,752 Depreciation $4,588 $7,587 $13,793 $15,000 $16,053 $11,400 SGA(R&D,Promo,Sales,Admin) $7,492 $7,914 $21,587 $25,899 $14,790 $21,922 Other(Fees,Writeoffs,TQM,Bonuses) ($9,895) $0 $546 $912 $1,169 $461 EBIT $2,461 $4,571 $35,110 $32,357 $47,749 $29,612 Interest(Short term,Long term) $22,755 $6,568 $11,503 $13,245 $12,647 $11,566 Taxes ($7,103) ($699) $8,262 $6,690 $12,286 $6,316 Profit Sharing $0 $0 $307 $248 $456 $235 Net Profit ($13,191) ($1,298) $15,037 $12,175 $22,360 $11,496 CAPSTONE® COURIER Page 3 Production Analysis C58538 Round: 5Dec. 31, 2018 Name Primary Segment Units Sold
  • 7. Unit Inven tory Revision Date Age Dec.31 MTBF Pfmn Coord Size Coord Price Material Cost Labor Cost Contr. Marg. 2nd Shift & Over- time Auto mation Next Round
  • 8. Capacity Next Round Plant Utiliz. Able Trad 959 2,397 7/4/2018 2.3 20000 6.0 13.0 $23.50 $0.00 $0.00 -9% 0% 4.0 1 0% Acre Low 1,515 0 7/10/2018 2.4 15000 4.5 17.0 $17.40 $5.82 $8.13 15% 0% 5.0 1,400 7% Adam Size 244 221 5/23/2018 2.1 22000 8.9 8.8 $33.00 $12.70 $10.83 18% 0% 3.0 900 6% Aft Pfmn 92 56 6/5/2018 2.1 22000 11.8 14.5 $29.90 $12.12 $10.83 15% 0% 3.0 300 50% Agape Size 262 322 6/10/2018 2.3 20000 5.8 8.0 $29.00 $11.68 $10.83 10% 0% 3.0 600 25% Baker Trad 1,949 478 8/16/2018 2.0 17500 7.5 12.2 $25.00 $9.44 $9.46 23% 0% 4.0 1,800 99% Bead Low 2,609 395 5/25/2009 9.6 14000 3.0 17.0 $18.50 $4.82 $9.85 18% 82% 5.0 1,400 180% Bid High 49 868 6/9/2016 4.1 22000 9.9 10.0 $36.50 $0.00 $0.00 -107% 0% 3.0 900 0% Bold Pfmn 137 38 7/16/2016 3.9 26000 11.4 15.1 $33.00 $13.02 $10.81 24% 0% 3.0 600 25% Buddy Size 146 270 5/4/2017 3.3 19000 5.4 8.6 $33.00 $0.00 $0.00 20% 0% 3.0 600 0% Cake Trad 1,994 0 9/14/2017 2.4 14000 7.8 12.2 $25.50 $8.51 $8.36 33% 100% 6.5 1,300 198% Cedar Low 2,806 311 2/5/2020 9.6 12000 3.0 17.0 $18.50 $4.22 $4.68 50% 49% 8.5 1,900 147% Cid High 1,194 354 11/15/2018 1.1 23000 13.6 6.4 $36.50 $15.67 $12.75 21% 61% 3.5 1,150 160%
  • 9. Coat Pfmn 1,049 145 12/14/2018 1.2 27000 14.7 12.3 $31.50 $15.53 $9.35 21% 16% 5.0 1,150 115% Cure Size 1,332 173 12/14/2018 1.2 17000 7.7 5.3 $31.50 $12.53 $9.97 29% 40% 5.0 1,400 139% Daze Trad 1,957 193 9/18/2018 1.4 19000 8.9 11.2 $28.50 $10.82 $9.20 30% 100% 6.0 1,300 198% Dell Low 1,783 361 6/19/2019 9.6 14000 3.0 17.0 $21.00 $4.82 $4.98 51% 13% 8.0 1,600 111% Dixie High 845 352 1/1/2018 2.1 25000 13.5 6.5 $38.50 $16.19 $11.06 25% 5% 3.5 1,100 104% Dot Pfmn 945 150 10/6/2018 1.3 27000 14.8 12.1 $33.50 $15.62 $9.45 24% 0% 4.5 1,100 99% Dune Size 1,350 195 1/9/2019 2.3 19000 7.2 6.4 $33.50 $12.47 $10.25 30% 22% 4.5 1,450 121% Doom Pfmn 928 151 11/30/2018 1.0 27000 14.7 12.2 $33.50 $15.55 $7.98 29% 62% 6.0 1,200 160% Dust 0 0 5/25/2018 0.6 19000 7.8 5.4 $0.00 $0.00 $0.00 0% 0% 1.0 600 0% Eat Low 1,973 119 1/15/2018 5.1 12500 5.5 14.5 $20.00 $6.29 $4.56 43% 36% 8.5 1,400 134% Ebb Low 3,224 246 6/18/2019 9.6 12000 3.0 17.0 $18.00 $4.22 $4.94 47% 86% 8.5 2,000 184% Echo Trad 2,235 42 10/19/2018 1.3 14000 8.5 11.5 $25.50 $9.05 $7.52 35% 100% 6.5 1,700 198% Egg Trad 2,573 2 10/30/2018 1.4 15000 8.7 11.3 $25.50 $9.50 $10.03 24% 100% 5.5 1,800 198% Fast Low 877 0 1/29/2017 5.1 12000 5.5 14.5 $20.50 $6.14 $11.71 12% 100% 4.0 400 198% Feat Low 1,161 262 7/27/2018 5.0 27000 13.8 12.9 $22.50 $14.95 $7.12 24% 13% 6.0 1,250 112% Fist High 1,576 263 12/26/2018 1.0 25000 13.7 6.4 $37.50 $16.31 $13.38 21% 100% 4.0 1,150 198% Foam Pfmn 1,012 128 10/19/2018 1.2 27000 14.8 12.1 $32.50
  • 10. $15.62 $8.84 24% 24% 5.5 950 122% Fume Size 1,347 157 11/19/2018 1.1 17000 7.4 4.8 $32.50 $12.72 $9.25 32% 42% 5.5 1,100 141% Fox High 1,661 221 11/16/2018 0.9 25000 13.9 6.1 $37.50 $16.50 $8.54 33% 46% 5.5 1,500 145% Fuel 0 0 6/3/2019 0.0 0 0.0 0.0 $0.00 $0.00 $0.00 0% 0% 5.5 600 0% CAPSTONE® COURIER Page 4 Traditional Segment Analysis C58538 Round: 5Dec. 31, 2018 Traditional Statistics Total Industry Unit Demand 11,471 Actual Industry Unit Sales 11,471 Segment % of Total Industry 27.5% Next Year's Segment Growth Rate 9.2% Traditional Customer Buying Criteria Expectations Importance 1. Age Ideal Age = 2.0 47% 2. Price $17.50 - 27.50 23% 3. Ideal Position Pfmn 8.5 Size 11.5 21% 4. Reliability MTBF 14000-19000 9% Top Products in Traditional Segment Name Market Share Units
  • 12. Dec. Cust. Survey Egg 22% 2,573 10/30/2018 8.7 11.3 $25.50 15000 1.43 $1,500 87% $1,056 77% 38 Echo 19% 2,235 10/19/2018 8.5 11.5 $25.50 14000 1.26 $1,500 87% $1,056 77% 33 Cake 17% 1,994 9/14/2017 YES 7.8 12.2 $25.50 14000 2.45 $1,300 78% $1,930 55% 30 Daze 17% 1,957 9/18/2018 8.9 11.2 $28.50 19000 1.36 $1,350 84% $1,556 45% 25 Baker 16% 1,865 8/16/2018 7.5 12.2 $25.00 17500 1.96 $1,350 74% $1,350 35% 33 Able 7% 759 7/4/2018 6.0 13.0 $23.50 20000 2.27 $200 22% $200 14% 11 Eat 1% 64 1/15/2018 5.5 14.5 $20.00 12500 5.09 $1,500 89% $1,056 77% 0 Fast 0% 25 1/29/2017 YES 5.5 14.5 $20.50 12000 5.08 $500 45% $715 18% 0 CAPSTONE® COURIER Page 5 Low End Segment Analysis C58538 Round: 5Dec. 31, 2018 Low End Statistics Total Industry Unit Demand 15,581 Actual Industry Unit Sales 15,581 Segment % of Total Industry 37.3% Next Year's Segment Growth Rate 11.7% Low End Customer Buying Criteria Expectations Importance
  • 13. 1. Price $12.50 - 22.50 53% 2. Age Ideal Age = 7.0 24% 3. Ideal Position Pfmn 4.2 Size 15.8 16% 4. Reliability MTBF 12000-17000 7% Top Products in Low End Segment Name Market Share Units Sold to Seg Revision Date Stock Out Pfmn Coord Size Coord List Price MTBF Age Dec.31 Promo Budget
  • 14. Cust. Aware- ness Sales Budget Cust. Access- ibility Dec. Cust. Survey Ebb 21% 3,224 6/18/2019 3.0 17.0 $18.00 12000 9.60 $1,500 88% $1,056 61% 13 Cedar 18% 2,806 2/5/2020 3.0 17.0 $18.50 12000 9.60 $1,300 78% $2,026 56% 11 Bead 17% 2,609 5/25/2009 3.0 17.0 $18.50 14000 9.60 $1,350 69% $1,350 42% 11 Eat 12% 1,909 1/15/2018 5.5 14.5 $20.00 12500 5.09 $1,500 89% $1,056 61% 13 Dell 11% 1,783 6/19/2019 3.0 17.0 $21.00 14000 9.60 $1,350 83% $1,556 49% 7 Acre 10% 1,515 7/10/2018 YES 4.5 17.0 $17.40 15000 2.44 $200 21% $200 13% 8 Fast 5% 852 1/29/2017 YES 5.5 14.5 $20.50 12000 5.08 $500 45% $715 58% 8 Feat 4% 597 7/27/2018 13.8 12.9 $22.50 27000 5.01 $1,400 80% $1,287 58% 0 Able 1% 201 7/4/2018 6.0 13.0 $23.50 20000 2.27 $200 22% $200 13% 1 Baker 1% 84 8/16/2018 7.5 12.2 $25.00 17500 1.96 $1,350
  • 15. 74% $1,350 42% 0 CAPSTONE® COURIER Page 6 High End Segment Analysis C58538 Round: 5Dec. 31, 2018 High End Statistics Total Industry Unit Demand 5,410 Actual Industry Unit Sales 5,410 Segment % of Total Industry 13.0% Next Year's Segment Growth Rate 16.2% High End Customer Buying Criteria Expectations Importance 1. Ideal Position Pfmn 13.4 Size 6.6 43% 2. Age Ideal Age = 0.0 29% 3. Reliability MTBF 20000-25000 19% 4. Price $27.50 - 37.50 9% Top Products in High End Segment Name Market Share Units Sold to Seg Revision Date
  • 17. Fist 29% 1,576 12/26/2018 13.7 6.4 $37.50 25000 1.03 $1,450 85% $1,287 73% 56 Cid 22% 1,194 11/15/2018 13.6 6.4 $36.50 23000 1.12 $1,250 73% $2,026 56% 41 Dixie 16% 845 1/1/2018 13.5 6.5 $38.50 25000 2.07 $1,375 84% $1,653 47% 29 Adam 2% 86 5/23/2018 8.9 8.8 $33.00 22000 2.12 $200 24% $200 13% 1 Bid 1% 49 6/9/2016 9.9 10.0 $36.50 22000 4.14 $0 40% $0 14% 0 CAPSTONE® COURIER Page 7 Performance Segment Analysis C58538 Round: 5Dec. 31, 2018 Performance Statistics Total Industry Unit Demand 4,726 Actual Industry Unit Sales 4,726 Segment % of Total Industry 11.3% Next Year's Segment Growth Rate 19.8% Performance Customer Buying Criteria Expectations Importance 1. Reliability MTBF 22000-27000 43% 2. Ideal Position Pfmn 14.4 Size 12.5 29% 3. Price $22.50 - 32.50 19% 4. Age Ideal Age = 1.0 9% Top Products in Performance Segment Name Market
  • 19. ibility Dec. Cust. Survey Coat 22% 1,049 12/14/2018 14.7 12.3 $31.50 27000 1.23 $1,200 71% $1,833 48% 45 Foam 21% 1,012 10/19/2018 14.8 12.1 $32.50 27000 1.24 $1,400 83% $1,287 36% 41 Dot 20% 945 10/6/2018 14.8 12.1 $33.50 27000 1.28 $1,350 82% $1,653 57% 38 Doom 20% 928 11/30/2018 14.7 12.2 $33.50 27000 0.97 $1,350 74% $1,653 57% 37 Feat 12% 564 7/27/2018 13.8 12.9 $22.50 27000 5.01 $1,400 80% $1,287 36% 49 Bold 3% 137 7/16/2016 11.4 15.1 $33.00 26000 3.92 $0 16% $0 8% 5 Aft 2% 92 6/5/2018 11.8 14.5 $29.90 22000 2.05 $100 22% $100 10% 2 CAPSTONE® COURIER Page 8 Size Segment Analysis C58538 Round: 5Dec. 31, 2018 Size Statistics Total Industry Unit Demand 4,596 Actual Industry Unit Sales 4,596 Segment % of Total Industry 11.0% Next Year's Segment Growth Rate 18.3% Size Customer Buying Criteria
  • 20. Expectations Importance 1. Ideal Position Pfmn 7.5 Size 5.6 43% 2. Age Ideal Age = 1.5 29% 3. Reliability MTBF 16000-21000 19% 4. Price $22.50 - 32.50 9% Top Products in Size Segment Name Market Share Units Sold to Seg Revision Date Stock Out Pfmn Coord Size Coord List Price MTBF Age Dec.31 Promo
  • 21. Budget Cust. Aware- ness Sales Budget Cust. Access- ibility Dec. Cust. Survey Dune 29% 1,350 1/9/2019 7.2 6.4 $33.50 19000 2.29 $1,350 82% $1,653 42% 24 Fume 29% 1,347 11/19/2018 7.4 4.8 $32.50 17000 1.14 $1,400 83% $1,287 37% 27 Cure 29% 1,332 12/14/2018 7.7 5.3 $31.50 17000 1.19 $1,200 72% $1,833 49% 37 Agape 6% 262 6/10/2018 5.8 8.0 $29.00 20000 2.32 $200 23% $200 13% 7 Adam 3% 159 5/23/2018 8.9 8.8 $33.00 22000 2.12 $200 24% $200 13% 5 Buddy 3% 146 5/4/2017 5.4 8.6 $33.00 19000 3.29 $0 30% $0 14% 2 CAPSTONE® COURIER Page 9 Market Share C58538 Round: 5Dec. 31, 2018
  • 22. Actual Market Share in Units Potential Market Share in Units Trad Low High Pfmn Size Total Trad Low High Pfmn Size Total Industry Unit Sales 11,471 15,581 5,410 4,726 4,596 41,784 Units Demanded 11,471 15,581 5,410 4,726 4,596 41,784 % of Market 27.5% 37.3% 13.0% 11.3% 11.0% 100.0% % of Market 27.5% 37.3% 13.0% 11.3% 11.0% 100.0% Able 6.6% 1.3% 2.3% Able 5.3% 1.3% 1.9% Acre 9.7% 3.6% Acre 9.8% 3.7% Adam 1.6% 3.5% 0.6% Adam 1.6% 3.5% 0.6% Aft 2.0% 0.2% Aft 3.5% 0.4% Agape 5.7% 0.6% Agape 5.7% 0.6% Total 6.6% 11.0% 1.6% 2.0% 9.2% 7.4% Total 5.3% 11.1% 1.6% 3.5% 9.2% 7.2% Baker 16.3% 0.5% 4.7% Baker 13.2% 0.5% 3.8% Bead 16.8% 6.3% Bead 16.3% 6.1% Bid 0.9% 0.1% Bid 0.9% Bold 2.9% 0.3% Bold 2.9% 0.3% Buddy 3.2% 0.4% Buddy 3.2% 0.3% Total 16.3% 17.3% 0.9% 2.9% 3.2% 11.7% Total 13.2% 16.9% 0.9% 2.9% 3.2% 10.7% Cake 17.4% 4.8% Cake 19.5% 5.4% Cedar 18.0% 6.7% Cedar 17.6% 6.6% Cid 22.1% 2.9% Cid 22.1% 2.9% Coat 22.2% 2.5% Coat 21.8% 2.5% Cure 29.0% 3.2% Cure 29.0% 3.2% Total 17.4% 18.0% 22.1% 22.2% 29.0% 20.0% Total 19.5% 17.6% 22.1% 21.8% 29.0% 20.4% Daze 17.1% 4.7% Daze 15.4% 4.2% Dell 11.4% 4.3% Dell 11.2% 4.2%
  • 23. Dixie 15.6% 2.0% Dixie 15.6% 2.0% Dot 20.0% 2.3% Dot 19.6% 2.2% Dune 29.4% 3.2% Dune 29.4% 3.2% Doom 19.6% 2.2% Doom 19.3% 2.2% Total 17.1% 11.4% 15.6% 39.6% 29.4% 18.7% Total 15.4% 11.2% 15.6% 38.9% 29.4% 18.0% Eat 0.6% 12.2% 4.7% Eat 0.4% 11.8% 4.5% Ebb 20.7% 7.7% Ebb 20.2% 7.5% Echo 19.5% 5.3% Echo 21.8% 6.0% Egg 22.4% 6.2% Egg 24.2% 6.6% Total 42.5% 32.9% 23.9% Total 46.4% 32.0% 24.7% Fast 0.2% 5.5% 2.1% Fast 0.2% 7.4% 2.8% Feat 3.8% 11.9% 2.8% Feat 3.8% 11.9% 2.8% Fist 29.1% 3.8% Fist 29.1% 3.8% Foam 21.4% 2.4% Foam 21.0% 2.4% Fume 29.3% 3.2% Fume 29.3% 3.2% Fox 30.7% 4.0% Fox 30.7% 4.0% Total 0.2% 9.3% 59.8% 33.3% 29.3% 18.3% Total 0.2% 11.2% 59.8% 33.0% 29.3% 18.9% CAPSTONE® COURIER Page 10 Perceptual Map C58538 Round: 5Dec. 31, 2018 Andrews Baldwin Chester Name Pfmn Size Revised Name Pfmn Size Revised Name Pfmn Size Revised Able 6.0 13.0 7/4/2018 Baker 7.5 12.2 8/16/2018 Cake 7.8 12.2 9/14/2017 Acre 4.5 17.0 7/10/2018 Bead 3.0 17.0 5/25/2009 Cedar 3.0 17.0 2/5/2020 Adam 8.9 8.8 5/23/2018 Bid 9.9 10.0 6/9/2016 Cid
  • 24. 13.6 6.4 11/15/2018 Aft 11.8 14.5 6/5/2018 Bold 11.4 15.1 7/16/2016 Coat 14.7 12.3 12/14/2018 Agape 5.8 8.0 6/10/2018 Buddy 5.4 8.6 5/4/2017 Cure 7.7 5.3 12/14/2018 Abum 5.5 14.8 4/7/2018 Ajoy 6.1 14.8 2/18/2018 Apps 5.9 14.5 3/31/2018 Digby Erie Ferris Name Pfmn Size Revised Name Pfmn Size Revised Name Pfmn Size Revised Daze 8.9 11.2 9/18/2018 Eat 5.5 14.5 1/15/2018 Fast 5.5 14.5 1/29/2017 Dell 3.0 17.0 6/19/2019 Ebb 3.0 17.0 6/18/2019 Feat 13.8 12.9 7/27/2018 Dixie 13.5 6.5 1/1/2018 Echo 8.5 11.5 10/19/2018 Fist 13.7 6.4 12/26/2018 Dot 14.8 12.1 10/6/2018 Egg 8.7 11.3 10/30/2018 Foam 14.8 12.1 10/19/2018 Dune 7.2 6.4 1/9/2019 Fume 7.4 4.8 11/19/2018 Doom 14.7 12.2 11/30/2018 Fox 13.9 6.1 11/16/2018 Dust 7.8 5.4 5/25/2018 CAPSTONE® COURIER Page 11 HR/TQM Report C58538 Round: 5Dec. 31, 2018 HUMAN RESOURCES SUMMARY Andrews Baldwin Chester Digby Erie Ferris Needed Complement 82 700 1,108 1,151 995 1,215 Complement 82 700 1,108 1,151 995 1,215 1st Shift Complement 82 534 731 896 539 800
  • 25. 2nd Shift Complement 0 166 377 255 456 415 Overtime Percent 0.0% 0.0% 0.0% 0.0% 0.0% 0.0% Turnover Rate 10.0% 10.0% 10.0% 10.0% 10.0% 10.0% New Employees 8 70 322 240 335 309 Separated Employees 449 211 0 0 0 0 Recruiting Spend $0 $0 $0 $0 $0 $0 Training Hours 0 0 0 0 0 0 Productivity Index 100.0% 100.0% 100.0% 100.0% 100.0% 100.0% Recruiting Cost $8 $70 $322 $240 $335 $309 Separation Cost $2,245 $1,055 $0 $0 $0 $0 Training Cost $0 $0 $0 $0 $0 $0 Total HR Admin Cost $2,253 $1,125 $322 $240 $335 $309 Labor Contract Next Year Wages $26.81 $26.81 $26.81 $26.81 $26.81 $26.81 Benefits 2,500 2,500 2,500 2,500 2,500 2,500 Profit Sharing 2.0% 2.0% 2.0% 2.0% 2.0% 2.0% Annual Raise 5.0% 5.0% 5.0% 5.0% 5.0% 5.0% Starting Negotiation Position Wages Benefits Profit Sharing Annual Raise Ceiling Negotiation Position Wages Benefits Profit Sharing Annual Raise Adjusted Labor Demands Wages
  • 26. Benefits Profit Sharing Annual Raise Strike Days TQM SUMMARY Andrews Baldwin Chester Digby Erie Ferris Process Mgt Budgets Last Year CPI Systems $0 $0 $0 $0 $0 $0 Vendor/JIT $0 $0 $0 $0 $0 $0 Quality Initiative Training $0 $0 $0 $0 $0 $0 Channel Support Systems $0 $0 $0 $0 $0 $0 Concurrent Engineering $0 $0 $0 $0 $0 $0 UNEP Green Programs $0 $0 $0 $0 $0 $0 TQM Budgets Last Year Benchmarking $0 $0 $0 $0 $0 $0 Quality Function Deployment Effort $0 $0 $0 $0 $0 $0 CCE/6 Sigma Training $0 $0 $0 $0 $0 $0 GEMI TQEM Sustainability Initiatives $0 $0 $0 $0 $0 $0 Total Expenditures $0 $0 $0 $0 $0 $0 Cumulative Impacts Material Cost Reduction 0.00% 0.00% 0.00% 0.00% 0.00% 0.00% Labor Cost Reduction 0.00% 0.00% 0.00% 0.00% 0.00% 0.00% Reduction R&D Cycle Time 0.00% 0.00% 0.00% 0.00% 0.00% 0.00% Reduction Admin Costs 0.00% 0.00% 0.00% 0.00% 0.00% 0.00% Demand Increase 0.00% 0.00% 0.00% 0.00% 0.00% 0.00% CAPSTONE® COURIER Page 12
  • 27. Ethics Report C58538 Round: 5Dec. 31, 2018 ETHICS SUMMARY Other (Fees, Writeoffs, etc.) The actual dollar impact. Example, $120 means Other increased by $120. Demand Factor The % of normal. 98% means demand fell 2%. Material Cost Impact The % of normal. 104% means matieral costs rose 4%. Admin Cost Impact The % of normal. 103% means admin costs rose 3%. Productivity Impact The % of normal. 104% means productivity increased by 4%. Awareness Impact The % of normal. 105% means normal awareness was multiplied by 1.05. Accessibility Impact The % of normal. 98% means normal accessiblity was multiplied by 0.98. Normal means the value that would have been produced if the problem had not been presented. No Impact Andrews Baldwin Chester Digby Erie Ferris Total Other (Fees, Writeoffs, etc.) $0 $0 $0 $0 $0 $0 $0 Demand Factor 100% 100% 100% 100% 100% 100% 100% Material Cost Impact 100% 100% 100% 100% 100% 100% 100% Admin Cost Impact 100% 100% 100% 100% 100% 100% 100% Productivity Impact 100% 100% 100% 100% 100% 100% 100% Awareness Impact 100% 100% 100% 100% 100% 100% 100% Accessibility Impact 100% 100% 100% 100% 100% 100% 100% CAPSTONE® COURIER Page 13
  • 28. Annual Report Annual Report Andrews C58538 Round: 5Dec. 31, 2018 Balance Sheet DEFINITIONS: Common Size: The common size column simply represents each item as a percentage of total assets for that year. Cash: Your end-of-year cash position. Accounts Receivable: Reflects the lag between delivery and payment of your products. Inventories: The current value of your inventory across all products. A zero indicates your company stocked out. Unmet demand would, of course, fall to your competitors. Plant & Equipment: The current value of your plant. Accum Deprec: The total accumulated depreciation from your plant. Accts Payable: What the company currently owes suppliers for materials and services. Current Debt: The debt the company is obligated to pay during the next year of operations. It includes emergency loans used to keep your company solvent should you run out of cash during the year. Long Term Debt: The company's long term debt is in the form of bonds, and this represents the total value of your bonds. Common Stock: The amount of capital invested by shareholders in the company. Retained Earnings: The profits that the company chose to keep instead of paying to shareholders as dividends.
  • 29. ASSETS 2018 Common Size 2017 Cash $0 0.0% $0 Account Receivable $5,535 6.2% $6,105 Inventory $61,098 68.2% $107,012 Total Current Assets $66,633 74.4% $113,117 Plant & Equipment $68,822 76.8% $108,400 Accumulated Depreciation ($45,881) -51.2% ($65,040) Total Fixed Assets $22,941 25.6% $43,360 Total Assets $89,573 100.0% $156,477 LIABILITIES & OWNER'S EQUITY Accounts Payable $776 0.9% $4,760 Current Debt $105,583 118.0% $155,312 Long Term Debt $20,850 23.3% $20,850 Total Liabilities $127,209 142.0% $180,922 Common Stock $28,360 31.7% $28,360 Retained Earnings ($65,996) -73.7% ($52,805) Total Equity ($37,636) -42.0% ($24,445) Total Liab. & O. Equity $89,573 100.0% $156,477 Cash Flow Statement The Cash Flow Statement examines what happened in the Cash Account during the year. Cash injections appear as positive numbers and cash withdrawals as negative numbers. The Cash Flow Statement is an excellent tool for diagnosing emergency loans. When negative
  • 30. cash flows exceed positives, you are forced to seek emergency funding. For example, if sales are bad and you find yourself carrying an abundance of excess inventory, the report would show the increase in inventory as a huge negative cash flow. Too much unexpected inventory could outstrip your inflows, exhaust your starting cash and force you to beg for money to keep your company afloat. Cash Flows from Operating Activities 2018 2017 NetIncome(Loss) ($13,191) ($28,964) Depreciation $4,588 $7,227 Extraordinary gains/losses/writeoffs ($9,895) $0 Accounts Payable ($3,984) ($171) Inventory $45,914 $3,669 Accounts Receivable $571 ($355) Net cash from operation $24,003 ($18,594) Cash Flows from Investing Activities Plant Improvements $25,726 $0 Cash Flows from Financing Activities Dividends Paid $0 $0 Sales of Common Stock $0 $0 Purchase of Common Stock $0 $0 Cash from long term debt $0 $0 Retirement of long term debt $0 ($10,925) Change in current debt(net) ($49,728) $29,518 Net Cash from financing activities ($49,728) $18,594 Net Change in cash position $0 $0 Closing cash position $0 $0
  • 31. Annual Report Page 14 Annual Report Andrews C58538 Round: 5Dec. 31, 2018 2018 Income Statement (Product Name) Able Acre Adam Aft Agape Abum Ajoy Apps 2018 Total Common Size Sales $22,543 $26,364 $8,064 $2,757 $7,609 $0 $0 $0 $67,337 100.0% Variable Costs: Direct Labor $8,555 $11,719 $2,431 $999 $2,714 $0 $0 $0 $26,418 39.2% Direct Material $10,263 $10,689 $3,555 $1,190 $3,244 $0 $0 $0 $28,941 43.0% Inventory Carry $5,643 $0 $650 $160 $878 $0 $0 $0 $7,332 10.9% Total Variable $24,461 $22,408 $6,636 $2,350 $6,836 $0 $0 $0 $62,690 93.1% Contribution Margin ($1,918) $3,956 $1,428 $408 $773 $0 $0 $0 $4,647 6.9% Period Costs: Depreciation $1 $2,427 $1,080 $360 $720 $0 $0 $0 $4,588 6.8% SG&A: R&D $512 $530 $396 $432 $445 $269 $134 $249 $2,968 4.4% Promotions $200 $200 $200 $100 $200 $0 $0 $0 $900 1.3% Sales $200 $200 $200 $100 $200 $0 $0 $0 $900 1.3%
  • 32. Admin $912 $1,067 $326 $112 $308 $0 $0 $0 $2,725 4.0% Total Period $1,826 $4,423 $2,203 $1,104 $1,873 $269 $134 $249 $12,080 17.9% Net Margin ($3,744) ($467) ($775) ($696) ($1,101) ($269) ($134) ($249) ($7,434) -11.0% Definitions: Sales: Unit Sales times list price. Direct Labor: Labor costs incurred to produce the product that was sold. Inventory Carry Cost: the cost unsold goods in inventory. Depreciation: Calculated on straight-line. 15-year depreciation of plant value. R&D Costs: R&D department expenditures for each product. Admin: Administration overhead is estimated at 1.5% of sales. Promotions: The promotion budget for each product. Sales: The sales force budget for each product. Other: Chargs not included in other categories such as Fees, Write offs, and TQM. The fees include money paid to investment bankers and brokerage firms to issue new stocks or bonds plus consulting fees your instructor might assess. Write-offs include the loss you might experience when you sell capacity or liquidate inventory as the result of eliminating a production line. If the amount appears as a negative amount, then you actually made money on the liquidation of capacity or inventory. EBIT: Earnings Before Interest and Taxes. Short Term Interest: Interest expense based on last year''s current debt, including short term debt, long term notes that have become due, and emergency loans, Long Term Interest: Interest paid on outstanding bonds. Taxes: Income tax based upon a 35% tax rate. Profit Sharing: Profits shared with employees under the labor contract. Net Profit: EBIT minus interest, taxes, and profit sharing.
  • 33. Other ($9,895) -14.7% EBIT $2,461 3.7% Short Term Interest $19,836 29.5% Long Term Interest $2,919 4.3% Taxes ($7,103) -10.5% Profit Sharing $0 0.0% Net Profit ($13,191) -19.6% Annual Report Page 15 C58538Front PageStock & BondsFinancial SummaryProduction AnalysisTraditional Segment AnalysisLow End Segment AnalysisHigh End Segment AnalysisPerformance Segment AnalysisSize Segment AnalysisMarket SharePerceptual MapHR/TQM ReportEthics ReportAnnual ReportAndrewsBalance SheetIncome Statement Round: 4 Dec. 31, 2017 C58538 Andrews Eugene Ellis Philip Mull Baldwin Lisa Chastain Monica Dalke matt rix Chester Digby Erie Ferris Selected Financial Statistics Andrews Baldwin Chester Digby Erie Ferris
  • 34. ROS -39.0% -2.4% 9.1% 7.9% 6.2% 6.1% Asset Turnover 0.47 1.03 1.11 1.16 0.89 1.18 ROA -18.5% -2.5% 10.1% 9.2% 5.5% 7.2% Leverage (Assets/Equity) -6.4 2.4 2.1 2.1 2.1 2.0 ROE -118.5% -6.1% 20.8% 18.9% 11.6% 14.7% Emergency Loan $144,387,047 $19,028,216 $0 $0 $0 $0 Sales $74,279,337 $108,140,184 $197,793,741 $226,989,314 $163,657,275 $200,781,475 EBIT ($13,609,560) $3,692,335 $38,518,462 $39,191,926 $27,033,430 $28,824,169 Profits ($28,964,077) ($2,628,021) $18,059,732 $17,922,007 $10,154,948 $12,303,415 Cumulative Profit ($77,143,989) ($446,004) $47,737,048 $51,599,176 $35,276,750 $45,310,045 SG&A / Sales 8.4% 8.3% 9.4% 10.3% 8.7% 10.3% Contrib. Margin % -0.2% 18.7% 34.7% 32.9% 34.0% 29.7% CAPSTONE® COURIER Page 1 Stock & Bonds C58538 Round: 4Dec. 31, 2017 Stock Market Summary Company Close Change Shares MarketCap ($M)
  • 35. Book Value EPS Dividend Yield P/E Andrews $1.00 $0.00 2,291,939 $2 ($10.67) ($12.64) $0.00 0.0% -0.0 Baldwin $5.00 ($7.57) 2,000,000 $10 $21.65 ($1.31) $0.00 0.0% -3.8 Chester $77.59 $17.05 2,124,345 $165 $40.94 $8.50 $3.36 4.3% 9.1 Digby $83.06 $18.15 2,053,924 $171 $46.19 $8.73 $1.36 1.6% 9.5 Erie $56.79 $5.20 2,311,647 $131 $37.81 $4.39 $0.00 0.0% 12.9 Ferris $68.06 $6.77 2,107,251 $143 $39.67 $5.84 $0.00 0.0% 11.7 Bond Market Summary Company Series# Face Yield Close$ S&P Company Series# Face Yield Close$ S&P Andrews Digby 14.0S2019 $20,850,000 14.3% 97.89 DDD 14.0S2019 $20,850,000 13.9% 101.00 B Baldwin 11.6S2025 $3,523,690 12.7% 91.48 B 14.0S2019 $20,850,000 14.0% 99.67 CC 12.2S2026 $8,623,471 13.0% 93.93 B Chester 12.9S2027 $16,806,601 13.3% 97.33 B 14.0S2019 $20,850,000 13.9% 101.00 B Erie 12.1S2026 $13,308,235 13.0% 93.43 B 14.0S2019 $20,850,000 13.9% 100.83 CCC 12.9S2027 $12,249,416 13.3% 97.33 B 11.7S2025 $1,722,021 12.8% 91.51 CCC 12.3S2026 $11,199,852 13.1% 93.95 CCC 13.0S2027 $25,774,968 13.4% 97.34 CCC
  • 36. Ferris 14.0S2019 $20,850,000 13.9% 101.00 B 12.2S2026 $8,738,656 13.0% 93.93 B 12.9S2027 $15,268,932 13.3% 97.33 B Next Year's Prime Rate 9.00% CAPSTONE® COURIER Page 2 Financial Summary C58538 Round: 4Dec. 31, 2017 Cash Flow Statement Survey Andrews Baldwin Chester Digby Erie Ferris CashFlows from operating activities Net Income(Loss) ($28,964) ($2,628) $18,060 $17,922 $10,155 $12,303 Adjustment for non-cash items: Depreciation $7,227 $7,587 $10,887 $11,393 $12,687 $9,600 Extraordinary gains/losses/writeoffs $0 $0 $0 $0 $0 ($403) Changes in current assets and liablilities Acounts payable ($171) $89 $738 $598 ($1,743) $360 Inventory $3,669 ($18,140) $4,614 $4,676 $8,155 $221 Accounts Receivable ($355) ($990) ($3,145) ($3,398) ($783) ($1,256) Net cash from operations ($18,594) ($14,083) $31,153 $31,192 $28,470 $20,825 Cash flows from investing activities Plant improvements(net) $0 $0 ($4,800) ($12,500) ($32,200) ($29,870) Cash flows from financing activities Dividends paid $0 $0 ($7,141) ($2,791) $0 $0 Sales of common stock $0 $0 $0 $0 $8,217 $5,768 Purchase of common stock $0 $0 $0 $0 $0 $0
  • 37. Cash from long term debt issued $0 $0 $12,249 $16,807 $25,775 $15,269 Early retirement of long term debt $0 $0 $0 $0 $0 $0 Retirement of current debt ($125,793) ($4,945) ($22,524) ($26,194) ($16,972) ($22,433) Cash from current debt borrowing $0 $0 $21,385 $25,380 $14,055 $26,294 Cash from emergency loan $144,387 $19,028 $0 $0 $0 $0 Net cash from financing activities $18,594 $14,083 $3,969 $13,201 $31,076 $24,898 Net change in cash position $0 $0 $30,322 $31,893 $27,346 $15,853 Balance Sheet Survey Andrews Baldwin Chester Digby Erie Ferris Cash $0 $0 $53,528 $53,933 $44,158 $43,502 Accounts Receivable $6,105 $8,888 $16,257 $18,657 $13,451 $16,503 Inventory $107,012 $50,888 $12,000 $17,854 $5,291 $13,710 Total Current Assets $113,117 $59,777 $81,785 $90,444 $62,900 $73,714 Plant and equipment $108,400 $113,800 $163,300 $170,900 $190,300 $144,000 Accumulated Depreciation ($65,040) ($68,280) ($66,307) ($65,500) ($70,147) ($46,900) Total Fixed Assets $43,360 $45,520 $96,993 $105,400 $120,153 $97,100 Total Assets $156,477 $105,297 $178,778 $195,844 $183,054 $170,814 Account Payable $4,760 $8,211 $10,119 $11,951 $8,149 $11,445 CurrentDebt $155,312 $32,928 $35,285 $39,209 $27,955
  • 38. $30,911 Long Term Debt $20,850 $20,850 $46,408 $49,804 $59,547 $44,858 Total Liabilities $180,922 $61,989 $91,812 $100,964 $95,651 $87,213 Common Stock $28,360 $18,360 $23,767 $20,678 $32,164 $24,861 Retained Earnings ($52,805) $24,948 $63,199 $74,202 $55,238 $58,740 Total Equity ($24,445) $43,307 $86,966 $94,880 $87,402 $83,601 Total Liabilities & Owners'' Equity $156,477 $105,297 $178,778 $195,844 $183,054 $170,814 Income Statement Survey Andrews Baldwin Chester Digby Erie Ferris Sales $74,279 $108,140 $197,794 $226,989 $163,657 $200,781 Variable Costs(Labor,Material,Carry) $74,429 $87,869 $129,174 $152,226 $107,941 $141,109 Depreciation $7,227 $7,587 $10,887 $11,393 $12,687 $9,600 SGA(R&D,Promo,Sales,Admin) $6,233 $8,992 $18,602 $23,338 $14,297 $20,600 Other(Fees,Writeoffs,TQM,Bonuses) $0 $0 $612 $840 $1,700 $648 EBIT ($13,610) $3,692 $38,518 $39,192 $27,033 $28,824 Interest(Short term,Long term) $30,951 $7,735 $10,167 $11,057 $11,092 $9,510 Taxes ($15,596) ($1,415) $9,923 $9,847 $5,580 $6,760 Profit Sharing $0 $0 $369 $366 $207 $251 Net Profit ($28,964) ($2,628) $18,060 $17,922 $10,155 $12,303 CAPSTONE® COURIER Page 3
  • 39. Production Analysis C58538 Round: 4Dec. 31, 2017 Name Primary Segment Units Sold Unit Inven tory Revision Date Age Dec.31 MTBF Pfmn Coord Size Coord Price Material Cost Labor Cost Contr. Marg. 2nd Shift &
  • 40. Over- time Auto mation Next Round Capacity Next Round Plant Utiliz. Able Trad 1,085 3,357 10/4/2016 3.1 17000 6.4 13.5 $23.50 $9.02 $9.02 -14% 0% 4.0 1,800 52% Acre Low 1,355 1,416 11/5/2016 3.4 16000 3.8 17.0 $17.40 $6.24 $7.73 4% 0% 5.0 1,400 99% Adam High 206 416 11/21/2016 2.6 22000 9.6 8.9 $33.00 $13.76 $10.31 7% 0% 3.0 900 28% Aft Pfmn 347 0 10/15/2016 2.5 27000 11.4 14.6 $29.90 $14.16 $11.01 15% 17% 3.0 300 116% Agape Size 278 436 7/30/2016 3.1 19000 5.4 8.6 $29.00 $11.76 $10.31 7% 0% 3.0 600 46% Baker Trad 1,795 645 12/23/2016 2.6 17500 6.5 12.8 $25.00 $9.51 $9.02 22% 0% 4.0 1,800 99% Bead Low 2,241 479 5/25/2009 8.6 14000 3.0 17.0 $18.50 $5.27 $9.39 17% 82% 5.0 1,400 180% Bid High 141 916 6/9/2016 3.1 22000 9.9 10.0 $36.50 $13.41 $10.31 -17% 0% 3.0 900 61% Bold Pfmn 237 27 7/16/2016 2.9 26000 11.4 15.1 $33.00 $13.76 $10.31 25% 0% 3.0 600 41%
  • 41. Buddy Size 268 416 5/4/2017 2.3 19000 5.4 8.6 $33.00 $11.76 $10.31 22% 0% 3.0 600 74% Cake Trad 1,872 14 9/14/2017 1.4 14000 7.8 12.2 $26.00 $9.23 $7.65 35% 65% 6.0 1,000 163% Cedar Low 2,426 394 1/29/2014 8.6 12000 3.0 17.0 $19.00 $4.67 $4.32 49% 32% 8.0 1,850 131% Cid High 1,033 112 11/15/2017 1.1 23000 12.5 7.5 $37.00 $15.81 $11.01 28% 17% 3.0 900 116% Coat Pfmn 907 104 9/21/2017 1.4 27000 13.4 13.2 $32.00 $15.55 $8.60 23% 6% 4.5 950 105% Cure Size 1,118 119 9/21/2017 1.3 17000 6.8 6.6 $32.00 $12.55 $9.24 31% 28% 4.5 1,000 127% Daze Trad 1,898 70 9/18/2017 1.4 18700 8.2 11.9 $28.50 $10.93 $8.48 32% 70% 5.5 1,050 168% Dell Low 1,961 361 6/19/2019 8.6 14000 3.0 17.0 $21.00 $5.27 $4.69 48% 9% 7.5 1,600 108% Dixie High 967 207 1/1/2018 2.1 24500 11.3 8.7 $38.50 $15.27 $10.78 30% 11% 3.0 950 109% Dot Pfmn 834 104 10/6/2017 1.3 27000 13.8 12.8 $33.50 $15.85 $9.02 25% 0% 4.0 1,000 94% Dune Size 1,241 159 10/6/2017 1.3 19000 7.2 6.4 $33.50 $13.35 $10.18 29% 37% 4.0 1,150 135% Doom Pfmn 746 39 8/31/2017 0.9 27000 13.7 12.9 $33.50 $15.78 $7.47 30% 50% 6.0 650 149% Eat Low 1,226 210 1/15/2017 4.1 13500 5.5 14.5 $20.50 $7.19 $4.51 37% 0% 8.0 1,400 74% Ebb Low 2,763 252 6/18/2019 8.6 12000 3.0 17.0 $18.50 $4.67 $5.24 43% 51% 8.0 1,750 150% Echo Trad 2,174 0 9/14/2017 1.3 15000 7.8 12.2 $26.00 $9.53 $7.94 33% 95% 6.5 1,150 193% Egg Trad 1,188 0 7/21/2017 1.7 16000 7.8 12.2 $26.00 $9.83 $11.17 19% 100% 5.0 1,300 198%
  • 42. Fast Low 675 85 1/29/2017 4.1 12000 5.5 14.5 $21.00 $6.74 $9.73 17% 20% 4.0 500 119% Feat Low 1,796 135 7/27/2018 8.6 13000 3.0 17.0 $21.00 $4.97 $7.70 38% 70% 6.0 1,150 168% Fist High 1,311 156 12/26/2017 1.1 25000 12.5 7.5 $38.00 $16.41 $12.12 26% 59% 3.0 850 157% Foam Pfmn 876 101 10/7/2017 1.3 27000 13.8 12.8 $33.00 $15.85 $8.61 25% 6% 5.0 850 105% Fume Size 977 168 11/23/2017 1.2 17000 6.8 6.0 $33.00 $12.87 $9.66 32% 18% 5.0 950 116% Fox High 998 0 12/22/2017 0.8 25000 13.0 7.0 $38.00 $16.82 $8.77 34% 100% 5.5 1,300 198% CAPSTONE® COURIER Page 4 Traditional Segment Analysis C58538 Round: 4Dec. 31, 2017 Traditional Statistics Total Industry Unit Demand 10,504 Actual Industry Unit Sales 10,504 Segment % of Total Industry 28.4% Next Year's Segment Growth Rate 9.2% Traditional Customer Buying Criteria Expectations Importance 1. Age Ideal Age = 2.0 47% 2. Price $18.00 - 28.00 23% 3. Ideal Position Pfmn 7.8 Size 12.2 21% 4. Reliability MTBF 14000-19000 9% Top Products in Traditional Segment
  • 44. Cust. Access- ibility Dec. Cust. Survey Echo 21% 2,173 9/14/2017 YES 7.8 12.2 $26.00 15000 1.33 $1,350 76% $1,056 77% 34 Daze 18% 1,896 9/18/2017 8.2 11.9 $28.50 18700 1.44 $1,225 77% $1,670 51% 30 Cake 18% 1,871 9/14/2017 7.8 12.2 $26.00 14000 1.45 $1,150 71% $1,675 50% 30 Baker 17% 1,765 12/23/2016 6.5 12.8 $25.00 17500 2.56 $1,000 63% $1,000 32% 24 Egg 11% 1,188 7/21/2017 YES 7.8 12.2 $26.00 16000 1.70 $1,350 76% $1,056 77% 44 Able 9% 988 10/4/2016 6.4 13.5 $23.50 17000 3.05 $500 31% $500 20% 10 Eat 4% 447 1/15/2017 5.5 14.5 $20.50 13500 4.09 $1,350 79% $1,056 77% 3 Fast 2% 176 1/29/2017 5.5 14.5 $21.00 12000 4.08 $900 57% $710 27% 1 CAPSTONE® COURIER Page 5 Low End Segment Analysis C58538 Round: 4Dec. 31, 2017 Low End Statistics Total Industry Unit Demand 13,949 Actual Industry Unit Sales 13,949 Segment % of Total Industry 37.8%
  • 45. Next Year's Segment Growth Rate 11.7% Low End Customer Buying Criteria Expectations Importance 1. Price $13.00 - 23.00 53% 2. Age Ideal Age = 7.0 24% 3. Ideal Position Pfmn 3.7 Size 16.3 16% 4. Reliability MTBF 12000-17000 7% Top Products in Low End Segment Name Market Share Units Sold to Seg Revision Date Stock Out Pfmn Coord Size Coord List Price MTBF
  • 46. Age Dec.31 Promo Budget Cust. Aware- ness Sales Budget Cust. Access- ibility Dec. Cust. Survey Ebb 20% 2,763 6/18/2019 3.0 17.0 $18.50 12000 8.60 $1,350 78% $1,056 56% 23 Cedar 17% 2,426 1/29/2014 3.0 17.0 $19.00 12000 8.60 $1,150 70% $1,758 50% 20 Bead 16% 2,241 5/25/2009 3.0 17.0 $18.50 14000 8.60 $900 56% $1,000 34% 19 Dell 14% 1,961 6/19/2019 3.0 17.0 $21.00 14000 8.60 $1,225 76% $1,753 50% 16 Feat 13% 1,796 7/27/2018 3.0 17.0 $21.00 13000 8.60 $1,100 70% $1,278 53% 14 Acre 10% 1,355 11/5/2016 3.8 17.0 $17.40 16000 3.41 $500 30% $500 17% 13 Eat 6% 780 1/15/2017 5.5 14.5 $20.50 13500 4.09 $1,350 79% $1,056 56% 9
  • 47. Fast 4% 499 1/29/2017 5.5 14.5 $21.00 12000 4.08 $900 57% $710 53% 6 Able 1% 97 10/4/2016 6.4 13.5 $23.50 17000 3.05 $500 31% $500 17% 1 Baker 0% 30 12/23/2016 6.5 12.8 $25.00 17500 2.56 $1,000 63% $1,000 34% 0 CAPSTONE® COURIER Page 6 High End Segment Analysis C58538 Round: 4Dec. 31, 2017 High End Statistics Total Industry Unit Demand 4,656 Actual Industry Unit Sales 4,656 Segment % of Total Industry 12.6% Next Year's Segment Growth Rate 16.2% High End Customer Buying Criteria Expectations Importance 1. Ideal Position Pfmn 12.5 Size 7.5 43% 2. Age Ideal Age = 0.0 29% 3. Reliability MTBF 20000-25000 19% 4. Price $28.00 - 38.00 9% Top Products in High End Segment Name Market Share Units Sold to
  • 49. Cust. Survey Fist 28% 1,311 12/26/2017 12.5 7.5 $38.00 25000 1.06 $1,300 74% $1,278 67% 52 Cid 22% 1,033 11/15/2017 12.5 7.5 $37.00 23000 1.13 $1,100 65% $1,758 50% 38 Fox 21% 998 12/22/2017 YES 13.0 7.0 $38.00 25000 0.78 $1,300 58% $1,278 67% 41 Dixie 21% 967 1/1/2018 11.3 8.7 $38.50 24500 2.15 $1,250 77% $1,753 52% 19 Adam 4% 203 11/21/2016 9.6 8.9 $33.00 22000 2.63 $600 35% $660 19% 4 Bid 3% 141 6/9/2016 9.9 10.0 $36.50 22000 3.14 $1,000 60% $700 20% 3 Daze 0% 3 9/18/2017 8.2 11.9 $28.50 18700 1.44 $1,225 77% $1,670 52% 0 CAPSTONE® COURIER Page 7 Performance Segment Analysis C58538 Round: 4Dec. 31, 2017 Performance Statistics Total Industry Unit Demand 3,945 Actual Industry Unit Sales 3,945 Segment % of Total Industry 10.7% Next Year's Segment Growth Rate 19.8% Performance Customer Buying Criteria Expectations Importance 1. Reliability MTBF 22000-27000 43% 2. Ideal Position Pfmn 13.4 Size 13.2 29%
  • 50. 3. Price $23.00 - 33.00 19% 4. Age Ideal Age = 1.0 9% Top Products in Performance Segment Name Market Share Units Sold to Seg Revision Date Stock Out Pfmn Coord Size Coord List Price MTBF Age Dec.31 Promo Budget Cust. Aware-
  • 51. ness Sales Budget Cust. Access- ibility Dec. Cust. Survey Coat 23% 907 9/21/2017 13.4 13.2 $32.00 27000 1.42 $1,100 64% $1,591 41% 41 Foam 22% 876 10/7/2017 13.8 12.8 $33.00 27000 1.30 $1,300 74% $1,278 35% 38 Dot 21% 834 10/6/2017 13.8 12.8 $33.50 27000 1.33 $1,200 74% $1,586 42% 37 Doom 19% 746 8/31/2017 13.7 12.9 $33.50 27000 0.86 $1,200 63% $0 42% 33 Aft 9% 347 10/15/2016 YES 11.4 14.6 $29.90 27000 2.54 $600 33% $600 15% 16 Bold 6% 237 7/16/2016 11.4 15.1 $33.00 26000 2.92 $300 24% $300 12% 8 CAPSTONE® COURIER Page 8 Size Segment Analysis C58538 Round: 4Dec. 31, 2017 Size Statistics Total Industry Unit Demand 3,885 Actual Industry Unit Sales 3,885
  • 52. Segment % of Total Industry 10.5% Next Year's Segment Growth Rate 18.3% Size Customer Buying Criteria Expectations Importance 1. Ideal Position Pfmn 6.8 Size 6.6 43% 2. Age Ideal Age = 1.5 29% 3. Reliability MTBF 16000-21000 19% 4. Price $23.00 - 33.00 9% Top Products in Size Segment Name Market Share Units Sold to Seg Revision Date Stock Out Pfmn Coord Size Coord List Price MTBF
  • 53. Age Dec.31 Promo Budget Cust. Aware- ness Sales Budget Cust. Access- ibility Dec. Cust. Survey Dune 32% 1,241 10/6/2017 7.2 6.4 $33.50 19000 1.29 $1,200 74% $1,586 44% 37 Cure 29% 1,118 9/21/2017 6.8 6.6 $32.00 17000 1.35 $1,150 66% $1,591 43% 37 Fume 25% 977 11/23/2017 6.8 6.0 $33.00 17000 1.18 $1,300 74% $1,278 37% 30 Agape 7% 278 7/30/2016 5.4 8.6 $29.00 19000 3.09 $600 32% $600 19% 5 Buddy 7% 268 5/4/2017 5.4 8.6 $33.00 19000 2.29 $800 45% $800 22% 8 Adam 0% 2 11/21/2016 9.6 8.9 $33.00 22000 2.63 $600 35% $660 19% 0
  • 54. CAPSTONE® COURIER Page 9 Market Share C58538 Round: 4Dec. 31, 2017 Actual Market Share in Units Potential Market Share in Units Trad Low High Pfmn Size Total Trad Low High Pfmn Size Total Industry Unit Sales 10,504 13,949 4,656 3,945 3,885 36,939 Units Demanded 10,504 13,949 4,656 3,945 3,885 36,939 % of Market 28.4% 37.8% 12.6% 10.7% 10.5% 100.0% % of Market 28.4% 37.8% 12.6% 10.7% 10.5% 100.0% Able 9.4% 0.7% 2.9% Able 8.4% 0.7% 2.7% Acre 9.7% 3.7% Acre 9.7% 3.7% Adam 4.4% 0.6% Adam 3.9% 0.5% Aft 8.8% 0.9% Aft 11.2% 1.2% Agape 7.1% 0.7% Agape 7.1% 0.8% Total 9.4% 10.4% 4.4% 8.8% 7.2% 8.8% Total 8.4% 10.4% 3.9% 11.2% 7.2% 8.8% Baker 16.8% 0.2% 4.9% Baker 14.9% 0.2% 4.3% Bead 16.1% 6.1% Bead 16.1% 6.1% Bid 3.0% 0.4% Bid 2.7% 0.3% Bold 6.0% 0.6% Bold 5.8% 0.6% Buddy 6.9% 0.7% Buddy 6.9% 0.7% Total 16.8% 16.3% 3.0% 6.0% 6.9% 12.7% Total 14.9% 16.3% 2.7% 5.8% 6.9% 12.1% Cake 17.8% 5.1% Cake 15.9% 4.5% Cedar 17.4% 6.6% Cedar 17.4% 6.6% Cid 22.2% 2.8% Cid 19.7% 2.5% Coat 23.0% 2.5% Coat 22.4% 2.4% Cure 28.8% 3.0% Cure 28.8% 3.0%
  • 55. Total 17.8% 17.4% 22.2% 23.0% 28.8% 19.9% Total 15.9% 17.4% 19.7% 22.4% 28.8% 19.0% Daze 18.0% 5.1% Daze 16.1% 4.6% Dell 14.1% 5.3% Dell 14.1% 5.3% Dixie 20.8% 2.6% Dixie 18.4% 2.3% Dot 21.1% 2.3% Dot 20.6% 2.2% Dune 31.9% 3.4% Dune 31.9% 3.4% Doom 18.9% 2.0% Doom 18.4% 2.0% Total 18.0% 14.1% 20.8% 40.0% 31.9% 20.7% Total 16.1% 14.1% 18.5% 39.0% 31.9% 19.7% Eat 4.3% 5.6% 3.3% Eat 3.8% 5.6% 3.2% Ebb 19.8% 7.5% Ebb 19.8% 7.5% Echo 20.7% 5.9% Echo 18.6% 5.3% Egg 11.3% 3.2% Egg 20.8% 5.9% Total 36.2% 25.4% 19.9% Total 43.2% 25.4% 21.9% Fast 1.7% 3.6% 1.8% Fast 1.5% 3.6% 1.8% Feat 12.9% 4.9% Feat 12.9% 4.9% Fist 28.2% 3.5% Fist 25.0% 3.2% Foam 22.2% 2.4% Foam 21.6% 2.3% Fume 25.2% 2.6% Fume 25.2% 2.6% Fox 21.4% 2.7% Fox 30.2% 3.8% Total 1.7% 16.5% 49.6% 22.2% 25.2% 18.0% Total 1.5% 16.5% 55.2% 21.6% 25.2% 18.5% CAPSTONE® COURIER Page 10 Perceptual Map C58538 Round: 4Dec. 31, 2017 Andrews Baldwin Chester Name Pfmn Size Revised Name Pfmn Size Revised Name Pfmn Size Revised
  • 56. Able 6.4 13.5 10/4/2016 Baker 6.5 12.8 12/23/2016 Cake 7.8 12.2 9/14/2017 Acre 3.8 17.0 11/5/2016 Bead 3.0 17.0 5/25/2009 Cedar 3.0 17.0 1/29/2014 Adam 9.6 8.9 11/21/2016 Bid 9.9 10.0 6/9/2016 Cid 12.5 7.5 11/15/2017 Aft 11.4 14.6 10/15/2016 Bold 11.4 15.1 7/16/2016 Coat 13.4 13.2 9/21/2017 Agape 5.4 8.6 7/30/2016 Buddy 5.4 8.6 5/4/2017 Cure 6.8 6.6 9/21/2017 Abum 6.0 15.0 4/17/2016 Ajoy 6.2 15.0 5/1/2016 Apps 5.9 15.0 4/19/2016 Digby Erie Ferris Name Pfmn Size Revised Name Pfmn Size Revised Name Pfmn Size Revised Daze 8.2 11.9 9/18/2017 Eat 5.5 14.5 1/15/2017 Fast 5.5 14.5 1/29/2017 Dell 3.0 17.0 6/19/2019 Ebb 3.0 17.0 6/18/2019 Feat 3.0 17.0 7/27/2018 Dixie 11.3 8.7 1/1/2018 Echo 7.8 12.2 9/14/2017 Fist 12.5 7.5 12/26/2017 Dot 13.8 12.8 10/6/2017 Egg 7.8 12.2 7/21/2017 Foam 13.8 12.8 10/7/2017 Dune 7.2 6.4 10/6/2017 Fume 6.8 6.0 11/23/2017 Doom 13.7 12.9 8/31/2017 Fox 13.0 7.0 12/22/2017 CAPSTONE® COURIER Page 11 HR/TQM Report C58538 Round: 4Dec. 31, 2017 HUMAN RESOURCES SUMMARY Andrews Baldwin Chester Digby Erie Ferris
  • 57. Needed Complement 531 911 897 1,026 760 1,028 Complement 531 911 897 1,026 760 1,028 1st Shift Complement 521 745 700 813 463 720 2nd Shift Complement 10 166 197 213 297 308 Overtime Percent 0.0% 0.0% 0.0% 0.0% 0.0% 0.0% Turnover Rate 10.0% 10.0% 10.0% 10.0% 10.0% 10.0% New Employees 53 91 132 103 76 144 Separated Employees 0 0 0 11 228 0 Recruiting Spend $0 $0 $0 $0 $0 $0 Training Hours 0 0 0 0 0 0 Productivity Index 100.0% 100.0% 100.0% 100.0% 100.0% 100.0% Recruiting Cost $53 $91 $132 $103 $76 $144 Separation Cost $0 $0 $0 $55 $1,140 $0 Training Cost $0 $0 $0 $0 $0 $0 Total HR Admin Cost $53 $91 $132 $158 $1,216 $144 Labor Contract Next Year Wages $25.53 $25.53 $25.53 $25.53 $25.53 $25.53 Benefits 2,500 2,500 2,500 2,500 2,500 2,500 Profit Sharing 2.0% 2.0% 2.0% 2.0% 2.0% 2.0% Annual Raise 5.0% 5.0% 5.0% 5.0% 5.0% 5.0% Starting Negotiation Position Wages Benefits Profit Sharing Annual Raise Ceiling Negotiation Position Wages Benefits Profit Sharing
  • 58. Annual Raise Adjusted Labor Demands Wages Benefits Profit Sharing Annual Raise Strike Days TQM SUMMARY Andrews Baldwin Chester Digby Erie Ferris Process Mgt Budgets Last Year CPI Systems $0 $0 $0 $0 $0 $0 Vendor/JIT $0 $0 $0 $0 $0 $0 Quality Initiative Training $0 $0 $0 $0 $0 $0 Channel Support Systems $0 $0 $0 $0 $0 $0 Concurrent Engineering $0 $0 $0 $0 $0 $0 UNEP Green Programs $0 $0 $0 $0 $0 $0 TQM Budgets Last Year Benchmarking $0 $0 $0 $0 $0 $0 Quality Function Deployment Effort $0 $0 $0 $0 $0 $0 CCE/6 Sigma Training $0 $0 $0 $0 $0 $0 GEMI TQEM Sustainability Initiatives $0 $0 $0 $0 $0 $0 Total Expenditures $0 $0 $0 $0 $0 $0 Cumulative Impacts Material Cost Reduction 0.00% 0.00% 0.00% 0.00% 0.00% 0.00% Labor Cost Reduction 0.00% 0.00% 0.00% 0.00% 0.00% 0.00% Reduction R&D Cycle Time 0.00% 0.00% 0.00% 0.00% 0.00% 0.00% Reduction Admin Costs 0.00% 0.00% 0.00% 0.00% 0.00% 0.00%
  • 59. Demand Increase 0.00% 0.00% 0.00% 0.00% 0.00% 0.00% CAPSTONE® COURIER Page 12 Ethics Report C58538 Round: 4Dec. 31, 2017 ETHICS SUMMARY Other (Fees, Writeoffs, etc.) The actual dollar impact. Example, $120 means Other increased by $120. Demand Factor The % of normal. 98% means demand fell 2%. Material Cost Impact The % of normal. 104% means matieral costs rose 4%. Admin Cost Impact The % of normal. 103% means admin costs rose 3%. Productivity Impact The % of normal. 104% means productivity increased by 4%. Awareness Impact The % of normal. 105% means normal awareness was multiplied by 1.05. Accessibility Impact The % of normal. 98% means normal accessiblity was multiplied by 0.98. Normal means the value that would have been produced if the problem had not been presented. No Impact Andrews Baldwin Chester Digby Erie Ferris Total Other (Fees, Writeoffs, etc.) $0 $0 $0 $0 $0 $0 $0 Demand Factor 100% 100% 100% 100% 100% 100% 100% Material Cost Impact 100% 100% 100% 100% 100% 100% 100% Admin Cost Impact 100% 100% 100% 100% 100% 100% 100% Productivity Impact 100% 100% 100% 100% 100% 100% 100% Awareness Impact 100% 100% 100% 100% 100% 100% 100% Accessibility Impact 100% 100% 100% 100% 100% 100% 100%
  • 60. CAPSTONE® COURIER Page 13 Annual Report Annual Report Andrews C58538 Round: 4Dec. 31, 2017 Balance Sheet DEFINITIONS: Common Size: The common size column simply represents each item as a percentage of total assets for that year. Cash: Your end-of-year cash position. Accounts Receivable: Reflects the lag between delivery and payment of your products. Inventories: The current value of your inventory across all products. A zero indicates your company stocked out. Unmet demand would, of course, fall to your competitors. Plant & Equipment: The current value of your plant. Accum Deprec: The total accumulated depreciation from your plant. Accts Payable: What the company currently owes suppliers for materials and services. Current Debt: The debt the company is obligated to pay during the next year of operations. It includes emergency loans used to keep your company solvent should you run out of cash during the year. Long Term Debt: The company's long term debt is in the form of bonds, and this represents the total value of your bonds. Common Stock: The amount of capital invested by shareholders in the
  • 61. company. Retained Earnings: The profits that the company chose to keep instead of paying to shareholders as dividends. ASSETS 2017 Common Size 2016 Cash $0 0.0% $0 Account Receivable $6,105 3.9% $5,750 Inventory $107,012 68.4% $110,681 Total Current Assets $113,117 72.3% $116,431 Plant & Equipment $108,400 69.3% $108,400 Accumulated Depreciation ($65,040) -41.6% ($57,813) Total Fixed Assets $43,360 27.7% $50,587 Total Assets $156,477 100.0% $167,018 LIABILITIES & OWNER'S EQUITY Accounts Payable $4,760 3.0% $4,931 Current Debt $155,312 99.3% $125,793 Long Term Debt $20,850 13.3% $31,775 Total Liabilities $180,922 116.0% $162,499 Common Stock $28,360 18.1% $28,360 Retained Earnings ($52,805) -33.7% ($23,841) Total Equity ($24,445) -15.6% $4,519 Total Liab. & O. Equity $156,477 100.0% $167,018 Cash Flow Statement The Cash Flow Statement examines what happened in the Cash Account during the year. Cash injections appear as positive
  • 62. numbers and cash withdrawals as negative numbers. The Cash Flow Statement is an excellent tool for diagnosing emergency loans. When negative cash flows exceed positives, you are forced to seek emergency funding. For example, if sales are bad and you find yourself carrying an abundance of excess inventory, the report would show the increase in inventory as a huge negative cash flow. Too much unexpected inventory could outstrip your inflows, exhaust your starting cash and force you to beg for money to keep your company afloat. Cash Flows from Operating Activities 2017 2016 NetIncome(Loss) ($28,964) ($32,474) Depreciation $7,227 $7,227 Extraordinary gains/losses/writeoffs $0 $0 Accounts Payable ($171) ($6,042) Inventory $3,669 ($1,387) Accounts Receivable ($355) ($2,261) Net cash from operation ($18,594) ($34,937) Cash Flows from Investing Activities Plant Improvements $0 $0 Cash Flows from Financing Activities Dividends Paid $0 $0 Sales of Common Stock $0 $0 Purchase of Common Stock $0 $0 Cash from long term debt $0 $0 Retirement of long term debt ($10,925) $0 Change in current debt(net) $29,518 $34,937
  • 63. Net Cash from financing activities $18,594 $34,937 Net Change in cash position $0 $0 Closing cash position $0 $0 Annual Report Page 14 Annual Report Andrews C58538 Round: 4Dec. 31, 2017 2017 Income Statement (Product Name) Able Acre Adam Aft Agape Abum Ajoy Apps 2017 Total Common Size Sales $25,501 $23,581 $6,782 $10,362 $8,054 $0 $0 $0 $74,279 100.0% Variable Costs: Direct Labor $9,677 $10,444 $2,023 $3,815 $2,827 $0 $0 $0 $28,786 38.8% Direct Material $11,609 $9,662 $3,026 $5,003 $3,502 $0 $0 $0 $32,802 44.2% Inventory Carry $7,902 $2,521 $1,227 $0 $1,192 $0 $0 $0 $12,841 17.3% Total Variable $29,188 $22,627 $6,276 $8,817 $7,520 $0 $0 $0 $74,429 100.2% Contribution Margin ($3,688) $954 $506 $1,545 $533 $0 $0 $0 ($150) -0.2% Period Costs: Depreciation $2,640 $2,427 $1,080 $360 $720 $0 $0 $0 $7,227
  • 64. 9.7% SG&A: R&D $0 $0 $0 $0 $0 $0 $0 $0 $0 0.0% Promotions $500 $500 $600 $600 $600 $0 $0 $0 $2,800 3.8% Sales $500 $500 $660 $600 $600 $0 $0 $0 $2,860 3.9% Admin $197 $182 $52 $80 $62 $0 $0 $0 $573 0.8% Total Period $3,837 $3,609 $2,392 $1,640 $1,982 $0 $0 $0 $13,460 18.1% Net Margin ($7,524) ($2,655) ($1,886) ($95) ($1,449) $0 $0 $0 ($13,610) -18.3% Definitions: Sales: Unit Sales times list price. Direct Labor: Labor costs incurred to produce the product that was sold. Inventory Carry Cost: the cost unsold goods in inventory. Depreciation: Calculated on straight-line. 15-year depreciation of plant value. R&D Costs: R&D department expenditures for each product. Admin: Administration overhead is estimated at 1.5% of sales. Promotions: The promotion budget for each product. Sales: The sales force budget for each product. Other: Chargs not included in other categories such as Fees, Write offs, and TQM. The fees include money paid to investment bankers and brokerage firms to issue new stocks or bonds plus consulting fees your instructor might assess. Write-offs include the loss you might experience when you sell capacity or liquidate inventory as the result of eliminating a production line. If the amount appears as a negative amount, then you actually made money on the liquidation of capacity or inventory. EBIT: Earnings Before Interest and Taxes. Short Term Interest: Interest expense based on last year''s current debt, including short term debt, long term notes that have become due, and emergency loans, Long Term Interest: Interest paid on outstanding bonds. Taxes: Income tax based upon a 35% tax
  • 65. rate. Profit Sharing: Profits shared with employees under the labor contract. Net Profit: EBIT minus interest, taxes, and profit sharing. Other $0 0.0% EBIT ($13,610) -18.3% Short Term Interest $28,032 37.7% Long Term Interest $2,919 3.9% Taxes ($15,596) -21.0% Profit Sharing $0 0.0% Net Profit ($28,964) -39.0% Annual Report Page 15 C58538Front PageStock & BondsFinancial SummaryProduction AnalysisTraditional Segment AnalysisLow End Segment AnalysisHigh End Segment AnalysisPerformance Segment AnalysisSize Segment AnalysisMarket SharePerceptual MapHR/TQM ReportEthics ReportAnnual ReportAndrewsBalance SheetIncome Statement Round: 3 Dec. 31, 2016 C58538 Andrews Eugene Ellis Philip Mull Baldwin Lisa Chastain Monica Dalke matt rix Chester
  • 66. Digby Erie Ferris Selected Financial Statistics Andrews Baldwin Chester Digby Erie Ferris ROS -46.4% -3.3% 5.2% 5.2% 4.1% 5.9% Asset Turnover 0.42 1.02 1.02 1.13 1.07 1.39 ROA -19.4% -3.4% 5.3% 5.8% 4.4% 8.2% Leverage (Assets/Equity) 37.0 2.0 2.1 2.1 2.1 2.0 ROE -718.6% -7.0% 10.9% 12.0% 9.0% 16.7% Emergency Loan $125,793,089 $4,945,006 $0 $0 $0 $0 Sales $69,961,561 $96,089,579 $159,532,219 $185,644,482 $154,127,338 $185,494,213 EBIT ($23,116,007) $566,964 $21,655,955 $23,974,920 $17,892,517 $24,157,919 Profits ($32,473,914) ($3,194,122) $8,267,684 $9,578,890 $6,247,090 $10,939,194 Cumulative Profit ($48,179,912) $2,182,017 $29,677,316 $33,677,169 $25,121,802 $33,006,630 SG&A / Sales 20.0% 12.1% 10.9% 11.2% 7.5% 10.7% Contrib. Margin % -2.8% 20.6% 31.6% 29.8% 26.3% 27.8% CAPSTONE® COURIER Page 1 Stock & Bonds C58538 Round: 3Dec. 31, 2016 Stock Market Summary
  • 67. Company Close Change Shares MarketCap ($M) Book Value EPS Dividend Yield P/E Andrews $1.00 $0.00 2,291,939 $2 $1.97 ($14.17) $0.00 0.0% -0.0 Baldwin $12.57 ($11.61) 2,000,000 $25 $22.97 ($1.60) $0.00 0.0% -7.9 Chester $60.54 $5.40 2,124,345 $129 $35.80 $3.89 $0.00 0.0% 15.6 Digby $64.91 $5.20 2,053,924 $133 $38.83 $4.66 $0.00 0.0% 13.9 Erie $51.59 $2.17 2,152,363 $111 $32.07 $2.90 $0.00 0.0% 17.8 Ferris $61.28 $5.40 2,013,135 $123 $32.55 $5.43 $0.00 0.0% 11.3 Bond Market Summary Company Series# Face Yield Close$ S&P Company Series# Face Yield Close$ S&P Andrews Digby 12.5S2017 $10,924,506 12.8% 98.00 DDD 12.5S2017 $13,828,904 12.5% 99.65 B 14.0S2019 $20,850,000 14.3% 98.17 DDD 14.0S2019 $20,850,000 13.6% 102.60 B Baldwin 11.6S2025 $3,523,690 12.4% 93.30 B 12.5S2017 $13,900,000 12.5% 99.65 B 12.2S2026 $8,623,471 12.7% 96.19 B 14.0S2019 $20,850,000 13.6% 102.60 B Erie Chester 12.5S2017 $13,900,000 12.6% 99.56 CCC 12.5S2017 $13,900,000 12.5% 99.65 B 14.0S2019 $20,850,000
  • 68. 13.7% 102.36 CCC 14.0S2019 $20,850,000 13.6% 102.60 B 11.7S2025 $1,722,021 12.5% 93.33 CCC 12.1S2026 $13,308,235 12.7% 95.64 B 12.3S2026 $11,199,852 12.8% 96.20 CCC Ferris 12.5S2017 $4,616,365 12.5% 99.65 B 14.0S2019 $20,850,000 13.6% 102.60 B 12.2S2026 $8,738,656 12.7% 96.19 B Next Year's Prime Rate 8.50% CAPSTONE® COURIER Page 2 Financial Summary C58538 Round: 3Dec. 31, 2016 Cash Flow Statement Survey Andrews Baldwin Chester Digby Erie Ferris CashFlows from operating activities Net Income(Loss) ($32,474) ($3,194) $8,268 $9,579 $6,247 $10,939 Adjustment for non-cash items: Depreciation $7,227 $7,587 $10,567 $10,560 $10,540 $7,660 Extraordinary gains/losses/writeoffs $0 $0 $0 ($340) ($2) ($513) Changes in current assets and liablilities Acounts payable ($6,042) ($6,220) $63 $1,805 $2,966 $2,835 Inventory ($1,387) ($26,452) ($6,969) ($10,581) ($8,415) ($2,646) Accounts Receivable ($2,261) $8,859 $77 ($1,732) ($2,251) ($3,580) Net cash from operations ($34,937) ($19,421) $12,006 $9,291 $9,086 $14,695
  • 69. Cash flows from investing activities Plant improvements(net) $0 $0 ($42,900) ($30,420) ($34,288) ($26,640) Cash flows from financing activities Dividends paid $0 $0 $0 $0 $0 $0 Sales of common stock $0 $0 $3,031 $207 $1,200 $734 Purchase of common stock $0 $0 $0 $0 $0 $0 Cash from long term debt issued $0 $0 $13,308 $8,623 $11,200 $8,739 Early retirement of long term debt $0 $0 $0 $0 $0 $0 Retirement of current debt ($90,856) ($6,950) ($17,989) ($20,549) ($19,677) ($19,431) Cash from current debt borrowing $0 $0 $22,524 $26,194 $16,972 $22,433 Cash from emergency loan $125,793 $4,945 $0 $0 $0 $0 Net cash from financing activities $34,937 ($2,005) $20,875 $14,476 $9,695 $12,475 Net change in cash position $0 ($21,426) ($10,020) ($6,653) ($15,508) $530 Balance Sheet Survey Andrews Baldwin Chester Digby Erie Ferris Cash $0 $0 $23,206 $22,040 $16,812 $27,649 Accounts Receivable $5,750 $7,898 $13,112 $15,258 $12,668 $15,246 Inventory $110,681 $32,748 $16,613 $22,531 $13,446 $13,931 Total Current Assets $116,431 $40,646 $52,932 $59,829 $42,926 $56,826 Plant and equipment $108,400 $113,800 $158,500 $158,400 $158,100 $114,900 Accumulated Depreciation ($57,813) ($60,693) ($55,420) ($54,107) ($57,460) ($38,473) Total Fixed Assets $50,587 $53,107 $103,080 $104,293 $100,640 $76,427
  • 70. Total Assets $167,018 $93,753 $156,012 $164,123 $143,566 $133,253 Account Payable $4,931 $8,122 $9,382 $11,353 $9,892 $11,085 CurrentDebt $125,793 $4,945 $22,524 $26,194 $16,972 $22,433 Long Term Debt $31,775 $34,750 $48,058 $46,826 $47,672 $34,205 Total Liabilities $162,499 $47,818 $79,964 $84,373 $74,536 $67,723 Common Stock $28,360 $18,360 $23,767 $20,678 $23,947 $19,094 Retained Earnings ($23,841) $27,576 $52,281 $59,071 $45,083 $46,436 Total Equity $4,519 $45,935 $76,048 $79,749 $69,030 $65,530 Total Liabilities & Owners'' Equity $167,018 $93,753 $156,012 $164,123 $143,566 $133,253 Income Statement Survey Andrews Baldwin Chester Digby Erie Ferris Sales $69,962 $96,090 $159,532 $185,644 $154,127 $185,494 Variable Costs(Labor,Material,Carry) $71,890 $76,301 $109,170 $130,251 $113,557 $133,891 Depreciation $7,227 $7,587 $10,567 $10,560 $10,540 $7,660 SGA(R&D,Promo,Sales,Admin) $13,961 $11,635 $17,323 $20,757 $11,520 $19,825 Other(Fees,Writeoffs,TQM,Bonuses) $0 $0 $817 $102 $618 ($40) EBIT ($23,116) $567 $21,656 $23,975 $17,893 $24,158 Interest(Short term,Long term) $26,844 $5,481 $8,677 $8,937 $8,085 $6,985 Taxes ($17,486) ($1,720) $4,543 $5,263 $3,432 $6,011 Profit Sharing $0 $0 $169 $195 $127 $223 Net Profit ($32,474) ($3,194) $8,268 $9,579 $6,247 $10,939
  • 71. CAPSTONE® COURIER Page 3 Production Analysis C58538 Round: 3Dec. 31, 2016 Name Primary Segment Units Sold Unit Inven tory Revision Date Age Dec.31 MTBF Pfmn Coord Size Coord Price Material Cost Labor Cost Contr. Marg.
  • 72. 2nd Shift & Over- time Auto mation Next Round Capacity Next Round Plant Utiliz. Able Trad 815 3,501 10/4/2016 2.1 17000 6.4 13.5 $23.50 $9.75 $8.61 -29% 0% 4.0 1,800 52% Acre Low 1,160 1,385 11/5/2016 2.4 16000 3.8 17.0 $17.40 $6.78 $7.38 -2% 0% 5.0 1,400 99% Adam High 284 374 11/21/2016 1.6 22000 9.6 8.9 $33.00 $14.72 $9.84 13% 0% 3.0 900 28% Aft Pfmn 355 0 10/15/2016 1.5 27000 11.4 14.6 $29.90 $15.00 $10.51 16% 17% 3.0 300 116% Agape Size 368 436 7/30/2016 2.1 19000 5.4 8.6 $29.00 $12.60 $9.84 9% 0% 3.0 600 46% Baker Trad 1,125 657 12/23/2016 1.6 17500 6.5 12.8 $25.00 $10.26 $8.61 22% 0% 4.0 1,800 99% Bead Low 2,330 195 5/25/2009 7.6 14000 3.0 17.0 $18.50 $5.79 $8.96 18% 82% 5.0 1,400 180%
  • 73. Bid High 254 513 6/9/2016 2.1 22000 9.9 10.0 $36.50 $14.34 $9.84 18% 0% 3.0 900 61% Bold Pfmn 266 16 7/16/2016 1.9 26000 11.4 15.1 $33.00 $14.59 $9.84 26% 0% 3.0 600 41% Buddy Size 207 239 5/4/2017 2.9 19000 4.7 10.8 $33.00 $11.16 $9.84 27% 0% 3.0 600 74% Cake Trad 1,357 252 8/26/2016 1.6 14000 7.1 12.9 $26.00 $9.42 $7.76 32% 45% 6.0 1,000 144% Cedar Low 2,378 394 1/29/2014 7.6 12000 3.0 17.0 $19.00 $5.19 $5.33 42% 100% 8.0 1,850 198% Cid High 700 106 12/17/2016 1.1 23000 11.4 8.6 $37.00 $15.92 $10.20 29% 8% 3.0 900 107% Coat Pfmn 844 120 5/1/2016 1.6 27000 12.4 13.9 $32.00 $15.75 $10.12 17% 58% 4.5 850 157% Cure Size 818 99 9/11/2016 1.4 17000 6.1 7.6 $32.00 $12.75 $9.81 29% 42% 4.5 900 140% Daze Trad 1,514 285 8/21/2016 1.6 18400 7.5 12.6 $28.50 $11.05 $8.76 30% 65% 5.5 1,000 163% Dell Low 1,984 590 5/25/2009 7.6 14000 3.0 17.0 $21.00 $5.79 $6.00 41% 86% 7.5 1,600 184% Dixie High 846 134 12/2/2016 1.1 24500 11.3 8.7 $38.50 $16.29 $10.71 30% 23% 3.0 950 122% Dot Pfmn 834 96 8/2/2016 1.4 27000 12.8 13.5 $33.50 $16.08 $11.14 18% 38% 4.0 900 137% Dune Size 998 112 10/16/2016 1.3 19000 6.5 7.4 $33.50 $13.56 $11.24 26% 43% 4.0 950 141% Doom Pfmn 206 42 8/8/2016 0.4 27000 13.0 13.4 $33.50 $16.22 $6.81 29% 29% 6.0 500 50% Eat Trad 1,752 396 1/15/2016 3.1 14500 5.5 14.5 $21.00 $8.15 $5.66 30% 46% 7.5 1,400 145% Ebb Low 2,381 391 1/15/2015 7.6 12000 3.0 17.0 $19.00 $5.19 $7.61 30% 100% 7.5 1,750 198% Echo Trad 1,441 144 8/20/2016 1.4 15000 7.1 12.9 $26.50 $9.72
  • 74. $8.85 28% 72% 6.0 1,050 171% Egg Trad 1,280 0 5/18/2016 2.0 16000 7.1 12.9 $26.50 $10.02 $12.18 15% 100% 4.0 600 198% Fast Trad 1,243 167 4/22/2015 3.1 14000 5.5 14.5 $21.50 $8.00 $10.66 10% 100% 4.0 600 198% Feat Low 1,386 0 7/27/2018 7.6 13000 3.0 17.0 $21.50 $5.49 $7.61 38% 100% 6.0 1,150 198% Fist High 927 130 12/13/2016 1.1 25000 11.3 8.6 $38.50 $16.48 $11.40 28% 50% 3.0 850 149% Foam Pfmn 788 135 9/18/2016 1.4 27000 12.8 13.5 $33.40 $16.08 $9.97 21% 50% 4.5 800 149% Fume Size 870 155 12/11/2016 1.3 16000 6.1 7.2 $33.50 $12.68 $10.12 30% 58% 4.0 850 157% Fox High 983 8 12/11/2016 0.5 25000 12.0 8.0 $38.50 $17.05 $8.37 35% 100% 5.5 500 198% CAPSTONE® COURIER Page 4 Traditional Segment Analysis C58538 Round: 3Dec. 31, 2016 Traditional Statistics Total Industry Unit Demand 9,619 Actual Industry Unit Sales 9,619 Segment % of Total Industry 29.4% Next Year's Segment Growth Rate 9.2% Traditional Customer Buying Criteria Expectations Importance 1. Age Ideal Age = 2.0 47% 2. Price $18.50 - 28.50 23% 3. Ideal Position Pfmn 7.1 Size 12.9 21%
  • 75. 4. Reliability MTBF 14000-19000 9% Top Products in Traditional Segment Name Market Share Units Sold to Seg Revision Date Stock Out Pfmn Coord Size Coord List Price MTBF Age Dec.31 Promo Budget Cust. Aware- ness
  • 76. Sales Budget Cust. Access- ibility Dec. Cust. Survey Daze 16% 1,495 8/21/2016 7.5 12.6 $28.50 18400 1.60 $1,225 73% $1,670 53% 35 Echo 15% 1,437 8/20/2016 7.1 12.9 $26.50 15000 1.38 $1,200 66% $1,056 69% 32 Cake 14% 1,353 8/26/2016 7.1 12.9 $26.00 14000 1.60 $1,025 66% $1,610 48% 33 Eat 13% 1,296 1/15/2016 5.5 14.5 $21.00 14500 3.09 $1,200 70% $1,056 69% 18 Egg 13% 1,277 5/18/2016 YES 7.1 12.9 $26.50 16000 1.96 $1,200 65% $1,056 69% 42 Baker 11% 1,015 12/23/2016 6.5 12.8 $25.00 17500 1.56 $1,000 62% $1,000 37% 33 Fast 9% 910 4/22/2015 5.5 14.5 $21.50 14000 3.08 $900 58% $725 36% 13 Able 8% 753 10/4/2016 6.4 13.5 $23.50 17000 2.05 $500 37% $500 27% 28 Acre 1% 49 11/5/2016 3.8 17.0 $17.40 16000 2.41 $500 35% $500 27% 0 Buddy 0% 32 5/4/2017 4.7 10.8 $33.00 19000 2.93 $800 44% $800 37% 0 Adam 0% 3 11/21/2016 9.6 8.9 $33.00 22000 1.63 $600 38% $660 27% 0
  • 77. CAPSTONE® COURIER Page 5 Low End Segment Analysis C58538 Round: 3Dec. 31, 2016 Low End Statistics Total Industry Unit Demand 12,488 Actual Industry Unit Sales 12,488 Segment % of Total Industry 38.2% Next Year's Segment Growth Rate 11.7% Low End Customer Buying Criteria Expectations Importance 1. Price $13.50 - 23.50 53% 2. Age Ideal Age = 7.0 24% 3. Ideal Position Pfmn 3.2 Size 16.8 16% 4. Reliability MTBF 12000-17000 7% Top Products in Low End Segment Name Market Share Units Sold to Seg Revision Date Stock Out
  • 78. Pfmn Coord Size Coord List Price MTBF Age Dec.31 Promo Budget Cust. Aware- ness Sales Budget Cust. Access- ibility Dec. Cust. Survey Ebb 19% 2,381 1/15/2015 3.0 17.0 $19.00 12000 7.60 $1,200 69% $1,056 48% 27 Cedar 19% 2,378 1/29/2014 3.0 17.0 $19.00 12000 7.60 $1,025 65% $1,690 47% 27
  • 79. Bead 19% 2,330 5/25/2009 3.0 17.0 $18.50 14000 7.60 $900 56% $1,000 37% 26 Dell 16% 1,984 5/25/2009 3.0 17.0 $21.00 14000 7.60 $1,225 72% $1,753 47% 22 Feat 11% 1,386 7/27/2018 YES 3.0 17.0 $21.50 13000 7.60 $1,100 68% $1,305 46% 19 Acre 9% 1,111 11/5/2016 3.8 17.0 $17.40 16000 2.41 $500 35% $500 19% 14 Eat 4% 457 1/15/2016 5.5 14.5 $21.00 14500 3.09 $1,200 70% $1,056 48% 6 Fast 3% 333 4/22/2015 5.5 14.5 $21.50 14000 3.08 $900 58% $725 46% 5 Baker 1% 110 12/23/2016 6.5 12.8 $25.00 17500 1.56 $1,000 62% $1,000 37% 0 Able 0% 10 10/4/2016 6.4 13.5 $23.50 17000 2.05 $500 37% $500 19% 0 Cake 0% 4 8/26/2016 7.1 12.9 $26.00 14000 1.60 $1,025 66% $1,610 47% 0 Echo 0% 4 8/20/2016 7.1 12.9 $26.50 15000 1.38 $1,200 66% $1,056 48% 0 CAPSTONE® COURIER Page 6 High End Segment Analysis C58538 Round: 3Dec. 31, 2016 High End Statistics Total Industry Unit Demand 4,007 Actual Industry Unit Sales 4,007 Segment % of Total Industry 12.3% Next Year's Segment Growth Rate 16.2% High End Customer Buying Criteria Expectations Importance
  • 80. 1. Ideal Position Pfmn 11.6 Size 8.4 43% 2. Age Ideal Age = 0.0 29% 3. Reliability MTBF 20000-25000 19% 4. Price $28.50 - 38.50 9% Top Products in High End Segment Name Market Share Units Sold to Seg Revision Date Stock Out Pfmn Coord Size Coord List Price MTBF Age Dec.31 Promo Budget
  • 81. Cust. Aware- ness Sales Budget Cust. Access- ibility Dec. Cust. Survey Fox 25% 983 12/11/2016 12.0 8.0 $38.50 25000 0.54 $1,100 41% $1,305 58% 41 Fist 23% 927 12/13/2016 11.3 8.6 $38.50 25000 1.11 $1,100 65% $1,305 58% 45 Dixie 21% 846 12/2/2016 11.3 8.7 $38.50 24500 1.15 $1,250 71% $1,753 53% 43 Cid 17% 700 12/17/2016 11.4 8.6 $37.00 23000 1.14 $1,000 60% $1,690 47% 36 Adam 7% 280 11/21/2016 9.6 8.9 $33.00 22000 1.63 $600 38% $660 23% 11 Bid 6% 251 6/9/2016 9.9 10.0 $36.50 22000 2.14 $1,000 57% $700 25% 8 Daze 0% 19 8/21/2016 7.5 12.6 $28.50 18400 1.60 $1,225 73% $1,670 53% 0 Egg 0% 2 5/18/2016 YES 7.1 12.9 $26.50 16000 1.96 $1,200 65% $1,056 17% 0 CAPSTONE® COURIER Page 7
  • 82. Performance Segment Analysis C58538 Round: 3Dec. 31, 2016 Performance Statistics Total Industry Unit Demand 3,293 Actual Industry Unit Sales 3,293 Segment % of Total Industry 10.1% Next Year's Segment Growth Rate 19.8% Performance Customer Buying Criteria Expectations Importance 1. Reliability MTBF 22000-27000 43% 2. Ideal Position Pfmn 12.4 Size 13.9 29% 3. Price $23.50 - 33.50 19% 4. Age Ideal Age = 1.0 9% Top Products in Performance Segment Name Market Share Units Sold to Seg Revision Date Stock Out Pfmn
  • 83. Coord Size Coord List Price MTBF Age Dec.31 Promo Budget Cust. Aware- ness Sales Budget Cust. Access- ibility Dec. Cust. Survey Coat 26% 844 5/1/2016 12.4 13.9 $32.00 27000 1.57 $1,000 59% $1,529 37% 39 Dot 25% 834 8/2/2016 12.8 13.5 $33.50 27000 1.44 $1,200 69% $1,586 42% 39 Foam 24% 788 9/18/2016 12.8 13.5 $33.40 27000 1.37 $1,100 64% $1,305 35% 36
  • 84. Aft 11% 355 10/15/2016 YES 11.4 14.6 $29.90 27000 1.54 $600 36% $600 18% 26 Bold 8% 266 7/16/2016 11.4 15.1 $33.00 26000 1.92 $300 32% $300 17% 15 Doom 6% 206 8/8/2016 13.0 13.4 $33.50 27000 0.39 $1,200 53% $0 42% 32 CAPSTONE® COURIER Page 8 Size Segment Analysis C58538 Round: 3Dec. 31, 2016 Size Statistics Total Industry Unit Demand 3,284 Actual Industry Unit Sales 3,284 Segment % of Total Industry 10.1% Next Year's Segment Growth Rate 18.3% Size Customer Buying Criteria Expectations Importance 1. Ideal Position Pfmn 6.1 Size 7.6 43% 2. Age Ideal Age = 1.5 29% 3. Reliability MTBF 16000-21000 19% 4. Price $23.50 - 33.50 9% Top Products in Size Segment Name Market Share Units Sold to
  • 86. Cust. Survey Dune 30% 998 10/16/2016 6.5 7.4 $33.50 19000 1.35 $1,200 69% $1,586 45% 40 Fume 26% 870 12/11/2016 6.1 7.2 $33.50 16000 1.26 $1,100 64% $1,305 38% 29 Cure 25% 818 9/11/2016 6.1 7.6 $32.00 17000 1.43 $1,000 59% $1,529 40% 35 Agape 11% 368 7/30/2016 5.4 8.6 $29.00 19000 2.09 $600 34% $600 23% 17 Buddy 5% 175 5/4/2017 4.7 10.8 $33.00 19000 2.93 $800 44% $800 24% 5 Able 2% 53 10/4/2016 6.4 13.5 $23.50 17000 2.05 $500 37% $500 23% 0 Bid 0% 3 6/9/2016 9.9 10.0 $36.50 22000 2.14 $1,000 57% $700 24% 0 CAPSTONE® COURIER Page 9 Market Share C58538 Round: 3Dec. 31, 2016 Actual Market Share in Units Potential Market Share in Units Trad Low High Pfmn Size Total Trad Low High Pfmn Size Total Industry Unit Sales 9,619 12,488 4,007 3,293 3,284 32,691 Units Demanded 9,619 12,488 4,007 3,293 3,284 32,691 % of Market 29.4% 38.2% 12.3% 10.1% 10.1% 100.0% % of Market 29.4% 38.2% 12.3% 10.1% 10.1% 100.0% Able 7.8% 1.6% 2.5% Able 7.5% 1.6% 2.4% Acre 0.5% 8.9% 3.5% Acre 0.5% 8.7% 3.5% Adam 7.0% 0.9% Adam 6.4% 0.8%
  • 87. Aft 10.8% 1.1% Aft 12.6% 1.3% Agape 11.2% 1.1% Agape 11.2% 1.1% Total 8.4% 9.0% 7.0% 10.8% 12.8% 9.1% Total 8.0% 8.8% 6.4% 12.6% 12.8% 9.0% Baker 10.5% 0.9% 3.4% Baker 10.2% 0.9% 3.3% Bead 18.7% 7.1% Bead 18.2% 7.0% Bid 6.3% 0.8% Bid 5.6% 0.7% Bold 8.1% 0.8% Bold 7.9% 0.8% Buddy 0.3% 5.3% 0.6% Buddy 0.3% 5.3% 0.6% Total 10.9% 19.5% 6.3% 8.1% 5.4% 12.8% Total 10.5% 19.1% 5.6% 7.9% 5.4% 12.4% Cake 14.1% 4.2% Cake 13.5% 4.0% Cedar 19.0% 7.3% Cedar 18.6% 7.1% Cid 17.5% 2.1% Cid 16.0% 2.0% Coat 25.6% 2.6% Coat 25.1% 2.5% Cure 24.9% 2.5% Cure 24.9% 2.5% Total 14.1% 19.1% 17.5% 25.6% 24.9% 18.6% Total 13.5% 18.6% 16.0% 25.1% 24.9% 18.1% Daze 15.5% 0.5% 4.6% Daze 14.9% 0.4% 4.4% Dell 15.9% 6.1% Dell 15.5% 5.9% Dixie 21.1% 2.6% Dixie 19.4% 2.4% Dot 25.3% 2.5% Dot 24.8% 2.5% Dune 30.4% 3.0% Dune 30.4% 3.1% Doom 6.3% 0.6% Doom 6.1% 0.6% Total 15.5% 15.9% 21.6% 31.6% 30.4% 19.5% Total 14.9% 15.5% 19.8% 30.9% 30.4% 18.9% Eat 13.5% 3.7% 5.4% Eat 13.0% 3.6% 5.2% Ebb 19.1% 7.3% Ebb 18.6% 7.1% Echo 14.9% 4.4% Echo 14.4% 4.2% Egg 13.3% 3.9% Egg 16.5% 4.9% Total 41.7% 22.8% 21.0% Total 43.9% 22.3% 21.4%
  • 88. Fast 9.5% 2.7% 3.8% Fast 9.1% 2.6% 3.7% Feat 11.1% 4.2% Feat 13.1% 5.0% Fist 23.1% 2.8% Fist 21.2% 2.6% Foam 23.9% 2.4% Foam 23.4% 2.4% Fume 26.5% 2.7% Fume 26.5% 2.7% Fox 24.5% 3.0% Fox 30.9% 3.8% Total 9.5% 13.8% 47.7% 23.9% 26.5% 19.0% Total 9.1% 15.7% 52.1% 23.4% 26.5% 20.1% CAPSTONE® COURIER Page 10 Perceptual Map C58538 Round: 3Dec. 31, 2016 Andrews Baldwin Chester Name Pfmn Size Revised Name Pfmn Size Revised Name Pfmn Size Revised Able 6.4 13.5 10/4/2016 Baker 6.5 12.8 12/23/2016 Cake 7.1 12.9 8/26/2016 Acre 3.8 17.0 11/5/2016 Bead 3.0 17.0 5/25/2009 Cedar 3.0 17.0 1/29/2014 Adam 9.6 8.9 11/21/2016 Bid 9.9 10.0 6/9/2016 Cid 11.4 8.6 12/17/2016 Aft 11.4 14.6 10/15/2016 Bold 11.4 15.1 7/16/2016 Coat 12.4 13.9 5/1/2016 Agape 5.4 8.6 7/30/2016 Buddy 4.7 10.8 5/4/2017 Cure 6.1 7.6 9/11/2016 Abum 6.0 15.0 4/17/2016 Ajoy 6.2 15.0 5/1/2016 Apps 5.9 15.0 4/19/2016 Digby Erie Ferris Name Pfmn Size Revised Name Pfmn Size Revised Name Pfmn Size Revised Daze 7.5 12.6 8/21/2016 Eat 5.5 14.5 1/15/2016 Fast
  • 89. 5.5 14.5 4/22/2015 Dell 3.0 17.0 5/25/2009 Ebb 3.0 17.0 1/15/2015 Feat 3.0 17.0 7/27/2018 Dixie 11.3 8.7 12/2/2016 Echo 7.1 12.9 8/20/2016 Fist 11.3 8.6 12/13/2016 Dot 12.8 13.5 8/2/2016 Egg 7.1 12.9 5/18/2016 Foam 12.8 13.5 9/18/2016 Dune 6.5 7.4 10/16/2016 Fume 6.1 7.2 12/11/2016 Doom 13.0 13.4 8/8/2016 Fox 12.0 8.0 12/11/2016 CAPSTONE® COURIER Page 11 HR/TQM Report C58538 Round: 3Dec. 31, 2016 HUMAN RESOURCES SUMMARY Andrews Baldwin Chester Digby Erie Ferris Needed Complement 531 911 855 1,037 988 987 Complement 531 911 855 1,037 988 987 1st Shift Complement 521 745 567 687 548 569 2nd Shift Complement 10 166 288 350 440 418 Overtime Percent 0.0% 0.0% 0.0% 0.0% 0.0% 0.0% Turnover Rate 10.0% 10.0% 10.0% 10.0% 10.0% 10.0% New Employees 53 176 86 213 346 264 Separated Employees 580 0 68 0 0 0 Recruiting Spend $0 $0 $0 $0 $0 $0 Training Hours 0 0 0 0 0 0 Productivity Index 100.0% 100.0% 100.0% 100.0% 100.0% 100.0% Recruiting Cost $53 $176 $86 $213 $346 $264 Separation Cost $2,900 $0 $340 $0 $0 $0 Training Cost $0 $0 $0 $0 $0 $0
  • 90. Total HR Admin Cost $2,953 $176 $426 $213 $346 $264 Labor Contract Next Year Wages $24.31 $24.31 $24.31 $24.31 $24.31 $24.31 Benefits 2,500 2,500 2,500 2,500 2,500 2,500 Profit Sharing 2.0% 2.0% 2.0% 2.0% 2.0% 2.0% Annual Raise 5.0% 5.0% 5.0% 5.0% 5.0% 5.0% Starting Negotiation Position Wages Benefits Profit Sharing Annual Raise Ceiling Negotiation Position Wages Benefits Profit Sharing Annual Raise Adjusted Labor Demands Wages Benefits Profit Sharing Annual Raise Strike Days TQM SUMMARY Andrews Baldwin Chester Digby Erie Ferris Process Mgt Budgets Last Year CPI Systems $0 $0 $0 $0 $0 $0 Vendor/JIT $0 $0 $0 $0 $0 $0 Quality Initiative Training $0 $0 $0 $0 $0 $0 Channel Support Systems $0 $0 $0 $0 $0 $0
  • 91. Concurrent Engineering $0 $0 $0 $0 $0 $0 UNEP Green Programs $0 $0 $0 $0 $0 $0 TQM Budgets Last Year Benchmarking $0 $0 $0 $0 $0 $0 Quality Function Deployment Effort $0 $0 $0 $0 $0 $0 CCE/6 Sigma Training $0 $0 $0 $0 $0 $0 GEMI TQEM Sustainability Initiatives $0 $0 $0 $0 $0 $0 Total Expenditures $0 $0 $0 $0 $0 $0 Cumulative Impacts Material Cost Reduction 0.00% 0.00% 0.00% 0.00% 0.00% 0.00% Labor Cost Reduction 0.00% 0.00% 0.00% 0.00% 0.00% 0.00% Reduction R&D Cycle Time 0.00% 0.00% 0.00% 0.00% 0.00% 0.00% Reduction Admin Costs 0.00% 0.00% 0.00% 0.00% 0.00% 0.00% Demand Increase 0.00% 0.00% 0.00% 0.00% 0.00% 0.00% CAPSTONE® COURIER Page 12 Ethics Report C58538 Round: 3Dec. 31, 2016 ETHICS SUMMARY Other (Fees, Writeoffs, etc.) The actual dollar impact. Example, $120 means Other increased by $120. Demand Factor The % of normal. 98% means demand fell 2%. Material Cost Impact The % of normal. 104% means matieral costs rose 4%. Admin Cost Impact The % of normal. 103% means admin costs rose 3%. Productivity Impact The % of normal. 104% means productivity increased by 4%.
  • 92. Awareness Impact The % of normal. 105% means normal awareness was multiplied by 1.05. Accessibility Impact The % of normal. 98% means normal accessiblity was multiplied by 0.98. Normal means the value that would have been produced if the problem had not been presented. No Impact Andrews Baldwin Chester Digby Erie Ferris Total Other (Fees, Writeoffs, etc.) $0 $0 $0 $0 $0 $0 $0 Demand Factor 100% 100% 100% 100% 100% 100% 100% Material Cost Impact 100% 100% 100% 100% 100% 100% 100% Admin Cost Impact 100% 100% 100% 100% 100% 100% 100% Productivity Impact 100% 100% 100% 100% 100% 100% 100% Awareness Impact 100% 100% 100% 100% 100% 100% 100% Accessibility Impact 100% 100% 100% 100% 100% 100% 100% CAPSTONE® COURIER Page 13 Annual Report Annual Report Andrews C58538 Round: 3Dec. 31, 2016 Balance Sheet DEFINITIONS: Common Size: The common size column simply represents each item as a percentage of total assets for that year. Cash: Your end-of-year cash position. Accounts Receivable: Reflects the lag between delivery and payment of your products. Inventories: The current value of your inventory across all products. A
  • 93. zero indicates your company stocked out. Unmet demand would, of course, fall to your competitors. Plant & Equipment: The current value of your plant. Accum Deprec: The total accumulated depreciation from your plant. Accts Payable: What the company currently owes suppliers for materials and services. Current Debt: The debt the company is obligated to pay during the next year of operations. It includes emergency loans used to keep your company solvent should you run out of cash during the year. Long Term Debt: The company's long term debt is in the form of bonds, and this represents the total value of your bonds. Common Stock: The amount of capital invested by shareholders in the company. Retained Earnings: The profits that the company chose to keep instead of paying to shareholders as dividends. ASSETS 2016 Common Size 2015 Cash $0 0.0% $0 Account Receivable $5,750 3.4% $3,489 Inventory $110,681 66.3% $109,294 Total Current Assets $116,431 69.7% $112,783 Plant & Equipment $108,400 64.9% $108,400 Accumulated Depreciation ($57,813) -34.6% ($50,587)
  • 94. Total Fixed Assets $50,587 30.3% $57,813 Total Assets $167,018 100.0% $170,597 LIABILITIES & OWNER'S EQUITY Accounts Payable $4,931 3.0% $10,973 Current Debt $125,793 75.3% $90,856 Long Term Debt $31,775 19.0% $31,775 Total Liabilities $162,499 97.3% $133,604 Common Stock $28,360 17.0% $28,360 Retained Earnings ($23,841) -14.3% $8,633 Total Equity $4,519 2.7% $36,993 Total Liab. & O. Equity $167,018 100.0% $170,597 Cash Flow Statement The Cash Flow Statement examines what happened in the Cash Account during the year. Cash injections appear as positive numbers and cash withdrawals as negative numbers. The Cash Flow Statement is an excellent tool for diagnosing emergency loans. When negative cash flows exceed positives, you are forced to seek emergency funding. For example, if sales are bad and you find yourself carrying an abundance of excess inventory, the report would show the increase in inventory as a huge negative cash flow. Too much unexpected inventory could outstrip your inflows, exhaust your starting cash and force you to beg for money to keep your company afloat. Cash Flows from Operating Activities 2016 2015
  • 95. NetIncome(Loss) ($32,474) ($14,820) Depreciation $7,227 $7,227 Extraordinary gains/losses/writeoffs $0 $0 Accounts Payable ($6,042) $3,651 Inventory ($1,387) ($75,921) Accounts Receivable ($2,261) $135 Net cash from operation ($34,937) ($79,728) Cash Flows from Investing Activities Plant Improvements $0 $0 Cash Flows from Financing Activities Dividends Paid $0 $0 Sales of Common Stock $0 $0 Purchase of Common Stock $0 $0 Cash from long term debt $0 $0 Retirement of long term debt $0 $0 Change in current debt(net) $34,937 $79,728 Net Cash from financing activities $34,937 $79,728 Net Change in cash position $0 $0 Closing cash position $0 $0 Annual Report Page 14 Annual Report Andrews C58538 Round: 3Dec. 31, 2016 2016 Income Statement (Product Name) Able Acre Adam Aft Agape Abum Ajoy Apps 2016 Total Common Size
  • 96. Sales $19,157 $20,181 $9,356 $10,609 $10,659 $0 $0 $0 $69,962 100.0% Variable Costs: Direct Labor $7,248 $8,912 $2,704 $3,727 $3,711 $0 $0 $0 $26,302 37.6% Direct Material $9,032 $9,053 $4,296 $5,156 $4,769 $0 $0 $0 $32,306 46.2% Inventory Carry $8,391 $2,575 $1,108 $0 $1,208 $0 $0 $0 $13,282 19.0% Total Variable $24,671 $20,539 $8,109 $8,883 $9,688 $0 $0 $0 $71,890 102.8% Contribution Margin ($5,514) ($358) $1,247 $1,726 $971 $0 $0 $0 ($1,928) -2.8% Period Costs: Depreciation $2,640 $2,427 $1,080 $360 $720 $0 $0 $0 $7,227 10.3% SG&A: R&D $771 $859 $904 $801 $586 $297 $337 $304 $4,858 6.9% Promotions $500 $500 $600 $600 $600 $0 $0 $0 $2,800 4.0% Sales $500 $500 $660 $600 $600 $0 $0 $0 $2,860 4.1% Admin $943 $993 $460 $522 $525 $0 $0 $0 $3,443 4.9% Total Period $5,353 $5,279 $3,704 $2,883 $3,031 $297 $337 $304 $21,188 30.3% Net Margin ($10,868) ($5,636) ($2,457) ($1,157) ($2,060) ($297) ($337) ($304) ($23,116) -33.0% Definitions: Sales: Unit Sales times list price. Direct Labor: Labor costs incurred to produce the product that was sold. Inventory Carry Cost: the cost unsold goods in inventory. Depreciation: Calculated on straight-line. 15-year depreciation of plant value. R&D Costs: R&D department
  • 97. expenditures for each product. Admin: Administration overhead is estimated at 1.5% of sales. Promotions: The promotion budget for each product. Sales: The sales force budget for each product. Other: Chargs not included in other categories such as Fees, Write offs, and TQM. The fees include money paid to investment bankers and brokerage firms to issue new stocks or bonds plus consulting fees your instructor might assess. Write-offs include the loss you might experience when you sell capacity or liquidate inventory as the result of eliminating a production line. If the amount appears as a negative amount, then you actually made money on the liquidation of capacity or inventory. EBIT: Earnings Before Interest and Taxes. Short Term Interest: Interest expense based on last year''s current debt, including short term debt, long term notes that have become due, and emergency loans, Long Term Interest: Interest paid on outstanding bonds. Taxes: Income tax based upon a 35% tax rate. Profit Sharing: Profits shared with employees under the labor contract. Net Profit: EBIT minus interest, taxes, and profit sharing. Other $0 0.0% EBIT ($23,116) -33.0% Short Term Interest $22,559 32.2% Long Term Interest $4,285 6.1% Taxes ($17,486) -25.0% Profit Sharing $0 0.0% Net Profit ($32,474) -46.4% Annual Report Page 15 C58538Front PageStock & BondsFinancial SummaryProduction AnalysisTraditional Segment AnalysisLow End Segment AnalysisHigh End Segment AnalysisPerformance Segment AnalysisSize Segment AnalysisMarket SharePerceptual
  • 98. MapHR/TQM ReportEthics ReportAnnual ReportAndrewsBalance SheetIncome Statement Round: 2 Dec. 31, 2015 C58538 Andrews Eugene Ellis Philip Mull Baldwin Lisa Chastain Monica Dalke matt rix Chester Digby Erie Ferris Selected Financial Statistics Andrews Baldwin Chester Digby Erie Ferris ROS -17.5% -3.1% 7.6% 7.5% 6.9% 7.3% Asset Turnover 0.50 0.97 1.26 1.19 1.02 1.33 ROA -8.7% -3.0% 9.6% 9.0% 7.0% 9.6% Leverage (Assets/Equity) 4.6 2.1 2.0 2.0 2.0 2.0 ROE -40.1% -6.4% 18.7% 17.7% 14.3% 19.1% Emergency Loan $90,856,063 $0 $0 $0 $0 $0
  • 99. Sales $84,906,613 $101,934,574 $160,473,126 $164,573,195 $126,745,923 $141,932,500 EBIT ($4,019,505) $575,275 $25,536,640 $26,615,239 $20,679,294 $21,642,788 Profits ($14,819,574) ($3,131,651) $12,120,371 $12,397,854 $8,787,171 $10,296,970 Cumulative Profit ($15,705,998) $5,376,139 $21,409,632 $24,098,279 $18,874,712 $22,067,437 SG&A / Sales 13.0% 11.5% 10.0% 11.3% 8.9% 12.5% Contrib. Margin % 16.7% 19.5% 30.7% 32.2% 31.3% 31.4% CAPSTONE® COURIER Page 1 Stock & Bonds C58538 Round: 2Dec. 31, 2015 Stock Market Summary Company Close Change Shares MarketCap ($M) Book Value EPS Dividend Yield P/E Andrews $1.00 ($16.30) 2,291,939 $2 $16.14 ($6.47) $0.00 0.0% -0.1 Baldwin $24.19 ($14.61) 2,000,000 $48 $24.56 ($1.57) $0.00 0.0% -15.5 Chester $55.14 $14.77 2,069,366 $114 $31.29 $5.86 $1.35 2.4% 9.4 Digby $59.71 $14.57 2,050,451 $122 $34.12 $6.05 $0.00 0.0% 9.9 Erie $49.42 $7.56 2,128,085 $105 $28.94 $4.13 $2.55 5.2% 12.0 Ferris $55.88 $10.61 2,000,000 $112 $26.93 $5.15 $2.13 3.8%
  • 100. 10.8 Bond Market Summary Company Series# Face Yield Close$ S&P Company Series# Face Yield Close$ S&P Andrews Digby 12.5S2017 $10,924,506 12.9% 97.21 DDD 12.5S2017 $13,828,904 12.4% 100.51 B 14.0S2019 $20,850,000 14.1% 99.42 DDD 14.0S2019 $20,850,000 13.3% 105.44 B Baldwin 11.6S2025 $3,523,690 12.0% 96.64 B 12.5S2017 $13,900,000 12.5% 99.83 CCC Erie 14.0S2019 $20,850,000 13.4% 104.20 CCC 12.5S2017 $13,900,000 12.5% 100.34 B Chester 14.0S2019 $20,850,000 13.3% 105.13 B 12.5S2017 $13,900,000 12.4% 100.67 B 11.7S2025 $1,722,021 12.1% 96.65 B 14.0S2019 $20,850,000 13.2% 105.76 B Ferris 12.5S2017 $4,616,365 12.4% 100.51 B 14.0S2019 $20,850,000 13.3% 105.44 B Next Year's Prime Rate 8.00% CAPSTONE® COURIER Page 2 Financial Summary C58538 Round: 2Dec. 31, 2015 Cash Flow Statement Survey Andrews Baldwin Chester Digby Erie Ferris CashFlows from operating activities Net Income(Loss) ($14,820) ($3,132) $12,120 $12,398 $8,787
  • 101. $10,297 Adjustment for non-cash items: Depreciation $7,227 $7,587 $7,707 $7,653 $8,255 $5,987 Extraordinary gains/losses/writeoffs $0 $0 $8 $7 ($539) ($802) Changes in current assets and liablilities Acounts payable $3,651 $12 $2,546 $3,222 $571 $1,977 Inventory ($75,921) ($5,906) ($3,356) ($6,085) $2,160 ($4,336) Accounts Receivable $135 $3,847 ($3,151) ($3,515) ($1,014) ($1,929) Net cash from operations ($79,728) $2,408 $15,874 $13,680 $18,219 $11,194 Cash flows from investing activities Plant improvements(net) $0 $0 ($5,640) ($22,620) ($7,792) ($7,810) Cash flows from financing activities Dividends paid $0 $0 ($2,790) $0 ($5,433) ($4,265) Sales of common stock $0 $0 $0 $1,588 $0 $0 Purchase of common stock $0 $0 $0 $0 $0 $0 Cash from long term debt issued $0 $0 $0 $3,524 $1,722 $0 Early retirement of long term debt $0 $0 ($858) $0 $0 ($1,311) Retirement of current debt ($11,128) $0 ($11,359) ($11,359) ($11,359) ($11,359) Cash from current debt borrowing $0 $0 $17,065 $20,549 $15,867 $19,431 Cash from emergency loan $90,856 $0 $0 $0 $0 $0 Net cash from financing activities $79,728 $0 $2,057 $14,302 $798 $2,496 Net change in cash position $0 $2,408 $12,291 $5,362 $11,225 $5,881 Balance Sheet Survey Andrews Baldwin Chester Digby Erie Ferris Cash $0 $21,426 $33,226 $28,693 $32,320 $27,119
  • 102. Accounts Receivable $3,489 $16,756 $13,190 $13,527 $10,417 $11,666 Inventory $109,294 $6,296 $9,644 $11,949 $5,031 $11,285 Total Current Assets $112,783 $44,478 $56,060 $54,169 $47,768 $50,070 Plant and equipment $108,400 $113,800 $115,600 $129,800 $123,818 $89,800 Accumulated Depreciation ($50,587) ($53,107) ($44,853) ($45,707) ($46,928) ($32,867) Total Fixed Assets $57,813 $60,693 $70,747 $84,093 $76,890 $56,933 Total Assets $170,597 $105,172 $126,806 $138,262 $124,658 $107,004 Account Payable $10,973 $14,342 $9,318 $9,548 $6,926 $8,250 CurrentDebt $90,856 $6,950 $17,989 $20,549 $19,677 $19,431 Long Term Debt $31,775 $34,750 $34,750 $38,203 $36,472 $25,466 Total Liabilities $133,604 $56,042 $62,057 $68,299 $63,075 $53,147 Common Stock $28,360 $18,360 $20,736 $20,471 $22,747 $18,360 Retained Earnings $8,633 $30,770 $44,013 $49,492 $38,836 $35,497 Total Equity $36,993 $49,129 $64,749 $69,963 $61,583 $53,857 Total Liabilities & Owners'' Equity $170,597 $105,172 $126,806 $138,262 $124,658 $107,004 Income Statement Survey Andrews Baldwin Chester Digby Erie Ferris Sales $84,907 $101,935 $160,473 $164,573 $126,746 $141,933 Variable Costs(Labor,Material,Carry) $70,701 $82,098
  • 103. $111,175 $111,513 $87,035 $97,389 Depreciation $7,227 $7,587 $7,707 $7,653 $8,255 $5,987 SGA(R&D,Promo,Sales,Admin) $10,999 $11,674 $16,034 $18,529 $11,230 $17,696 Other(Fees,Writeoffs,TQM,Bonuses) $0 $0 $21 $262 ($453) ($782) EBIT ($4,020) $575 $25,537 $26,615 $20,679 $21,643 Interest(Short term,Long term) $18,780 $5,393 $6,509 $7,152 $6,885 $5,478 Taxes ($7,980) ($1,686) $6,660 $6,812 $4,828 $5,658 Profit Sharing $0 $0 $247 $253 $179 $210 Net Profit ($14,820) ($3,132) $12,120 $12,398 $8,787 $10,297 CAPSTONE® COURIER Page 3 Production Analysis C58538 Round: 2Dec. 31, 2015 Name Primary Segment Units Sold Unit Inven tory Revision Date Age Dec.31 MTBF Pfmn Coord
  • 104. Size Coord Price Material Cost Labor Cost Contr. Marg. 2nd Shift & Over- time Auto mation Next Round Capacity Next Round Plant Utiliz. Able Trad 630 3,376 5/3/2015 2.9 19000 6.0 12.5 $29.50 $11.49 $9.42 -12% 44% 4.0 1,800 143% Acre Low 822 1,159 4/3/2015 3.7 16000 4.5 16.0 $24.50 $8.18
  • 105. $8.05 23% 43% 5.0 1,400 141% Adam High 460 410 5/12/2015 2.2 24000 8.9 10.0 $39.00 $15.52 $9.40 30% 0% 3.0 900 88% Aft Pfmn 399 8 4/10/2015 1.9 26000 10.4 15.3 $34.00 $14.84 $10.51 24% 33% 3.0 300 132% Agape Size 432 527 1/29/2015 2.8 19000 5.0 9.5 $34.00 $12.88 $10.51 21% 33% 3.0 600 132% Baker Trad 1,474 0 3/9/2015 2.1 17500 5.6 14.2 $24.00 $10.00 $8.83 20% 0% 4.0 1,800 82% Bead Low 1,750 0 5/25/2009 6.6 14000 3.0 17.0 $17.50 $6.38 $8.52 13% 36% 5.0 1,400 125% Bid High 343 222 6/9/2016 2.7 23000 8.0 11.5 $34.50 $14.07 $10.10 23% 0% 3.0 900 62% Bold Pfmn 397 34 9/15/2015 2.4 24000 10.5 15.1 $31.50 $14.36 $10.10 21% 0% 3.0 600 71% Buddy Size 373 0 5/9/2015 1.9 19000 4.7 10.8 $31.00 $12.00 $10.10 28% 0% 3.0 600 61% Cake Trad 1,381 173 8/26/2015 1.9 14000 6.4 13.6 $26.50 $9.61 $8.08 32% 45% 5.5 1,000 144% Cedar Low 2,601 0 1/29/2014 6.6 12000 3.0 17.0 $19.50 $5.78 $6.44 36% 86% 7.5 1,400 184% Cid High 837 161 11/15/2015 1.3 23000 10.2 9.8 $37.50 $15.92 $11.03 28% 58% 3.0 600 157% Coat Pfmn 643 23 11/3/2015 1.5 27000 11.8 13.9 $32.50 $16.38 $9.39 23% 0% 4.0 600 99% Cure Size 642 75 9/10/2015 1.6 17000 5.4 8.6 $32.50 $12.94 $10.03 28% 17% 4.0 600 116% Daze Trad 1,465 165 8/22/2015 1.8 18100 6.8 13.3 $29.00 $11.17 $7.80 34% 29% 5.0 1,200 128% Dell Low 2,125 0 5/25/2009 6.6 14000 3.0 17.0 $21.50 $6.38 $6.80 37% 50% 7.0 1,400 149% Dixie High 846 188 12/3/2015 1.2 24000 10.2 9.8 $39.00 $16.22 $11.62 29% 100% 3.0 650 198%
  • 106. Dot Pfmn 647 39 11/13/2015 1.5 27000 11.8 13.9 $34.00 $16.38 $9.74 25% 8% 3.0 650 107% Dune Size 629 120 11/13/2015 1.5 19000 5.8 8.6 $34.00 $13.65 $10.03 30% 17% 3.0 700 116% Doom 0 0 8/8/2016 0.0 0 0.0 0.0 $0.00 $0.00 $0.00 0% 0% 6.0 500 0% Eat Trad 1,550 119 4/8/2015 2.1 15500 5.5 14.5 $27.00 $9.21 $7.47 36% 14% 7.0 1,400 113% Ebb Low 2,406 0 1/15/2015 6.6 12000 3.0 17.0 $19.50 $5.78 $7.03 33% 71% 6.0 1,400 170% Echo Trad 1,216 50 7/20/2015 1.4 16000 6.4 13.6 $27.00 $10.21 $9.20 24% 33% 5.0 900 132% Edge Pfmn 83 0 6/30/2011 4.5 25000 9.4 15.5 $34.00 $13.87 $11.62 28% 99% 3.0 1 198% Egg Size 68 91 12/24/2015 2.3 19000 6.9 13.4 $34.00 $11.44 $9.40 26% 0% 3.0 600 17% Fast Trad 1,146 221 4/22/2015 2.1 14000 5.5 14.5 $29.00 $8.76 $9.72 33% 63% 4.0 800 161% Feat Low 1,478 0 7/27/2018 6.6 13000 3.0 17.0 $22.00 $6.08 $8.72 32% 100% 6.0 700 198% Fist High 847 165 12/22/2015 1.2 25000 10.2 9.8 $39.00 $16.52 $11.50 29% 90% 3.0 600 188% Foam Pfmn 622 31 11/11/2015 1.5 27000 11.8 14.2 $34.00 $16.30 $8.22 29% 0% 4.0 600 99% Fume Size 647 84 11/9/2015 1.5 19000 5.4 8.4 $34.00 $13.67 $8.78 34% 17% 4.0 600 116% Fox 0 0 12/12/2015 0.0 25000 11.0 9.0 $39.00 $0.00 $0.00 0% 0% 5.5 500 0% CAPSTONE® COURIER Page 4 Traditional Segment Analysis C58538 Round: 2Dec. 31, 2015
  • 107. Traditional Statistics Total Industry Unit Demand 8,809 Actual Industry Unit Sales 8,809 Segment % of Total Industry 30.4% Next Year's Segment Growth Rate 9.2% Traditional Customer Buying Criteria Expectations Importance 1. Age Ideal Age = 2.0 47% 2. Price $19.00 - 29.00 23% 3. Ideal Position Pfmn 6.4 Size 13.6 21% 4. Reliability MTBF 14000-19000 9% Top Products in Traditional Segment Name Market Share Units Sold to Seg Revision Date Stock Out Pfmn Coord Size
  • 108. Coord List Price MTBF Age Dec.31 Promo Budget Cust. Aware- ness Sales Budget Cust. Access- ibility Dec. Cust. Survey Eat 16% 1,443 4/8/2015 5.5 14.5 $27.00 15500 2.09 $1,050 63% $1,085 54% 31 Daze 16% 1,424 8/22/2015 6.8 13.3 $29.00 18100 1.84 $1,100 66% $1,440 53% 36 Baker 16% 1,413 3/9/2015 YES 5.6 14.2 $24.00 17500 2.12 $1,000 61% $1,000 43% 40 Cake 15% 1,343 8/26/2015 6.4 13.6 $26.50 14000 1.87 $1,100 66% $1,270 47% 35 Echo 13% 1,177 7/20/2015 6.4 13.6 $27.00 16000 1.40
  • 109. $1,050 57% $775 54% 29 Fast 13% 1,146 4/22/2015 5.5 14.5 $29.00 14000 2.08 $900 59% $1,235 48% 24 Able 6% 536 5/3/2015 6.0 12.5 $29.50 19000 2.88 $500 46% $500 35% 12 Acre 2% 198 4/3/2015 4.5 16.0 $24.50 16000 3.67 $500 42% $500 35% 3 Buddy 1% 115 5/9/2015 YES 4.7 10.8 $31.00 19000 1.93 $800 44% $800 43% 6 Bold 0% 8 9/15/2015 10.5 15.1 $31.50 24000 2.39 $800 44% $800 43% 0 Dell 0% 1 5/25/2009 YES 3.0 17.0 $21.50 14000 6.60 $1,100 64% $1,512 53% 0 Ebb 0% 1 1/15/2015 YES 3.0 17.0 $19.50 12000 6.60 $1,050 62% $1,085 54% 0 CAPSTONE® COURIER Page 5 Low End Segment Analysis C58538 Round: 2Dec. 31, 2015 Low End Statistics Total Industry Unit Demand 11,180 Actual Industry Unit Sales 11,180 Segment % of Total Industry 38.6% Next Year's Segment Growth Rate 11.7% Low End Customer Buying Criteria Expectations Importance 1. Price $14.00 - 24.00 53% 2. Age Ideal Age = 7.0 24% 3. Ideal Position Pfmn 2.7 Size 17.3 16% 4. Reliability MTBF 12000-17000 7%
  • 110. Top Products in Low End Segment Name Market Share Units Sold to Seg Revision Date Stock Out Pfmn Coord Size Coord List Price MTBF Age Dec.31 Promo Budget Cust. Aware- ness
  • 111. Sales Budget Cust. Access- ibility Dec. Cust. Survey Cedar 23% 2,600 1/29/2014 YES 3.0 17.0 $19.50 12000 6.60 $1,100 64% $1,333 40% 25 Ebb 22% 2,405 1/15/2015 YES 3.0 17.0 $19.50 12000 6.60 $1,050 62% $1,085 36% 23 Dell 19% 2,124 5/25/2009 YES 3.0 17.0 $21.50 14000 6.60 $1,100 64% $1,512 42% 20 Bead 16% 1,750 5/25/2009 YES 3.0 17.0 $17.50 14000 6.60 $900 56% $800 31% 32 Feat 13% 1,477 7/27/2018 YES 3.0 17.0 $22.00 13000 6.60 $1,100 64% $1,235 36% 17 Acre 6% 624 4/3/2015 4.5 16.0 $24.50 16000 3.67 $500 42% $500 24% 2 Eat 1% 107 4/8/2015 5.5 14.5 $27.00 15500 2.09 $1,050 63% $1,085 36% 0 Baker 1% 56 3/9/2015 YES 5.6 14.2 $24.00 17500 2.12 $1,000 61% $1,000 31% 1 Cake 0% 36 8/26/2015 6.4 13.6 $26.50 14000 1.87 $1,100 66% $1,270 40% 0 CAPSTONE® COURIER Page 6 High End Segment Analysis C58538 Round: 2Dec. 31, 2015
  • 112. High End Statistics Total Industry Unit Demand 3,448 Actual Industry Unit Sales 3,448 Segment % of Total Industry 11.9% Next Year's Segment Growth Rate 16.2% High End Customer Buying Criteria Expectations Importance 1. Ideal Position Pfmn 10.7 Size 9.3 43% 2. Age Ideal Age = 0.0 29% 3. Reliability MTBF 20000-25000 19% 4. Price $29.00 - 39.00 9% Top Products in High End Segment Name Market Share Units Sold to Seg Revision Date Stock Out Pfmn Coord Size
  • 113. Coord List Price MTBF Age Dec.31 Promo Budget Cust. Aware- ness Sales Budget Cust. Access- ibility Dec. Cust. Survey Fist 25% 847 12/22/2015 10.2 9.8 $39.00 25000 1.18 $1,100 61% $1,235 44% 36 Dixie 25% 846 12/3/2015 10.2 9.8 $39.00 24000 1.23 $1,100 63% $1,512 51% 36 Cid 24% 837 11/15/2015 10.2 9.8 $37.50 23000 1.25 $1,000 58% $1,333 44% 30 Adam 13% 460 5/12/2015 8.9 10.0 $39.00 24000 2.17 $600 43% $660 30% 10 Bid 10% 340 6/9/2016 8.0 11.5 $34.50 23000 2.72 $1,000
  • 114. 53% $700 31% 5 Daze 1% 36 8/22/2015 6.8 13.3 $29.00 18100 1.84 $1,100 66% $1,440 51% 0 Echo 1% 24 7/20/2015 6.4 13.6 $27.00 16000 1.40 $1,050 57% $775 26% 0 Able 1% 19 5/3/2015 6.0 12.5 $29.50 19000 2.88 $500 46% $500 30% 0 Dot 0% 14 11/13/2015 11.8 13.9 $34.00 27000 1.47 $1,100 62% $1,368 51% 0 Coat 0% 13 11/3/2015 11.8 13.9 $32.50 27000 1.48 $1,000 56% $1,206 44% 0 Aft 0% 6 4/10/2015 10.4 15.3 $34.00 26000 1.87 $600 40% $600 30% 0 Foam 0% 4 11/11/2015 11.8 14.2 $34.00 27000 1.47 $1,100 59% $1,235 44% 0 CAPSTONE® COURIER Page 7 Performance Segment Analysis C58538 Round: 2Dec. 31, 2015 Performance Statistics Total Industry Unit Demand 2,749 Actual Industry Unit Sales 2,749 Segment % of Total Industry 9.5% Next Year's Segment Growth Rate 19.8% Performance Customer Buying Criteria Expectations Importance 1. Reliability MTBF 22000-27000 43% 2. Ideal Position Pfmn 11.4 Size 14.6 29% 3. Price $24.00 - 34.00 19% 4. Age Ideal Age = 1.0 9%
  • 115. Top Products in Performance Segment Name Market Share Units Sold to Seg Revision Date Stock Out Pfmn Coord Size Coord List Price MTBF Age Dec.31 Promo Budget Cust. Aware- ness
  • 116. Sales Budget Cust. Access- ibility Dec. Cust. Survey Dot 23% 634 11/13/2015 11.8 13.9 $34.00 27000 1.47 $1,100 62% $1,368 38% 35 Coat 23% 629 11/3/2015 11.8 13.9 $32.50 27000 1.48 $1,000 56% $1,206 33% 34 Foam 22% 618 11/11/2015 11.8 14.2 $34.00 27000 1.47 $1,100 59% $1,235 35% 35 Aft 14% 393 4/10/2015 10.4 15.3 $34.00 26000 1.87 $600 40% $600 23% 17 Bold 14% 390 9/15/2015 10.5 15.1 $31.50 24000 2.39 $800 44% $800 25% 14 Edge 3% 83 6/30/2011 YES 9.4 15.5 $34.00 25000 4.50 $300 25% $155 17% 7 Daze 0% 1 8/22/2015 6.8 13.3 $29.00 18100 1.84 $1,100 66% $1,440 38% 0 CAPSTONE® COURIER Page 8 Size Segment Analysis C58538 Round: 2Dec. 31, 2015 Size Statistics Total Industry Unit Demand 2,776 Actual Industry Unit Sales 2,776
  • 117. Segment % of Total Industry 9.6% Next Year's Segment Growth Rate 18.3% Size Customer Buying Criteria Expectations Importance 1. Ideal Position Pfmn 5.4 Size 8.6 43% 2. Age Ideal Age = 1.5 29% 3. Reliability MTBF 16000-21000 19% 4. Price $24.00 - 34.00 9% Top Products in Size Segment Name Market Share Units Sold to Seg Revision Date Stock Out Pfmn Coord Size Coord List Price MTBF
  • 118. Age Dec.31 Promo Budget Cust. Aware- ness Sales Budget Cust. Access- ibility Dec. Cust. Survey Fume 23% 647 11/9/2015 5.4 8.4 $34.00 19000 1.48 $1,100 59% $1,235 39% 39 Cure 23% 642 9/10/2015 5.4 8.6 $32.50 17000 1.56 $1,000 56% $1,206 37% 33 Dune 23% 628 11/13/2015 5.8 8.6 $34.00 19000 1.50 $1,100 62% $1,368 42% 39 Agape 16% 432 1/29/2015 5.0 9.5 $34.00 19000 2.76 $600 38% $600 26% 12 Buddy 9% 258 5/9/2015 YES 4.7 10.8 $31.00 19000 1.93 $800 44% $800 28% 12 Able 3% 74 5/3/2015 6.0 12.5 $29.50 19000 2.88 $500 46% $500 26% 4 Egg 2% 67 12/24/2015 6.9 13.4 $34.00 19000 2.30 $1,050
  • 119. 56% $775 29% 0 Echo 1% 14 7/20/2015 6.4 13.6 $27.00 16000 1.40 $1,050 57% $775 29% 0 Baker 0% 5 3/9/2015 YES 5.6 14.2 $24.00 17500 2.12 $1,000 61% $1,000 28% 0 Daze 0% 3 8/22/2015 6.8 13.3 $29.00 18100 1.84 $1,100 66% $1,440 42% 0 Bid 0% 3 6/9/2016 8.0 11.5 $34.50 23000 2.72 $1,000 53% $700 28% 0 Cake 0% 1 8/26/2015 6.4 13.6 $26.50 14000 1.87 $1,100 66% $1,270 37% 0 CAPSTONE® COURIER Page 9 Market Share C58538 Round: 2Dec. 31, 2015 Actual Market Share in Units Potential Market Share in Units Trad Low High Pfmn Size Total Trad Low High Pfmn Size Total Industry Unit Sales 8,809 11,180 3,448 2,749 2,776 28,961 Units Demanded 8,809 11,180 3,448 2,749 2,776 28,961 % of Market 30.4% 38.6% 11.9% 9.5% 9.6% 100.0% % of Market 30.4% 38.6% 11.9% 9.5% 9.6% 100.0% Able 6.1% 0.5% 2.7% 2.2% Able 5.8% 0.6% 2.6% 2.1% Acre 2.2% 5.6% 2.8% Acre 2.1% 2.6% 1.6% Adam 13.4% 1.6% Adam 13.3% 1.6% Aft 0.2% 14.3% 1.4% Aft 0.2% 14.4% 1.4% Agape 15.6% 1.5% Agape 15.3% 1.5% Total 8.3% 5.6% 14.1% 14.3% 18.2% 9.5% Total 7.9% 2.6% 14.1% 14.4% 18.0% 8.2% Baker 16.0% 0.5% 0.2% 5.1% Baker 20.1% 0.6% 0.2% 6.4%