Download as PDF, PPTX
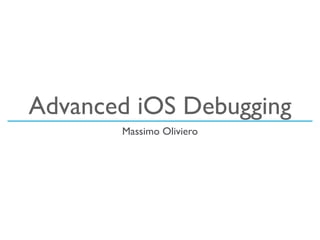
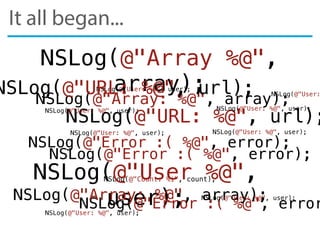
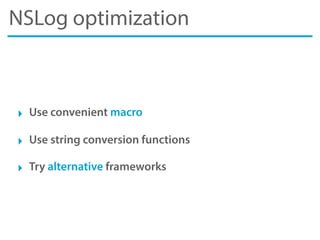
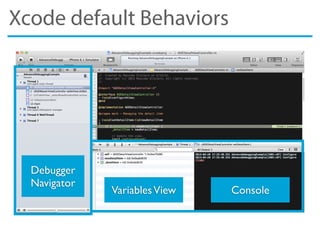
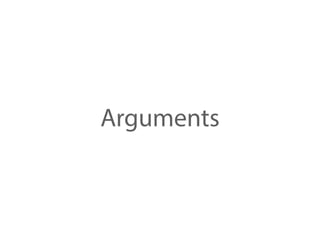
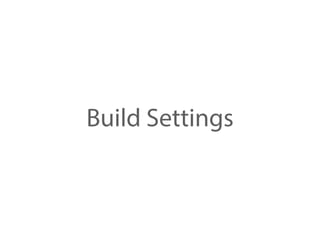
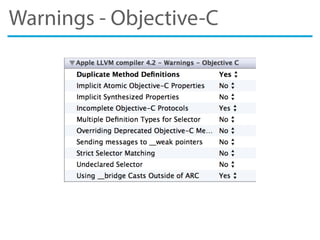
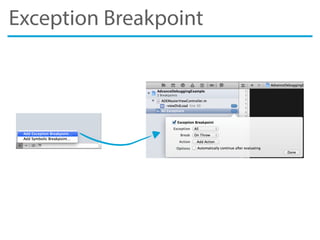
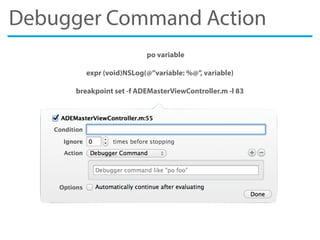
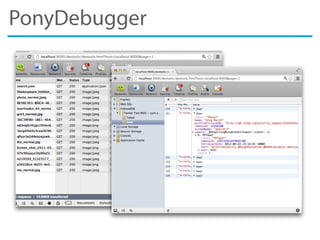
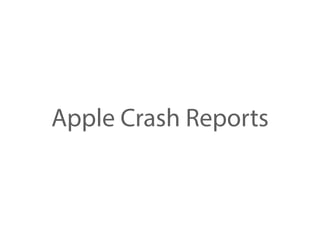
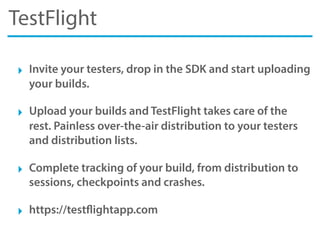
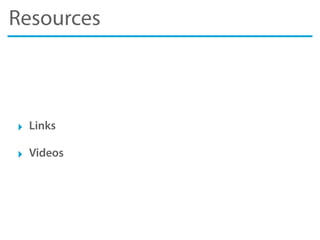
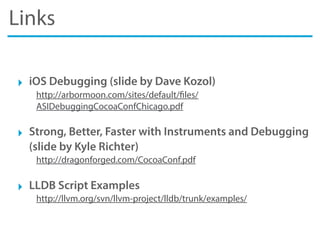
![#if defined DEBUG
#define MYNSLog(s, ...) NSLog((@"%s [Line %d] " s), __PRETTY_FUNCTION__,
__LINE__, ##__VA_ARGS__)
#else
#define MYNSLog(s, ...)
#endif
-[TestViewController viewDidLoad] [Line 33] message
- (void)viewDidLoad
{
[super viewDidLoad];
MYNSLog(@"message");
}
MyGreatApp-prefix.pch
TestViewController.m
Console
NSLog macro](https://image.slidesharecdn.com/advancediosdebbuging-reloaded-130603042654-phpapp02/85/Advanced-iOS-Debbuging-Reloaded-9-320.jpg)
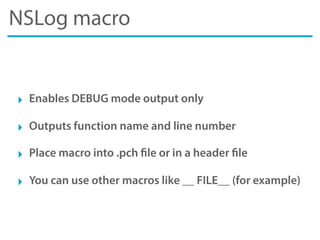
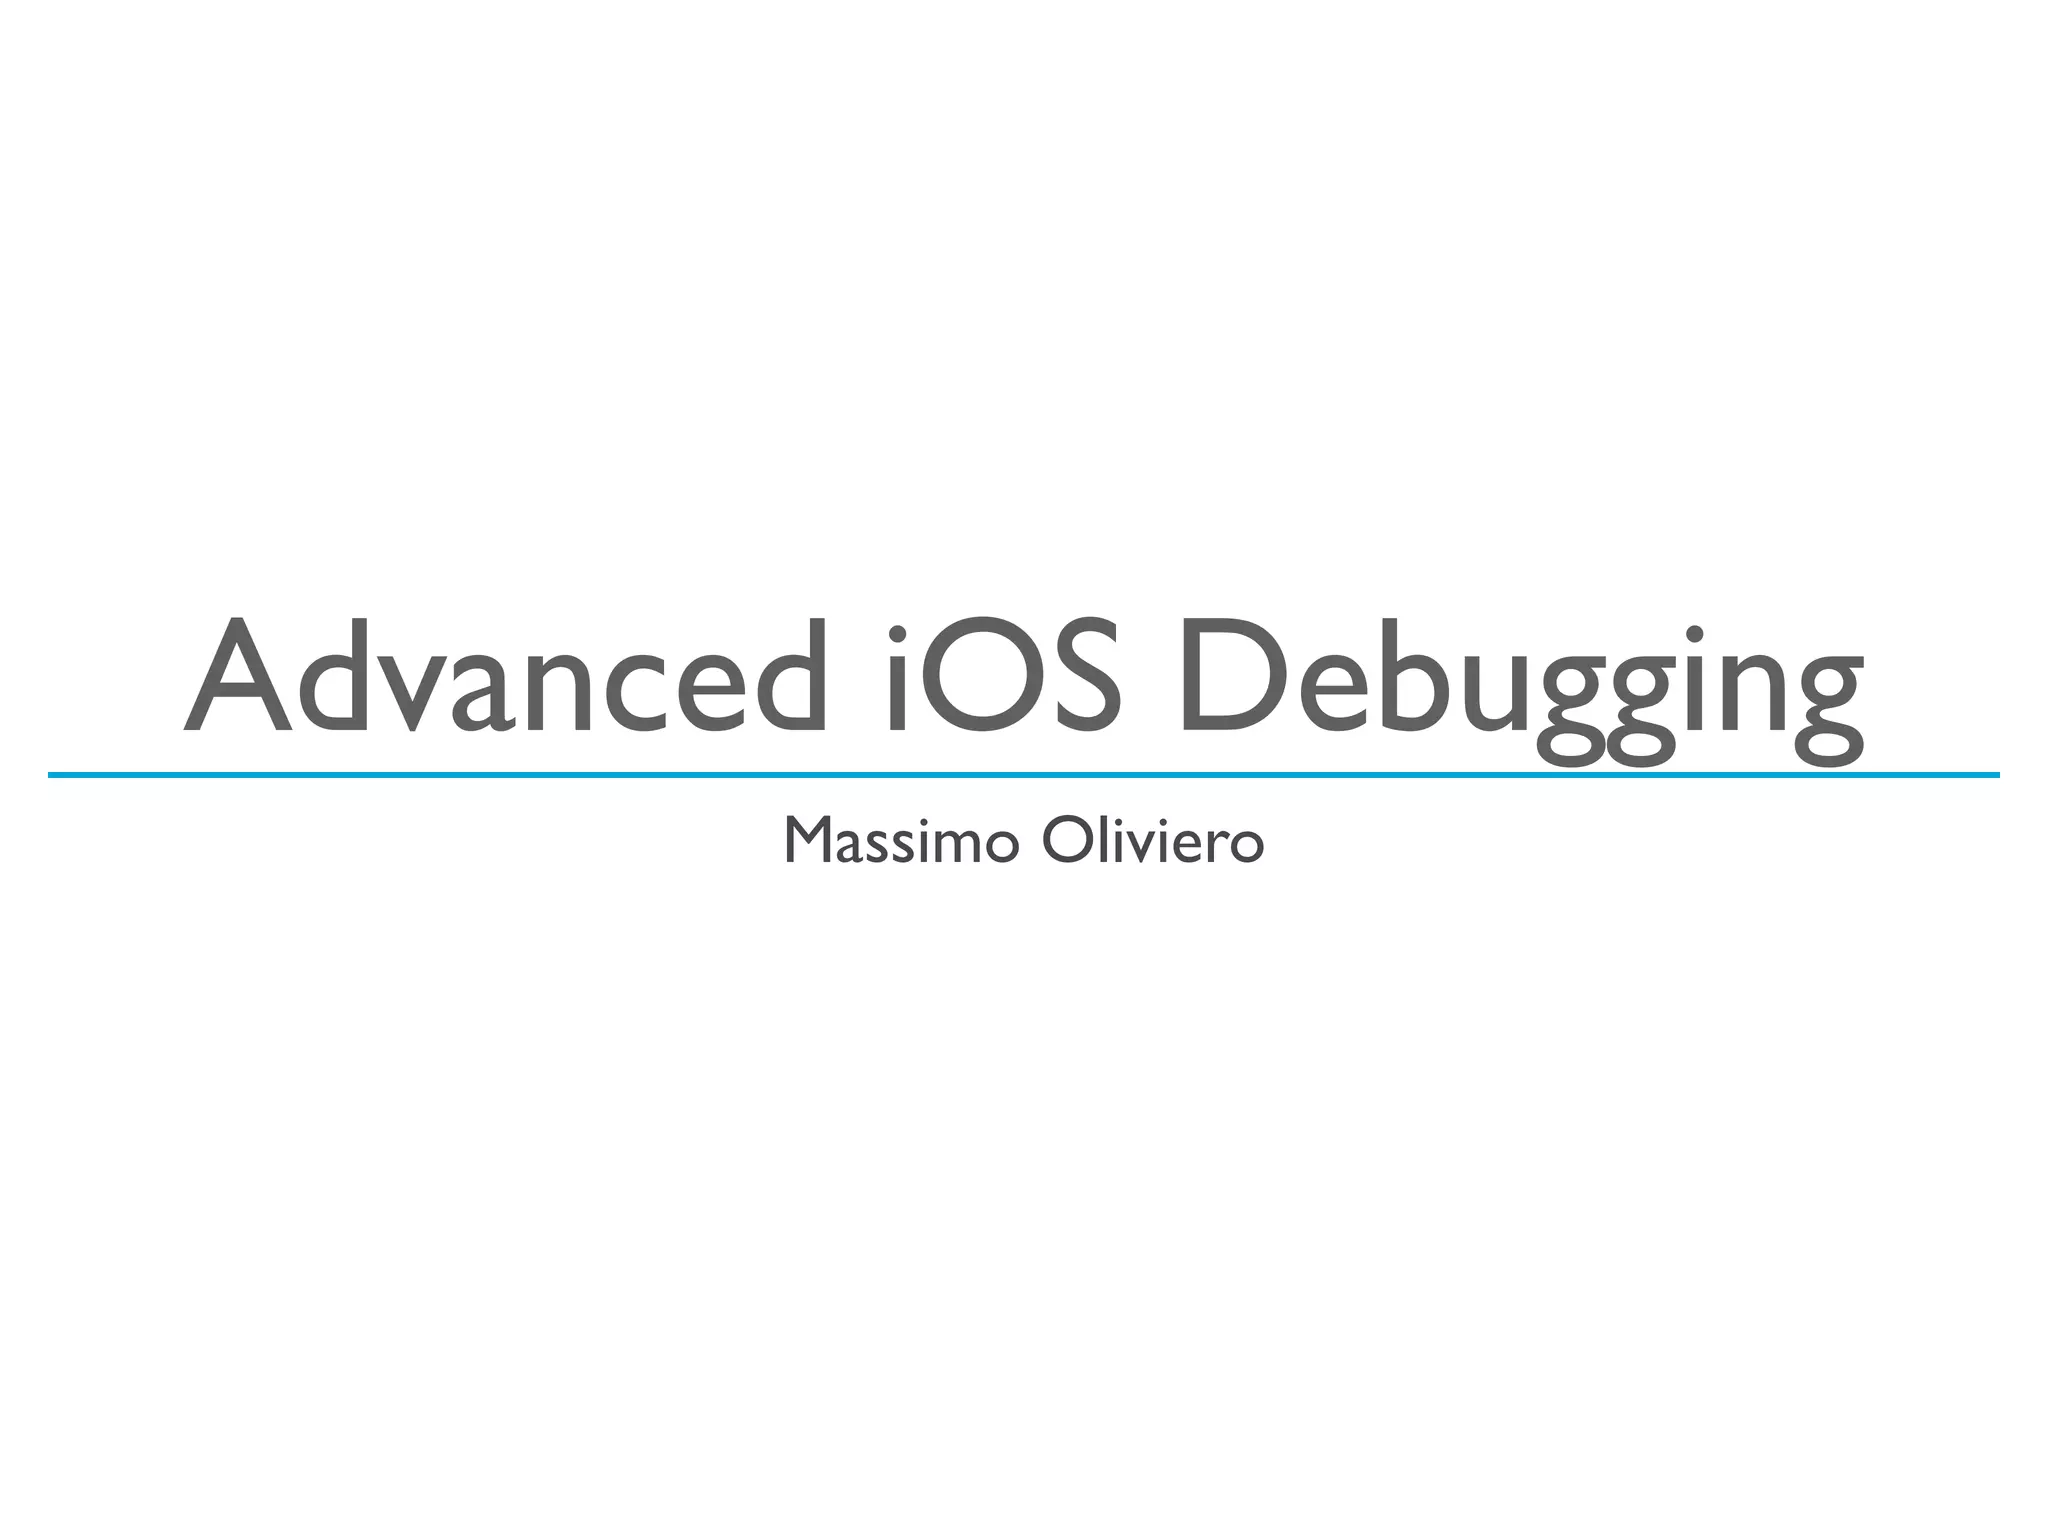
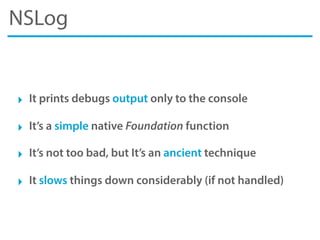
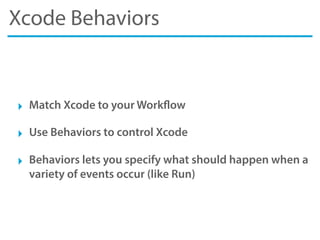
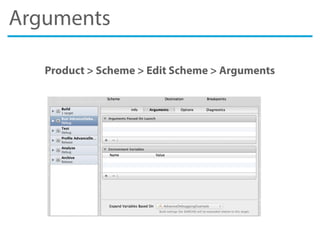
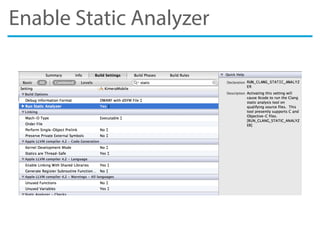
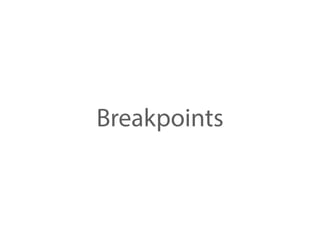
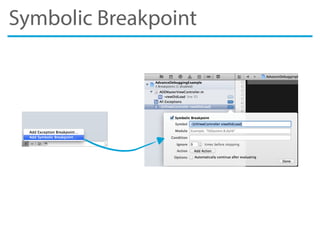
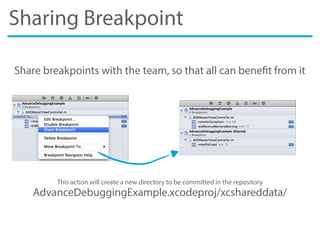
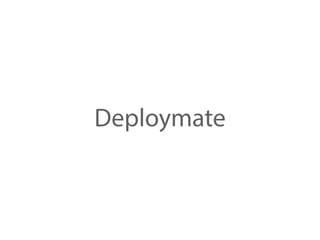
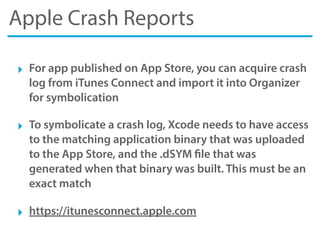
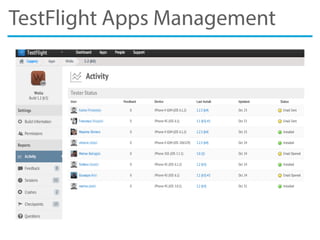
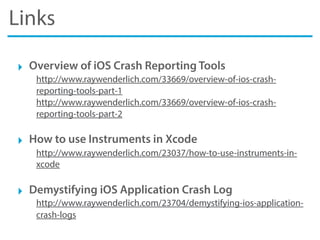
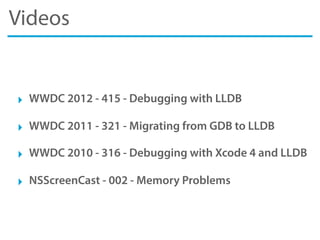
![CGPoint point = CGPointMake(10.5f, 12.3f);
NSLog(@"point: %@", NSStringFromCGPoint(point));
AdvanceDebuggingExample[3050:c07] point: {10.5, 12.3}
AdvanceDebuggingExample.m
Console
String conversion functions](https://image.slidesharecdn.com/advancediosdebbuging-reloaded-130603042654-phpapp02/85/Advanced-iOS-Debbuging-Reloaded-11-320.jpg)
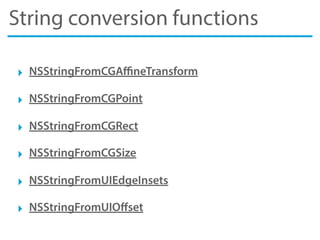

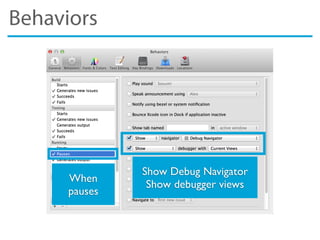

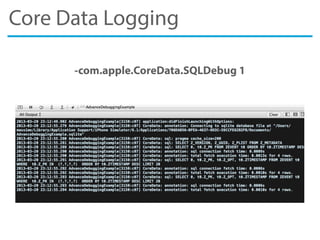
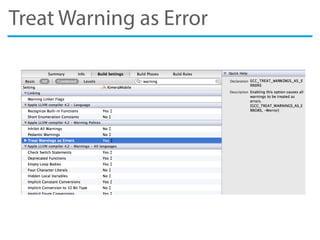
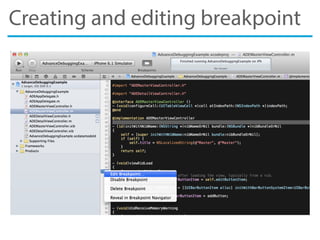
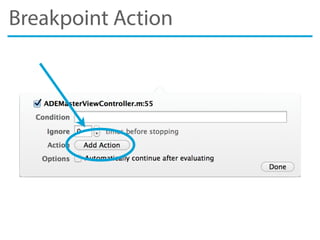

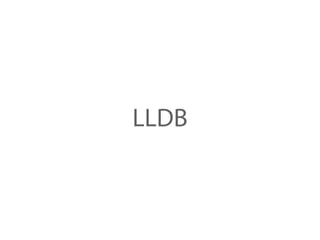
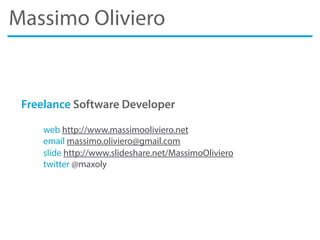
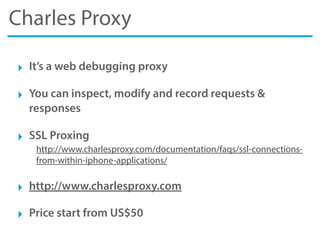
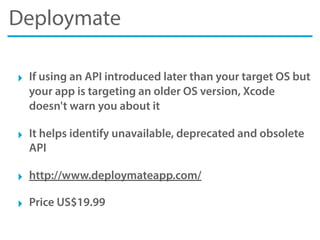
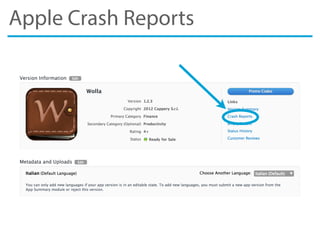
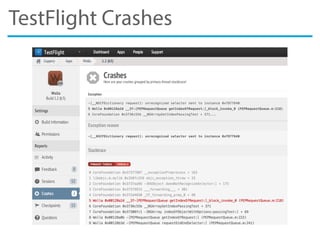
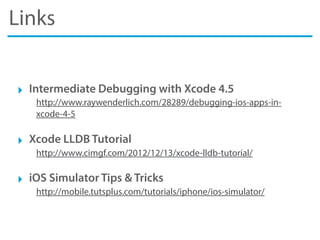
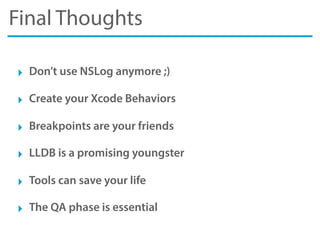
![LLDB Commands
print object po [object]
print variable print [variable]
assign value expr [variable] = [value]
(lldb) <command>](https://image.slidesharecdn.com/advancediosdebbuging-reloaded-130603042654-phpapp02/85/Advanced-iOS-Debbuging-Reloaded-45-320.jpg)
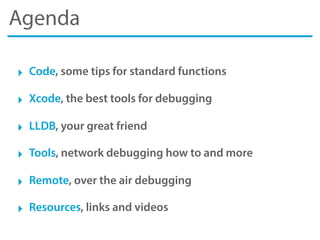
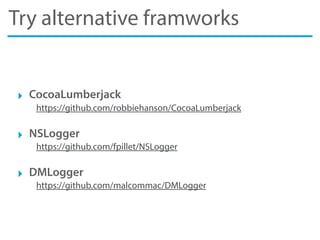
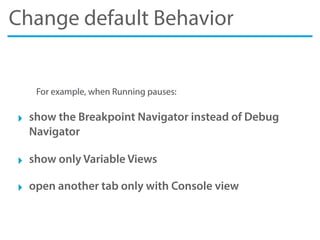
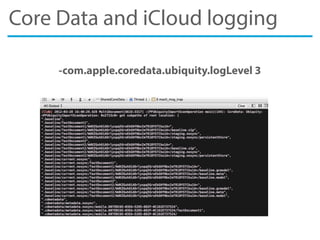
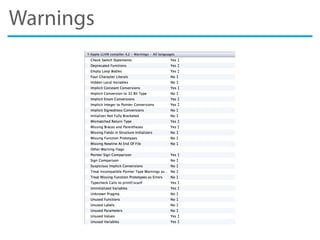
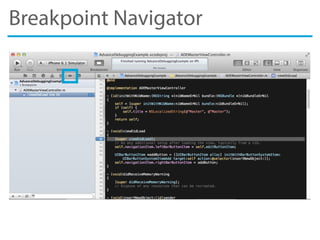
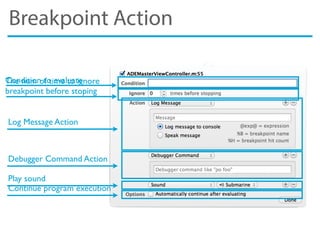
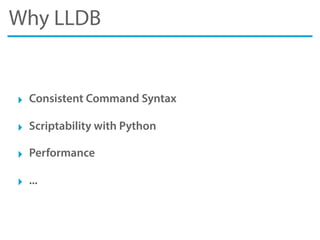
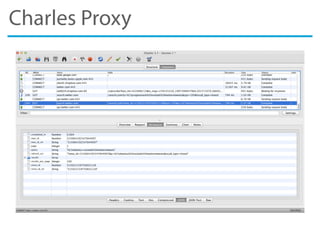
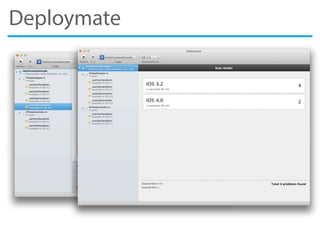
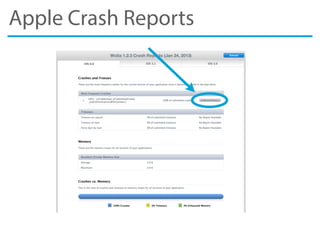
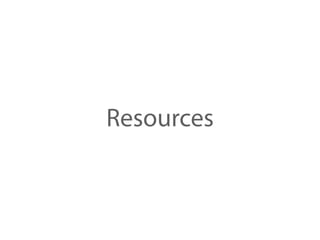
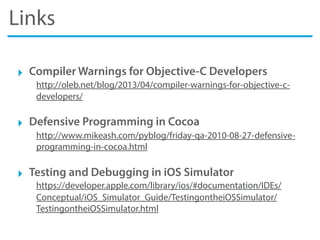
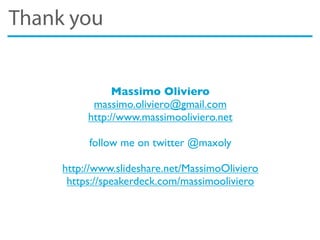
![LLDB Commands
set breakpoint breakpoint set -f [file] -l [line]
load script command script import ~/test.py
evaluate expression expr <expression>
<noun> <verb> [-options [option-value]] [argument [argument...]]](https://image.slidesharecdn.com/advancediosdebbuging-reloaded-130603042654-phpapp02/85/Advanced-iOS-Debbuging-Reloaded-46-320.jpg)
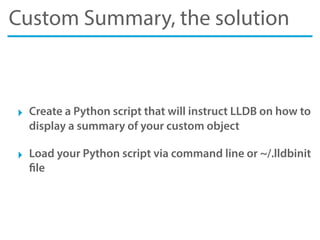
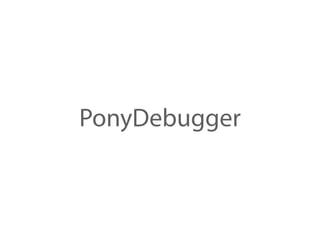
![Custom Object, the problem
No summary for custom object
@interface KMRMArgument : NSObject
@property (nonatomic, strong) NSString *name;
@property (nonatomic, strong) NSDate *detail;
@end
KMRMArgument *argument = [[KMRMArgument alloc] init];
argument.title = @"Debugging";
argument.when = @"Some advance techniques";
Init object
Custom object](https://image.slidesharecdn.com/advancediosdebbuging-reloaded-130603042654-phpapp02/85/Advanced-iOS-Debbuging-Reloaded-47-320.jpg)
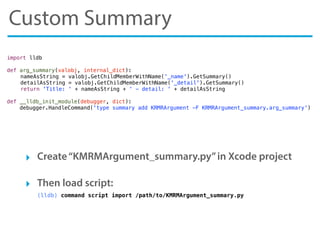
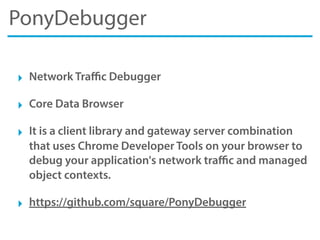
![Console tips
(lldb) po [self.view recursiveDescription]
$7 = 0x082a2c60 <UITableView: 0x8971000; frame = (0 0; 320 504); clipsToBounds = YES; autoresize = W+H;
gestureRecognizers = <NSArray: 0x8184be0>; layer = <CALayer: 0x8184570>; contentOffset: {0, 0}>
| <UITableViewCell: 0x8282900; frame = (0 176; 320 44); text = '2013-03-12 21:22:34 +0000'; autoresize = W;
layer = <CALayer: 0x8282a30>>
| | <UITableViewCellContentView: 0x8282a60; frame = (0 0; 300 43); gestureRecognizers = <NSArray:
0x8282c30>; layer = <CALayer: 0x8282ac0>>
| | | <UILabel: 0x8282e50; frame = (10 0; 280 43); text = '2013-03-12 21:22:34 +0000'; clipsToBounds
= YES; userInteractionEnabled = NO; layer = <CALayer: 0x8282ee0>>
| | <UIButton: 0x8282c80; frame = (290 0; 30 43); opaque = NO; userInteractionEnabled = NO; layer = ...
(lldb) po [[UIWindow keyWindow] recursiveDescription]
$5 = 0x08273bc0 <UIWindow: 0x8181010; frame = (0 0; 320 568); layer = <UIWindowLayer: 0x81810e0>>
| <UILayoutContainerView: 0xd06eed0; frame = (0 0; 320 568); autoresize = W+H; layer = <CALayer:
0xd071460>>
| | <UINavigationTransitionView: 0xd09e850; frame = (0 0; 320 568); clipsToBounds = YES; autoresize = W
+H; layer = <CALayer: 0xd09e920>>
| | | <UIViewControllerWrapperView: 0x846e160; frame = (0 64; 320 504); autoresize = W+H; layer =
<CALayer: 0x846e210>>
...](https://image.slidesharecdn.com/advancediosdebbuging-reloaded-130603042654-phpapp02/85/Advanced-iOS-Debbuging-Reloaded-50-320.jpg)
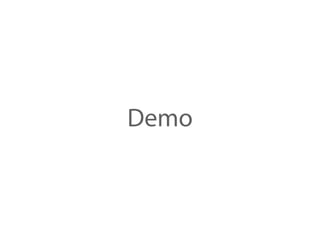


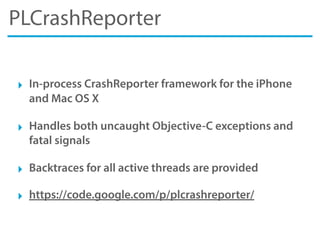
![PLCrashReporter
- (void) handleCrashReport {
PLCrashReporter *crashReporter = [PLCrashReporter sharedReporter];
NSData *crashData;
NSError *error;
// Try loading the crash report
crashData = [crashReporter loadPendingCrashReportDataAndReturnError: &error];
if (crashData == nil) {
NSLog(@"Could not load crash report: %@", error);
goto finish;
}
PLCrashReport *report = [[[PLCrashReport alloc] initWithData: crashData error: &error] autorelease];
if (report == nil) {
NSLog(@"Could not parse crash report");
goto finish;
}
....
return;
}
// from UIApplicationDelegate protocol
- (void) applicationDidFinishLaunching: (UIApplication *) application {
PLCrashReporter *crashReporter = [PLCrashReporter sharedReporter];
NSError *error;
// Check if we previously crashed
if ([crashReporter hasPendingCrashReport])
[self handleCrashReport];
// Enable the Crash Reporter
if (![crashReporter enableCrashReporterAndReturnError: &error])
NSLog(@"Warning: Could not enable crash reporter: %@", error);
}](https://image.slidesharecdn.com/advancediosdebbuging-reloaded-130603042654-phpapp02/85/Advanced-iOS-Debbuging-Reloaded-79-320.jpg)


The document is a comprehensive guide on advanced iOS debugging techniques, discussing various tools and methodologies including Xcode, lldb, and diagnostics for network and crash reporting. It covers practical tips for optimizing logging with nslog, utilizing third-party libraries, and implementing custom summaries for objects within the debugging environment. Additionally, it provides valuable resources and links for further learning about debugging strategies in iOS development.


![[JMaghreb 2014] Developing JavaScript Mobile Apps Using Apache Cordova](https://cdn.slidesharecdn.com/ss_thumbnails/javascriptmoibleappsdevelopment-141106091920-conversion-gate02-thumbnail.jpg?width=640&height=640&fit=bounds)


![Getting Started with Apache Spark: Big Data Made Simple [Free Meetup]](https://cdn.slidesharecdn.com/ss_thumbnails/apachesparkgettingstarted-260203175547-8361bcc3-thumbnail.jpg?width=640&height=640&fit=bounds)


