This document provides a playbook to help organizations get operationally ready for implementing Adobe Analytics. It covers key areas of leadership, strategy, people, process, and product to ensure success. The playbook is intended for roles such as CMOs, heads of digital and analytics, analysts, and project managers. It provides best practices around sponsorship, communication, digital strategy, organizational structure, deployment, reporting, and using the solution architecture. The objective is for organizations to drive maximum value from their investment in Adobe technology.
Playbook Objective
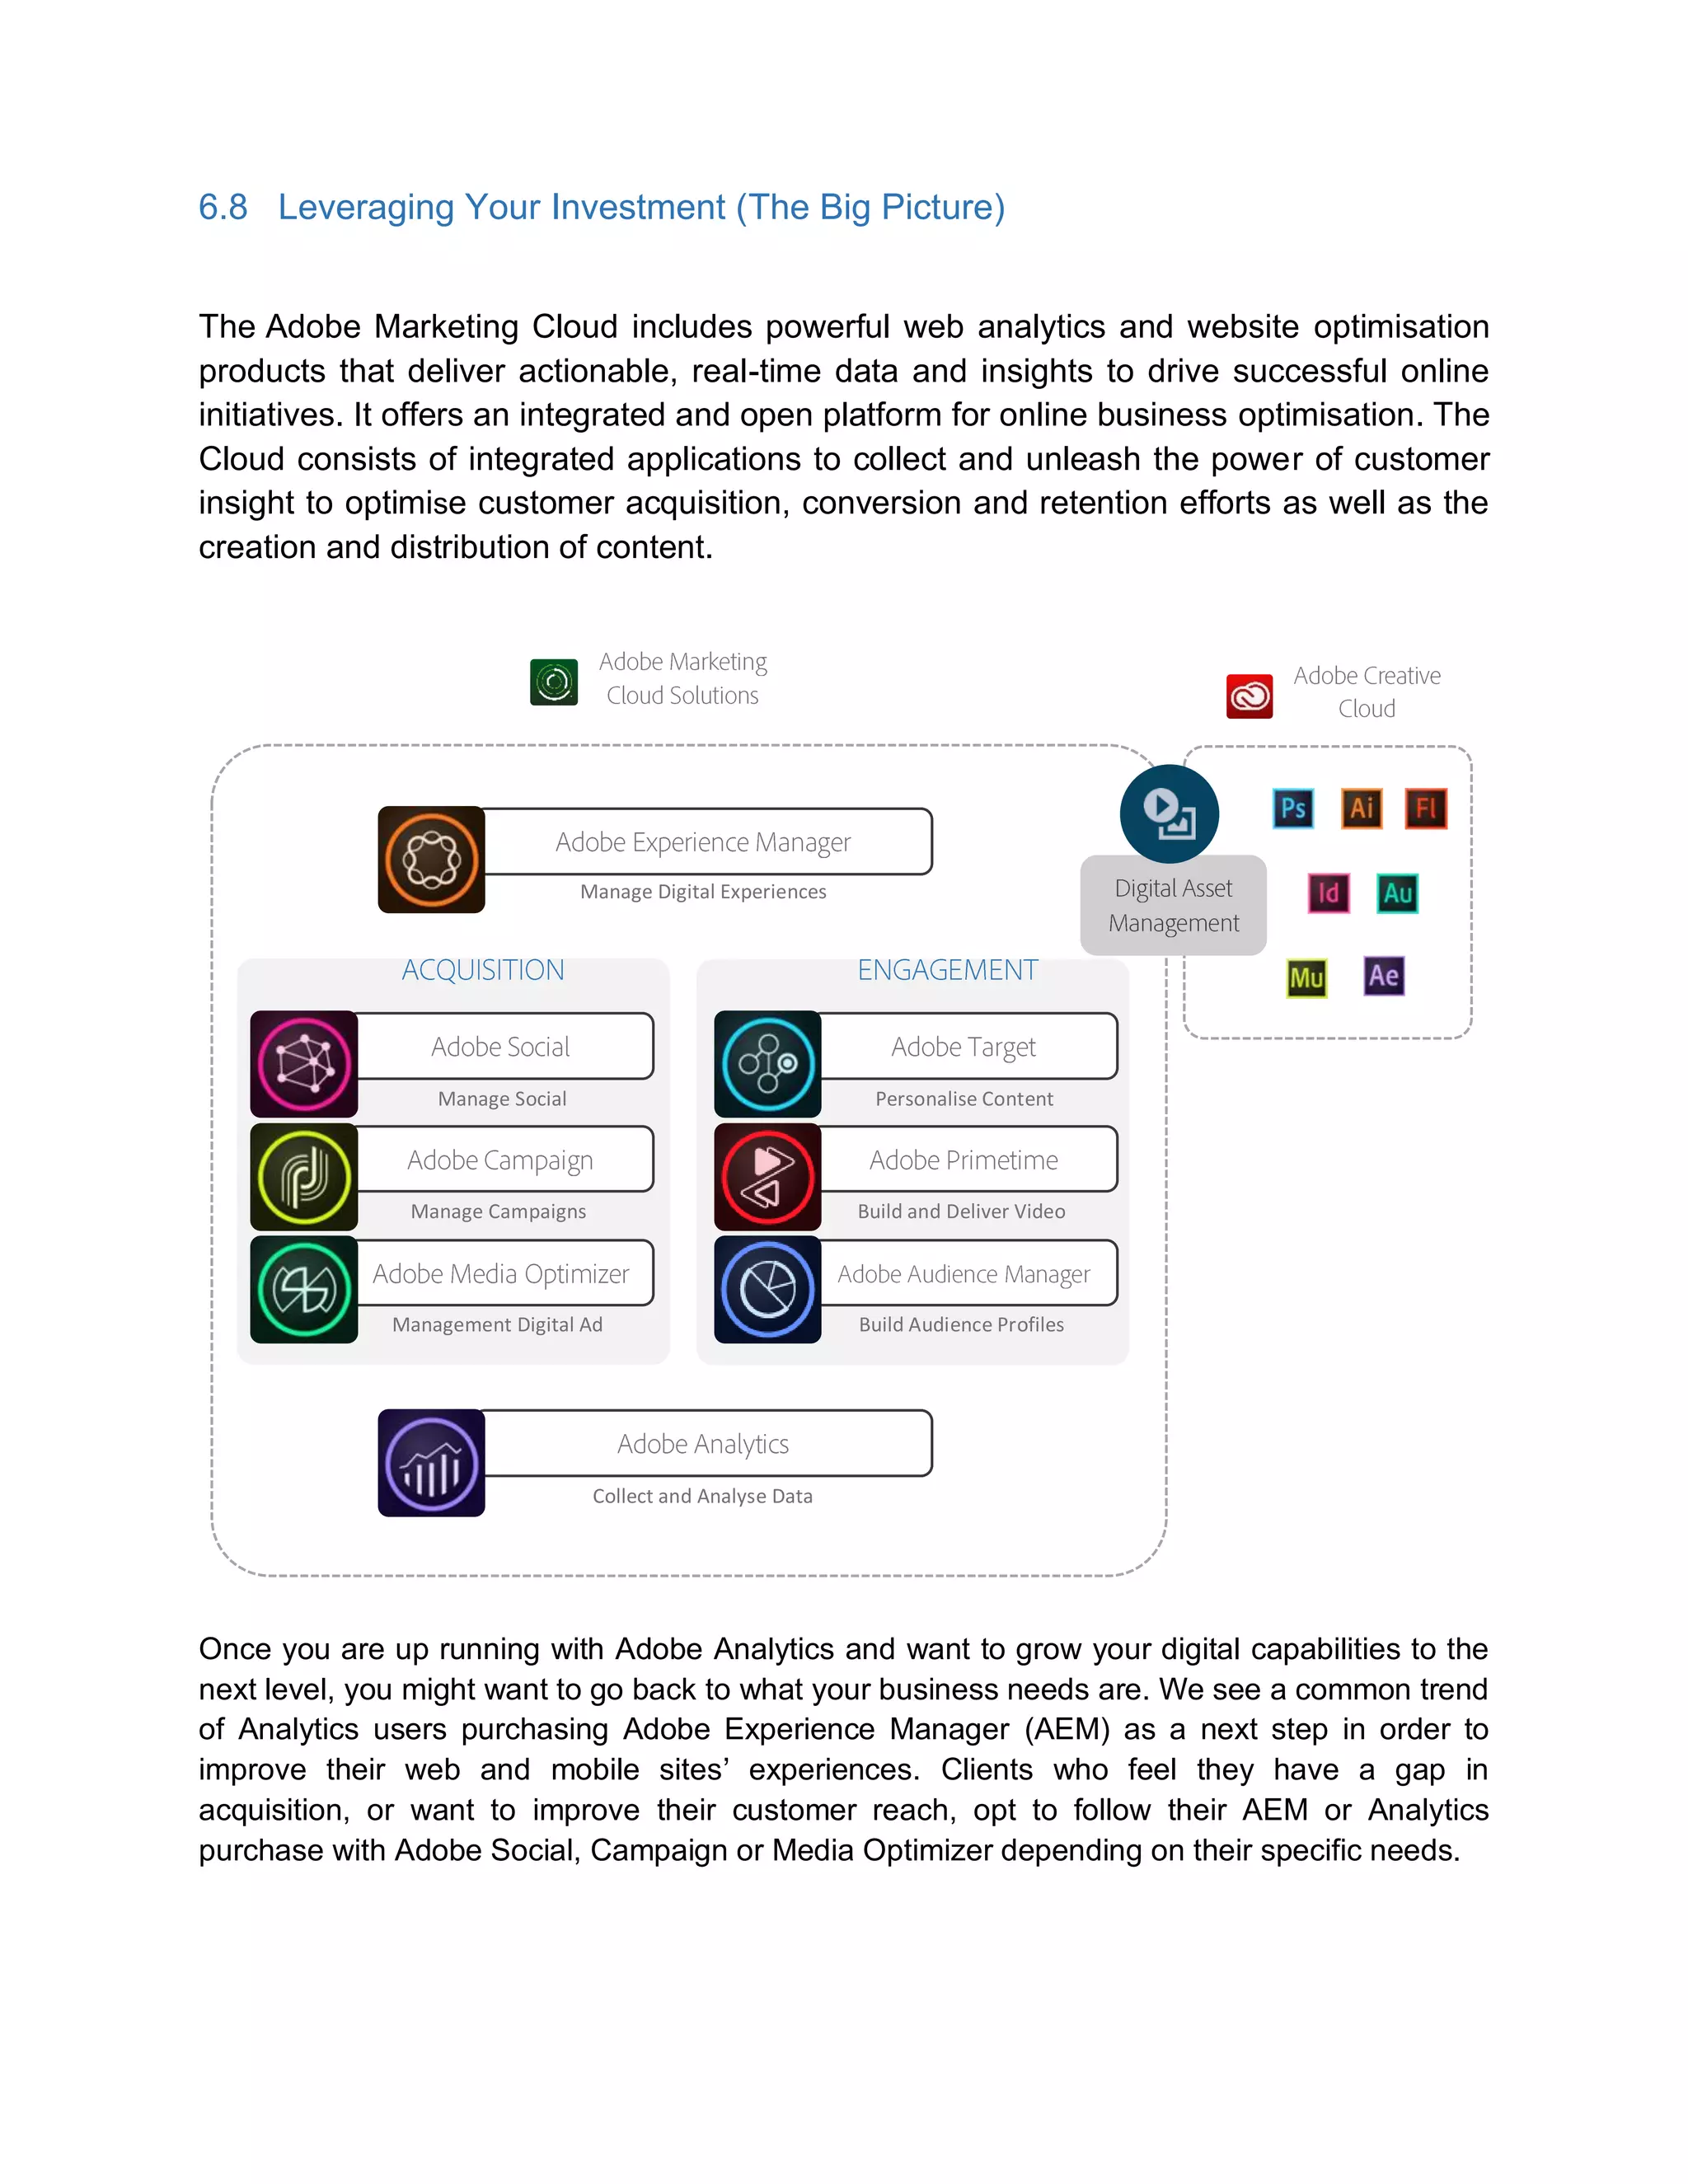
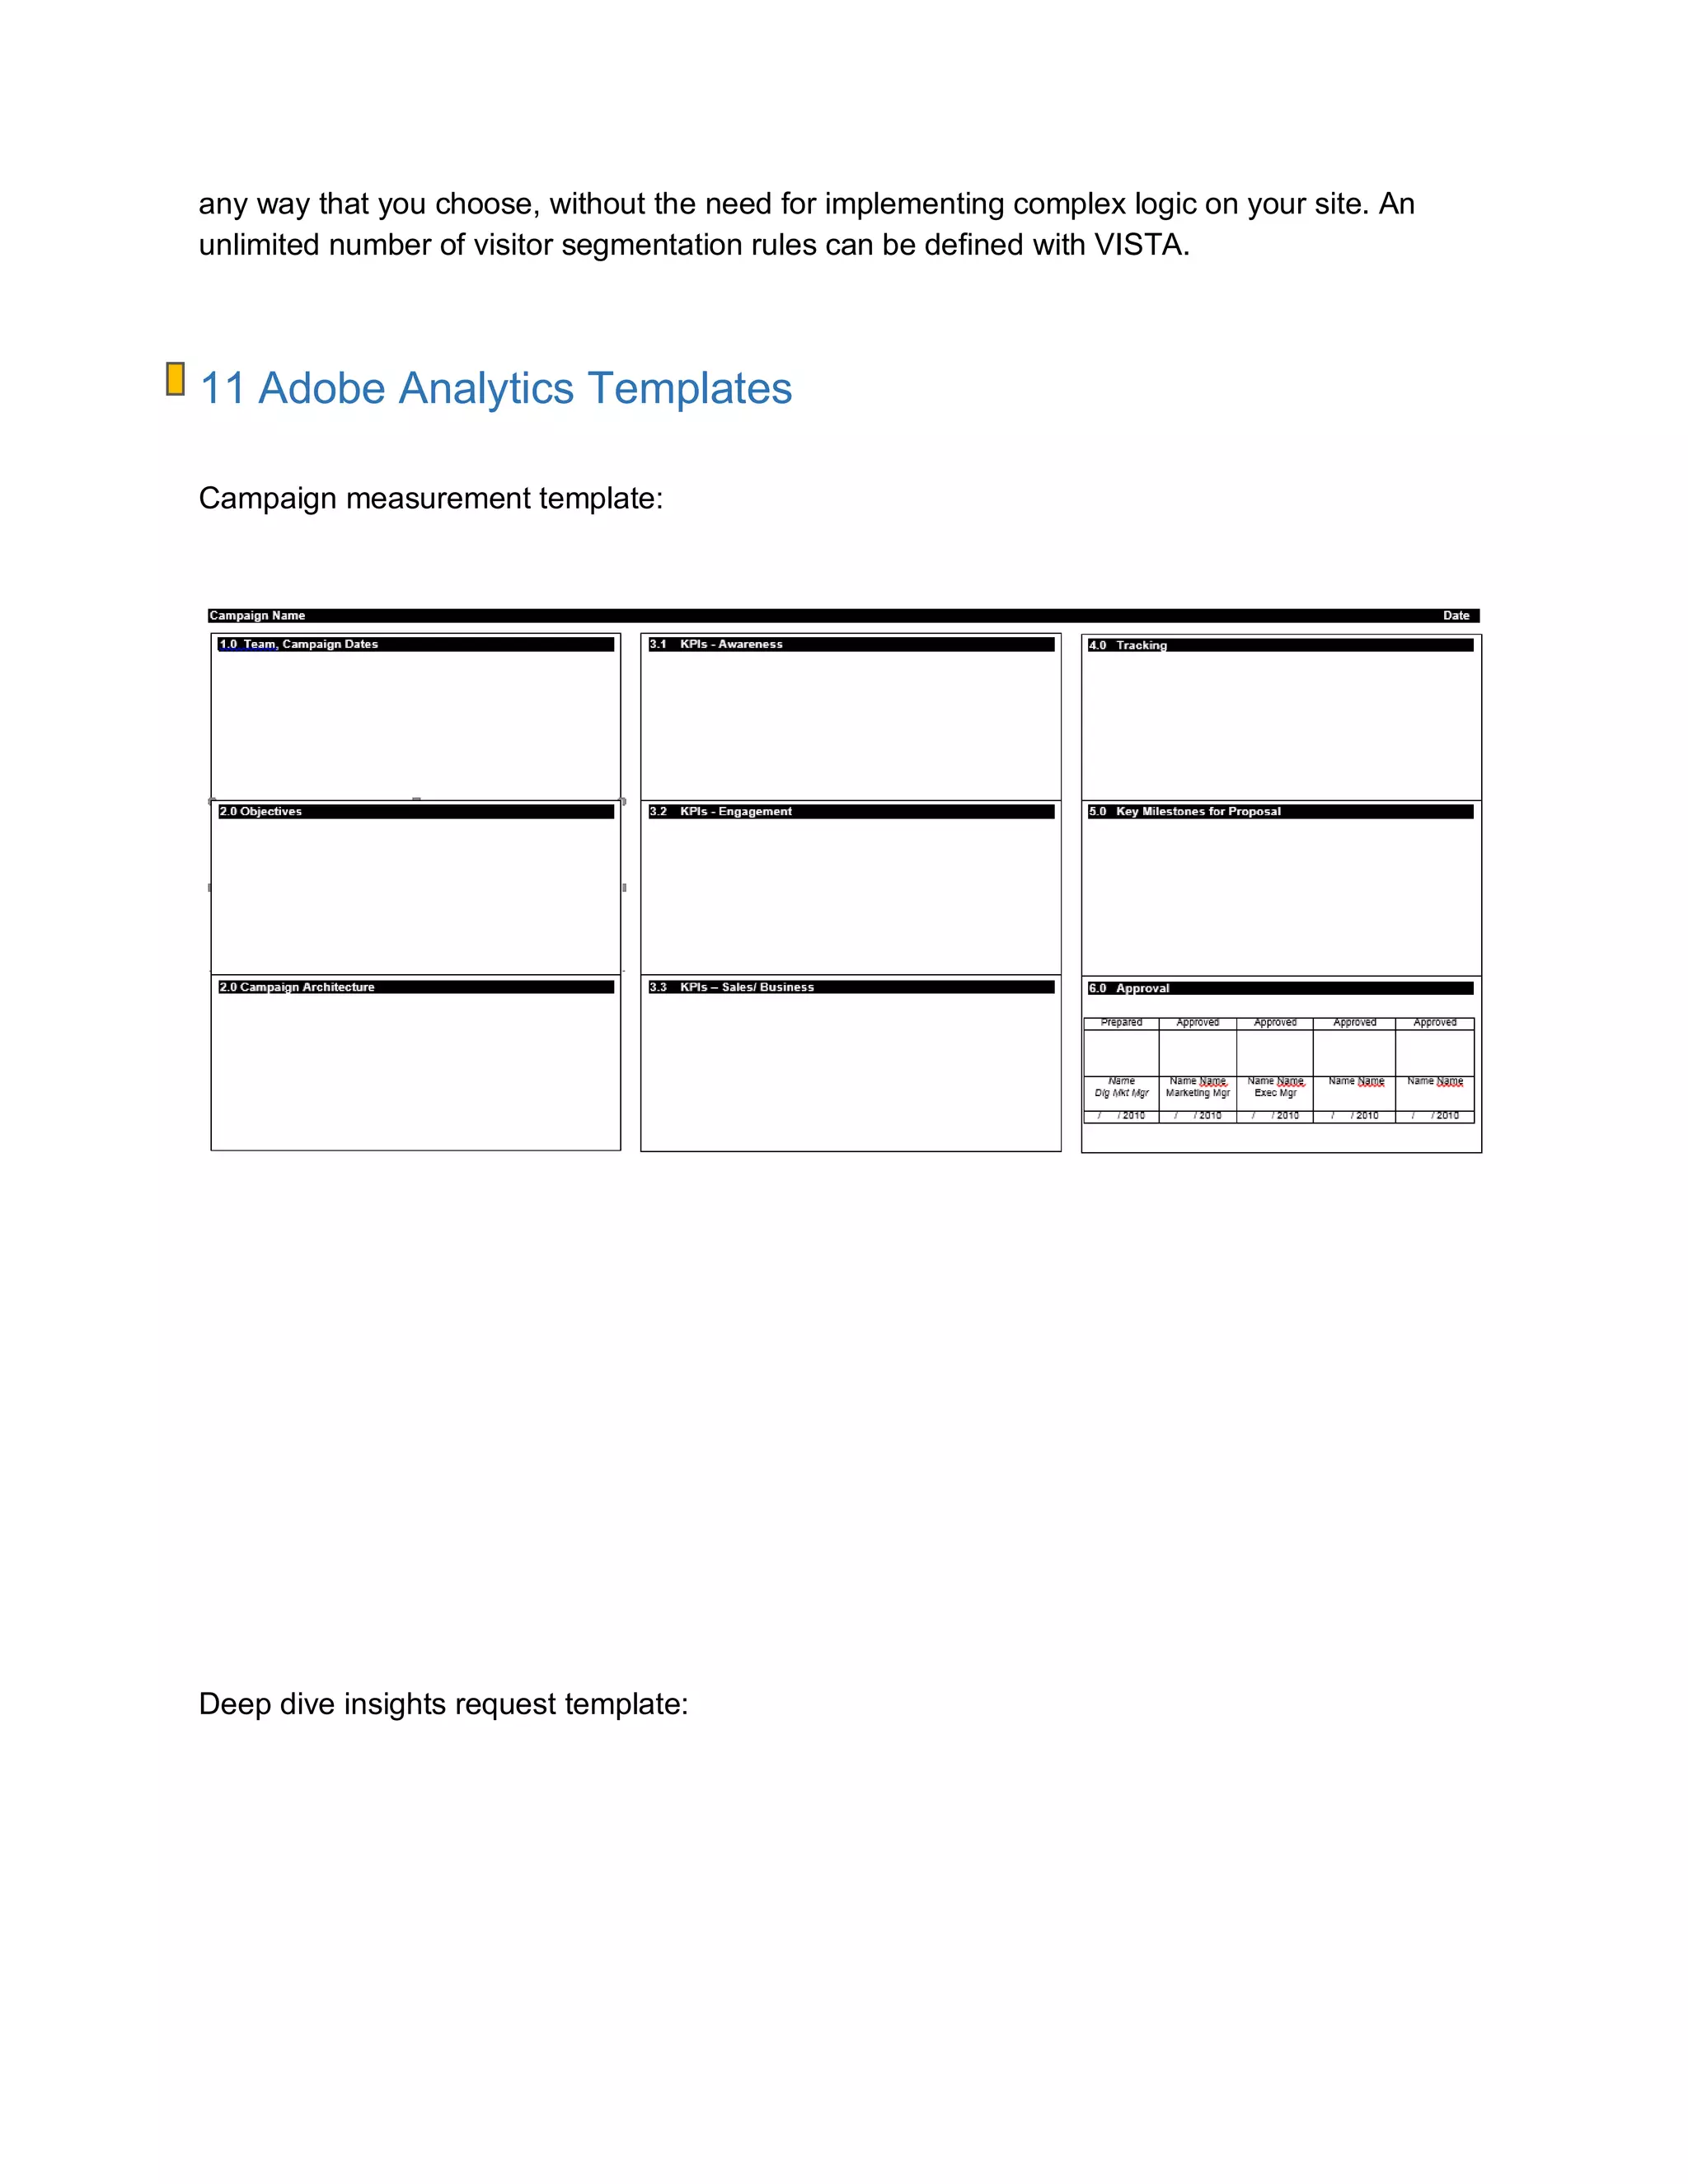
The objectiveof this document is to get your business operationally ready for the
implementation and deployment of Adobe Analytics. This will help you and your organisation –
as new Adobe Analytics users — to drive maximum value from your investment in Adobe
technology.
Although we have seen many projects succeed, others have faltered due to a lack of internal
investment in the business to ensure they are operationally ready to adopt this new technology.
This playbook will help you to avoid some of the common areas we have identified as missing in
less successful deliveries.
The recommendations and best practices in these playbooks are ideally intended to be applied
to your business in parallel with your technology solution deployment, to ensure that by the
time you go live with your solution your business is positioned to drive value realisation from
your investment.
The playbooks use a common digital governance structure focusing on the key areas of
leadership, strategy, people, product and process, to deliver a robust approach to readying your
business whether you are deploying one Adobe solution or several.
This playbook should be read by:
Chief Marketing Officer
Head of Digital, Head of Strategy, Head of Marketing, Head of Customer Insights
Head of Analytics, Digital Analyst Leads, Digital Channel Analysts, Digital Channel Managers
Solution Architect, Head of Implementation, Digital Implementation Leads
Program Manager, Project Manager, Business Analyst
3.
Table of Contents
1INTRODUCTION...............................................................................................................6
1.1 About Adobe Analytics........................................................................................................................6
1.2 About this Playbook.............................................................................................................................8
2 LEADERSHIP....................................................................................................................9
2.1 Sponsorship.........................................................................................................................................10
2.2 Buy-In....................................................................................................................................................10
2.3 Communication...................................................................................................................................11
2.3.1 Communication Management...................................................................................................... 11
2.3.2 Recommended Communication Process and Principles........................................................... 12
2.3.3 Setting Communication Goals ..................................................................................................... 12
2.3.4 Recommendations on a Communication Approach................................................................... 13
Accountability..................................................................................................................................................14
2.3.5 Steering Committee...................................................................................................................... 14
2.3.6 Common Roles and Responsibilities within a Steering Committee .......................................... 15
2.3.7 Setting up a Working Group......................................................................................................... 19
3 STRATEGY .....................................................................................................................19
3.1 Moving from Web Analytics to Marketing Analytics.....................................................................19
3.1.1 Adobe Analytics Maturity Model .................................................................................................. 21
3.2 Digital Strategy....................................................................................................................................24
3.3 Focus.....................................................................................................................................................28
3.3.1 KPI Strategy.................................................................................................................................. 28
3.4 Alignment.............................................................................................................................................29
3.4.1 Measurement Strategy................................................................................................................. 30
3.5 Innovation.............................................................................................................................................31
4 PEOPLE...........................................................................................................................31
4.1 Expertise...............................................................................................................................................31
4.2 Structure...............................................................................................................................................31
4.
4.2.1 Structure Types.............................................................................................................................32
4.2.2 Project-Based Recommended Organisational Structure........................................................... 33
4.2.3 Business Recommended Organisational Structure ................................................................... 33
4.2.4 Roles and Responsibilities........................................................................................................... 34
4.3 Resources ............................................................................................................................................40
4.3.1 Resource Model............................................................................................................................ 40
4.4 Community...........................................................................................................................................41
4.5 Culture ..................................................................................................................................................42
4.5.1 Developing a Culture of Analytics and Testing........................................................................... 42
5 PROCESS........................................................................................................................43
5.1 Deployment and Implementation .....................................................................................................43
5.1.1 Deployment process steps........................................................................................................... 43
5.1.2 Typical Deployment Scenarios for Adobe Analytics................................................................... 44
5.1.3 Implementation Acceptance......................................................................................................... 47
5.1.4 Project Management..................................................................................................................... 47
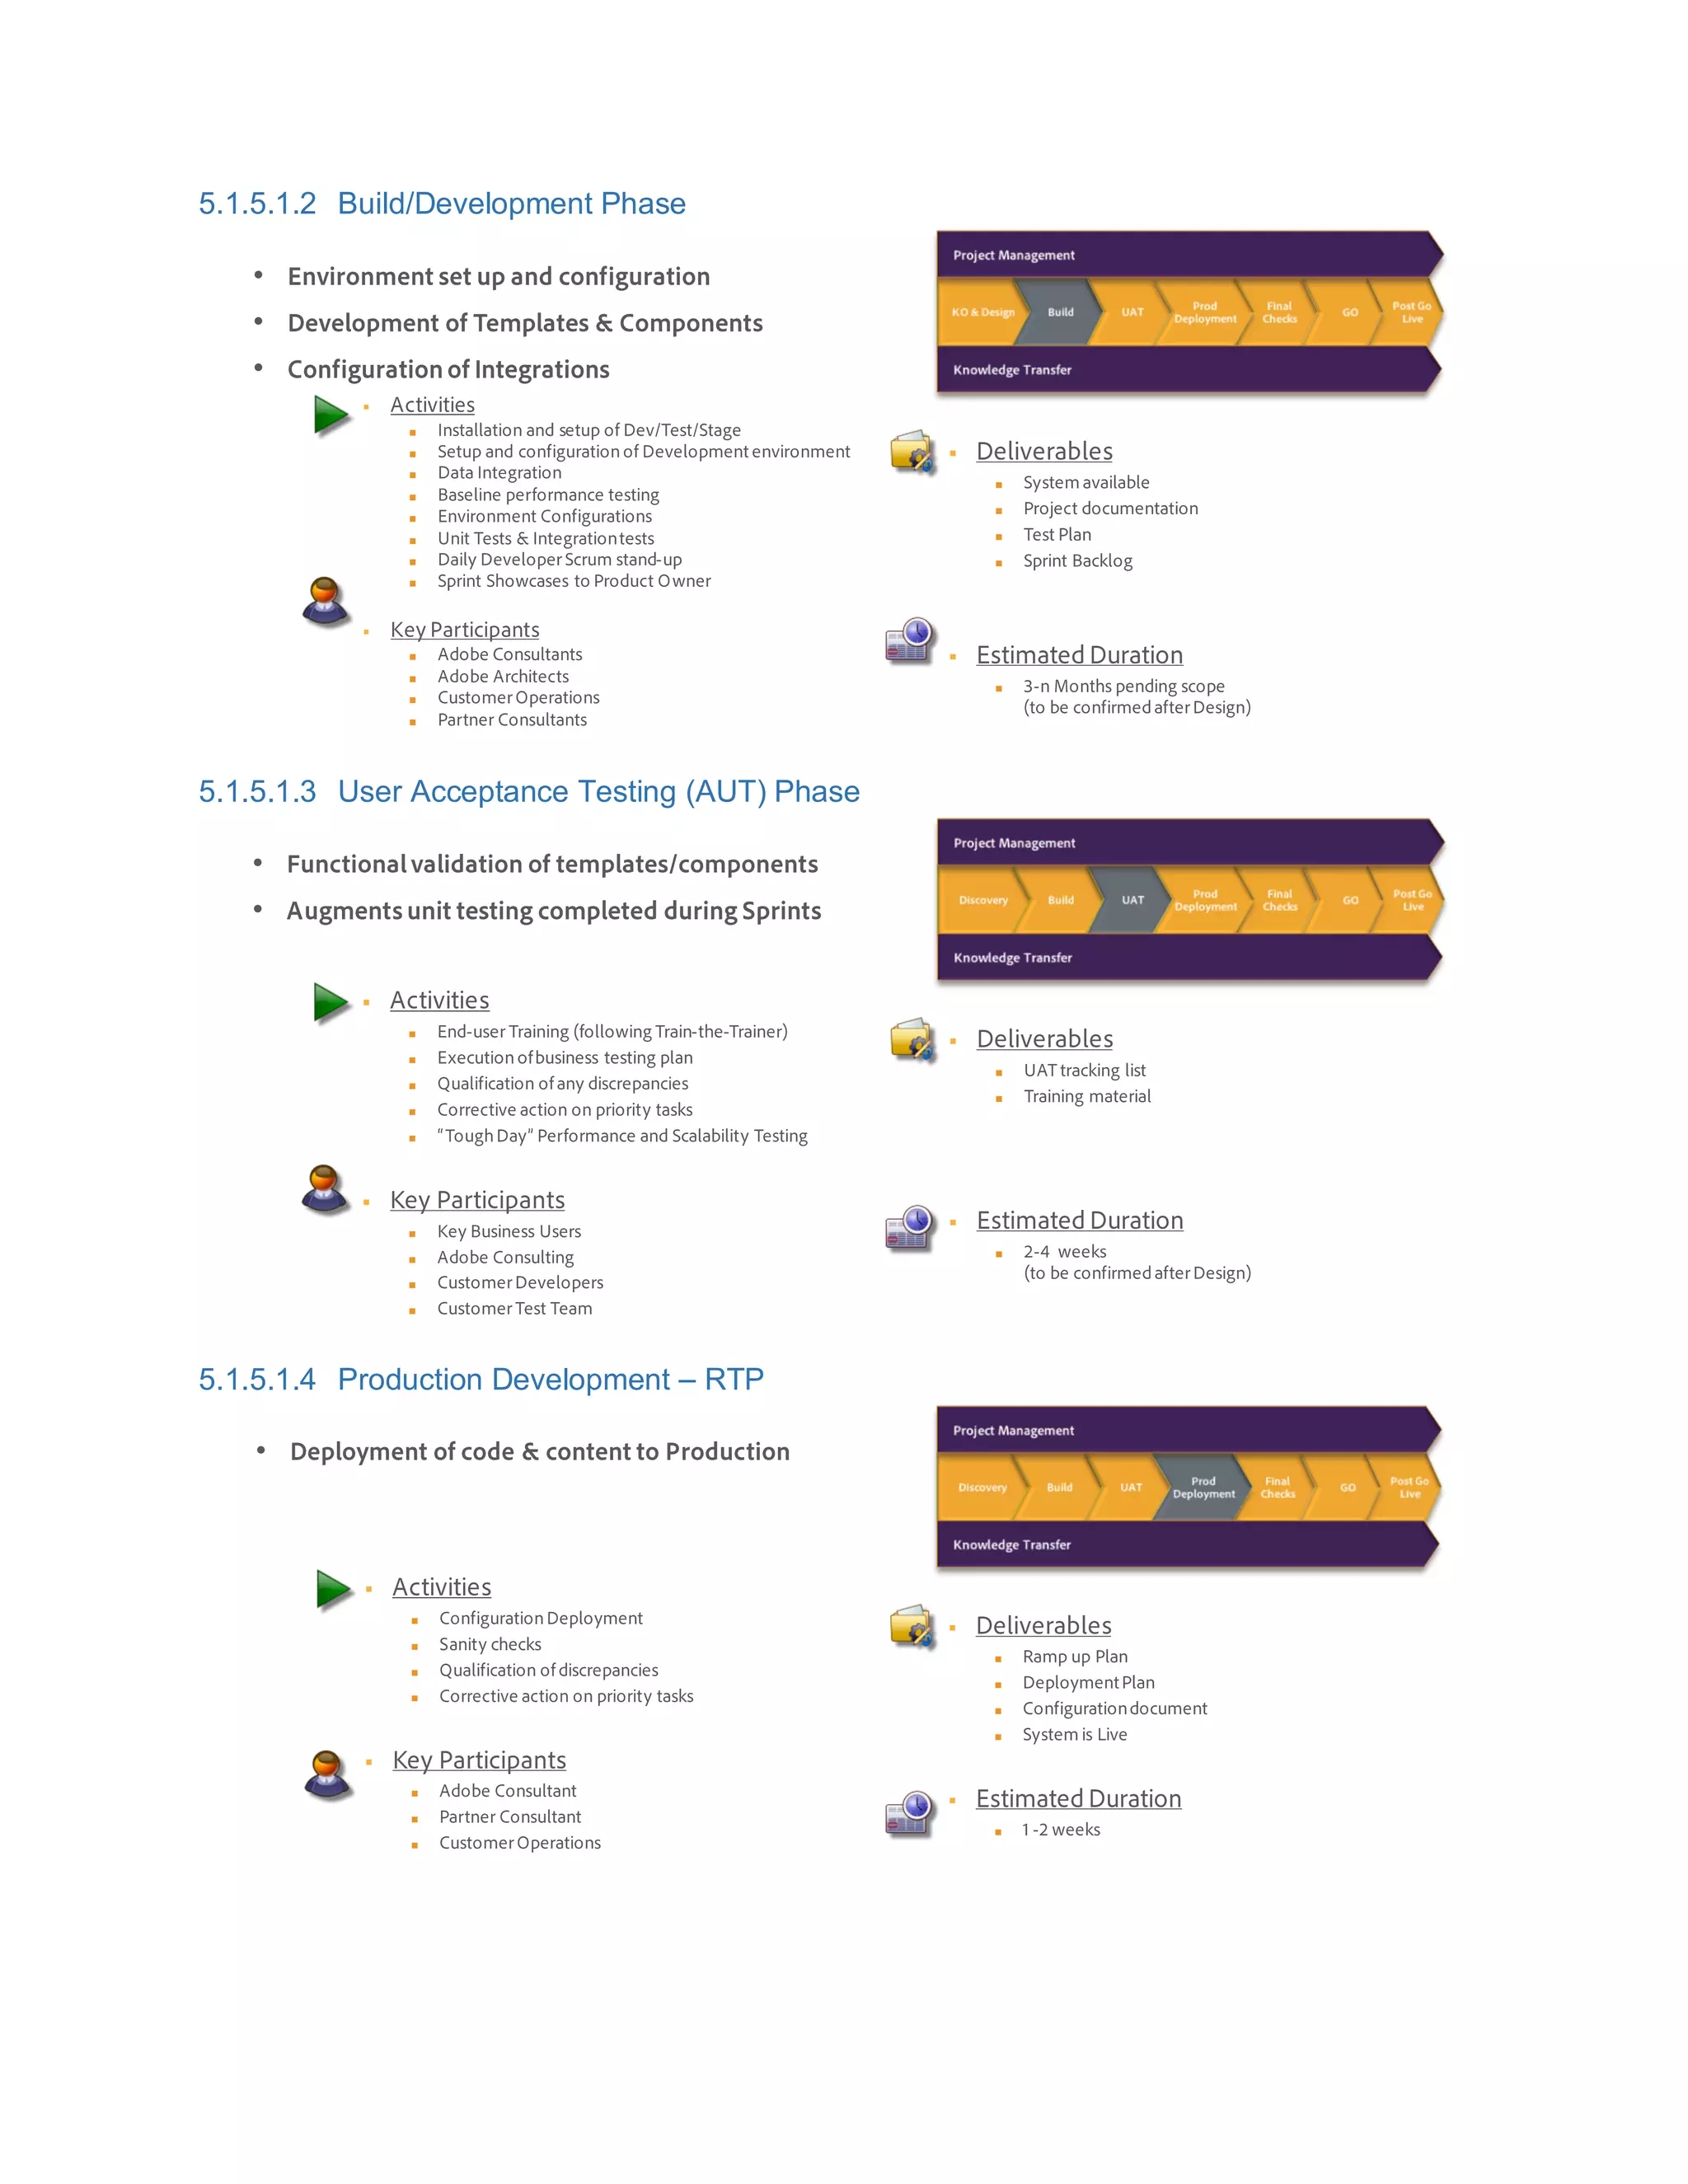
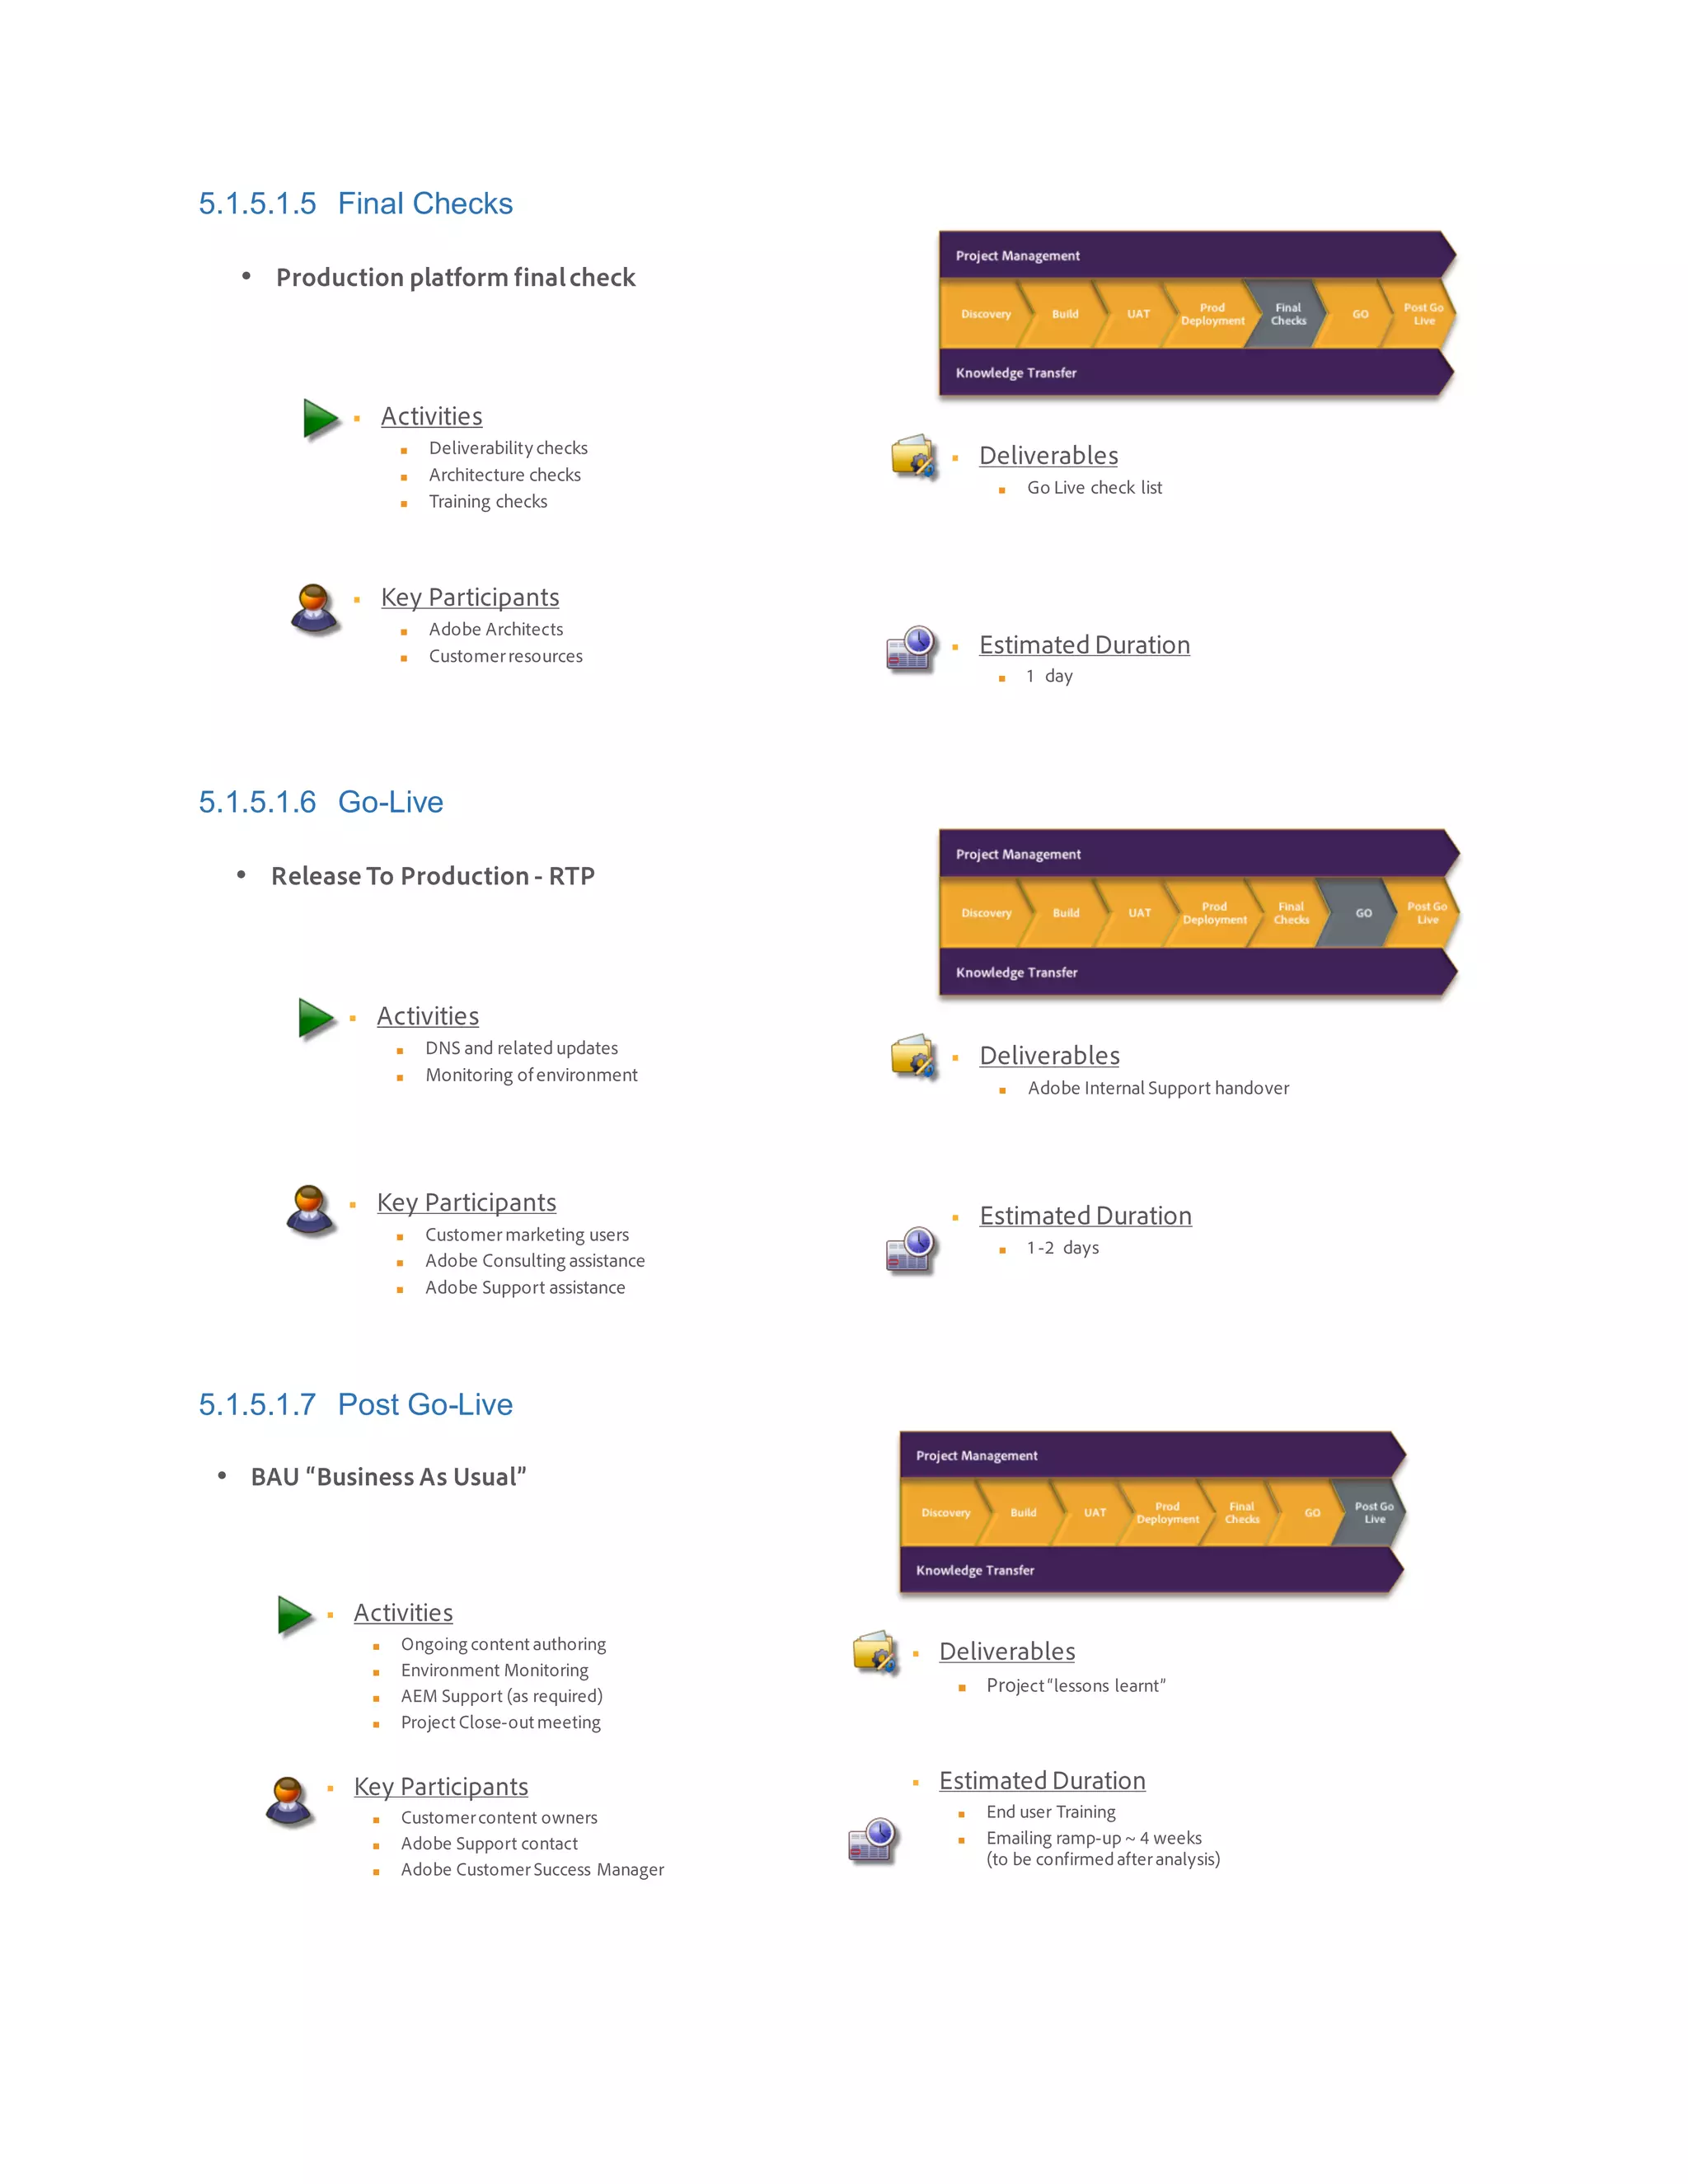
5.1.5 Project Delivery Phases ............................................................................................................... 48
5.1.6 Communication ............................................................................................................................. 52
5.1.7 Administration ............................................................................................................................... 53
5.1.8 Workflows...................................................................................................................................... 56
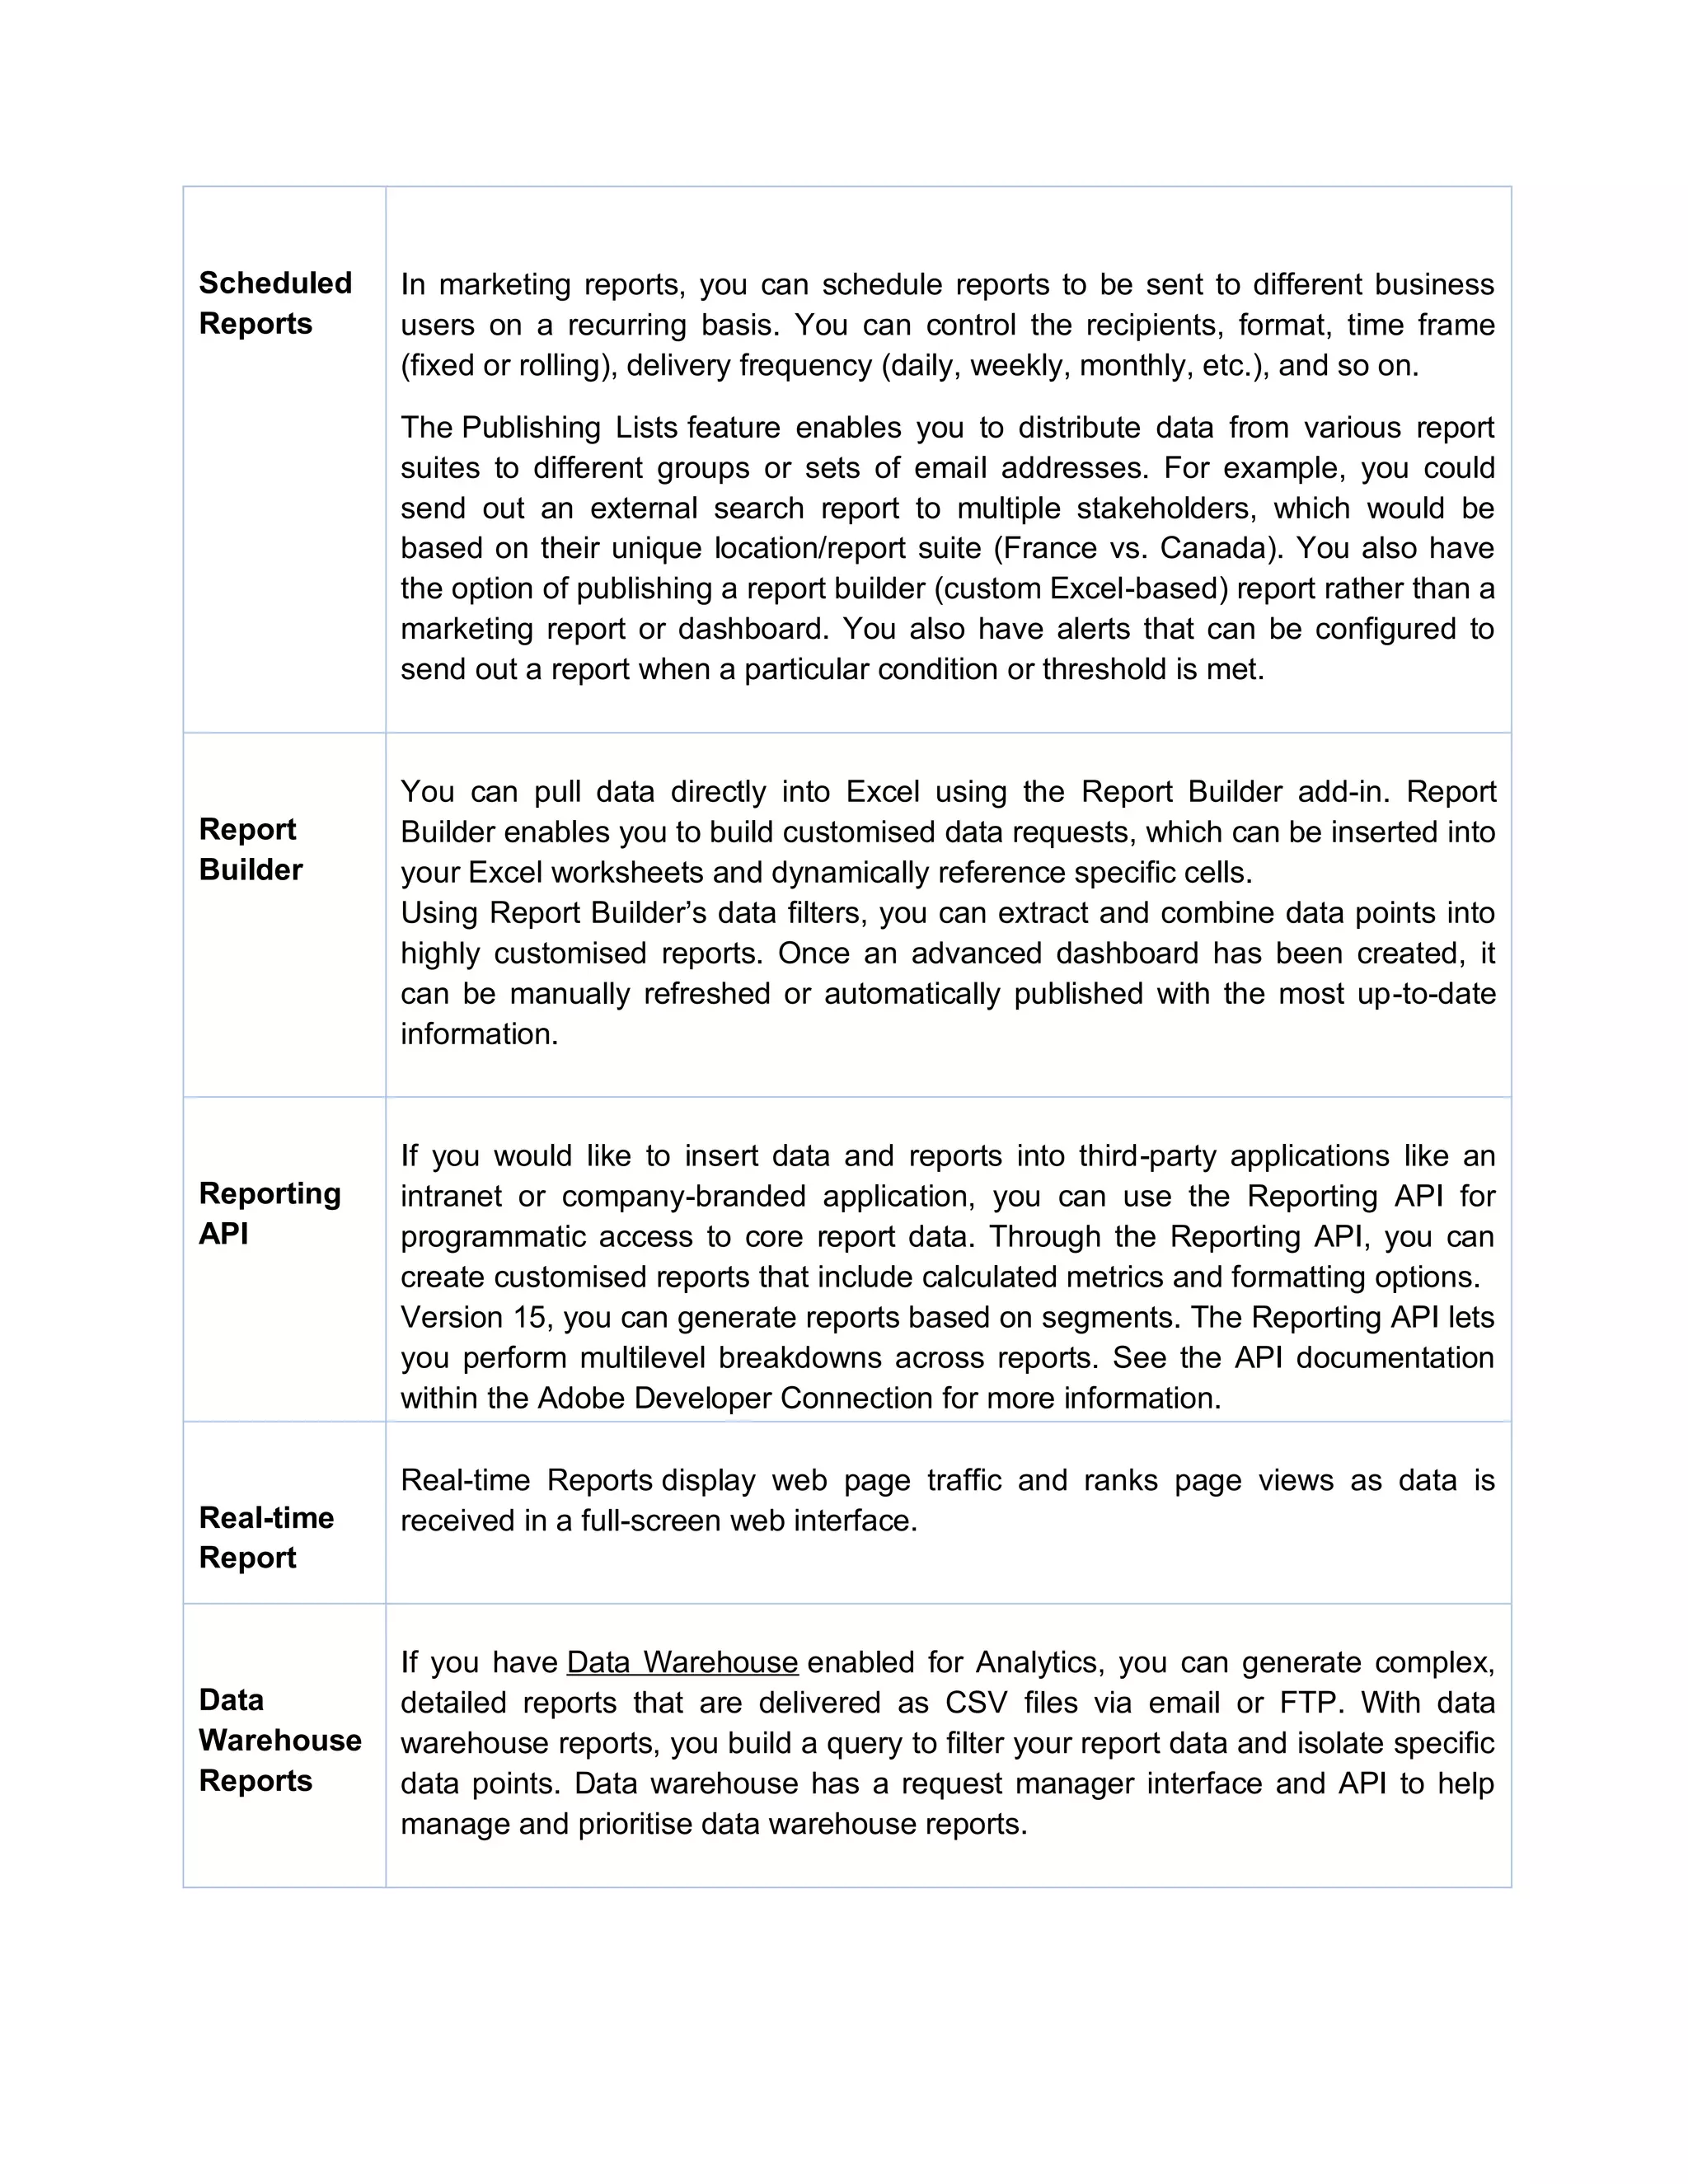
5.2 Reporting and Insights ......................................................................................................................72
5.3 Usage ....................................................................................................................................................93
5.4 Sustainability.......................................................................................................................................94
5.5 Change Management..........................................................................................................................94
6 PRODUCT .......................................................................................................................95
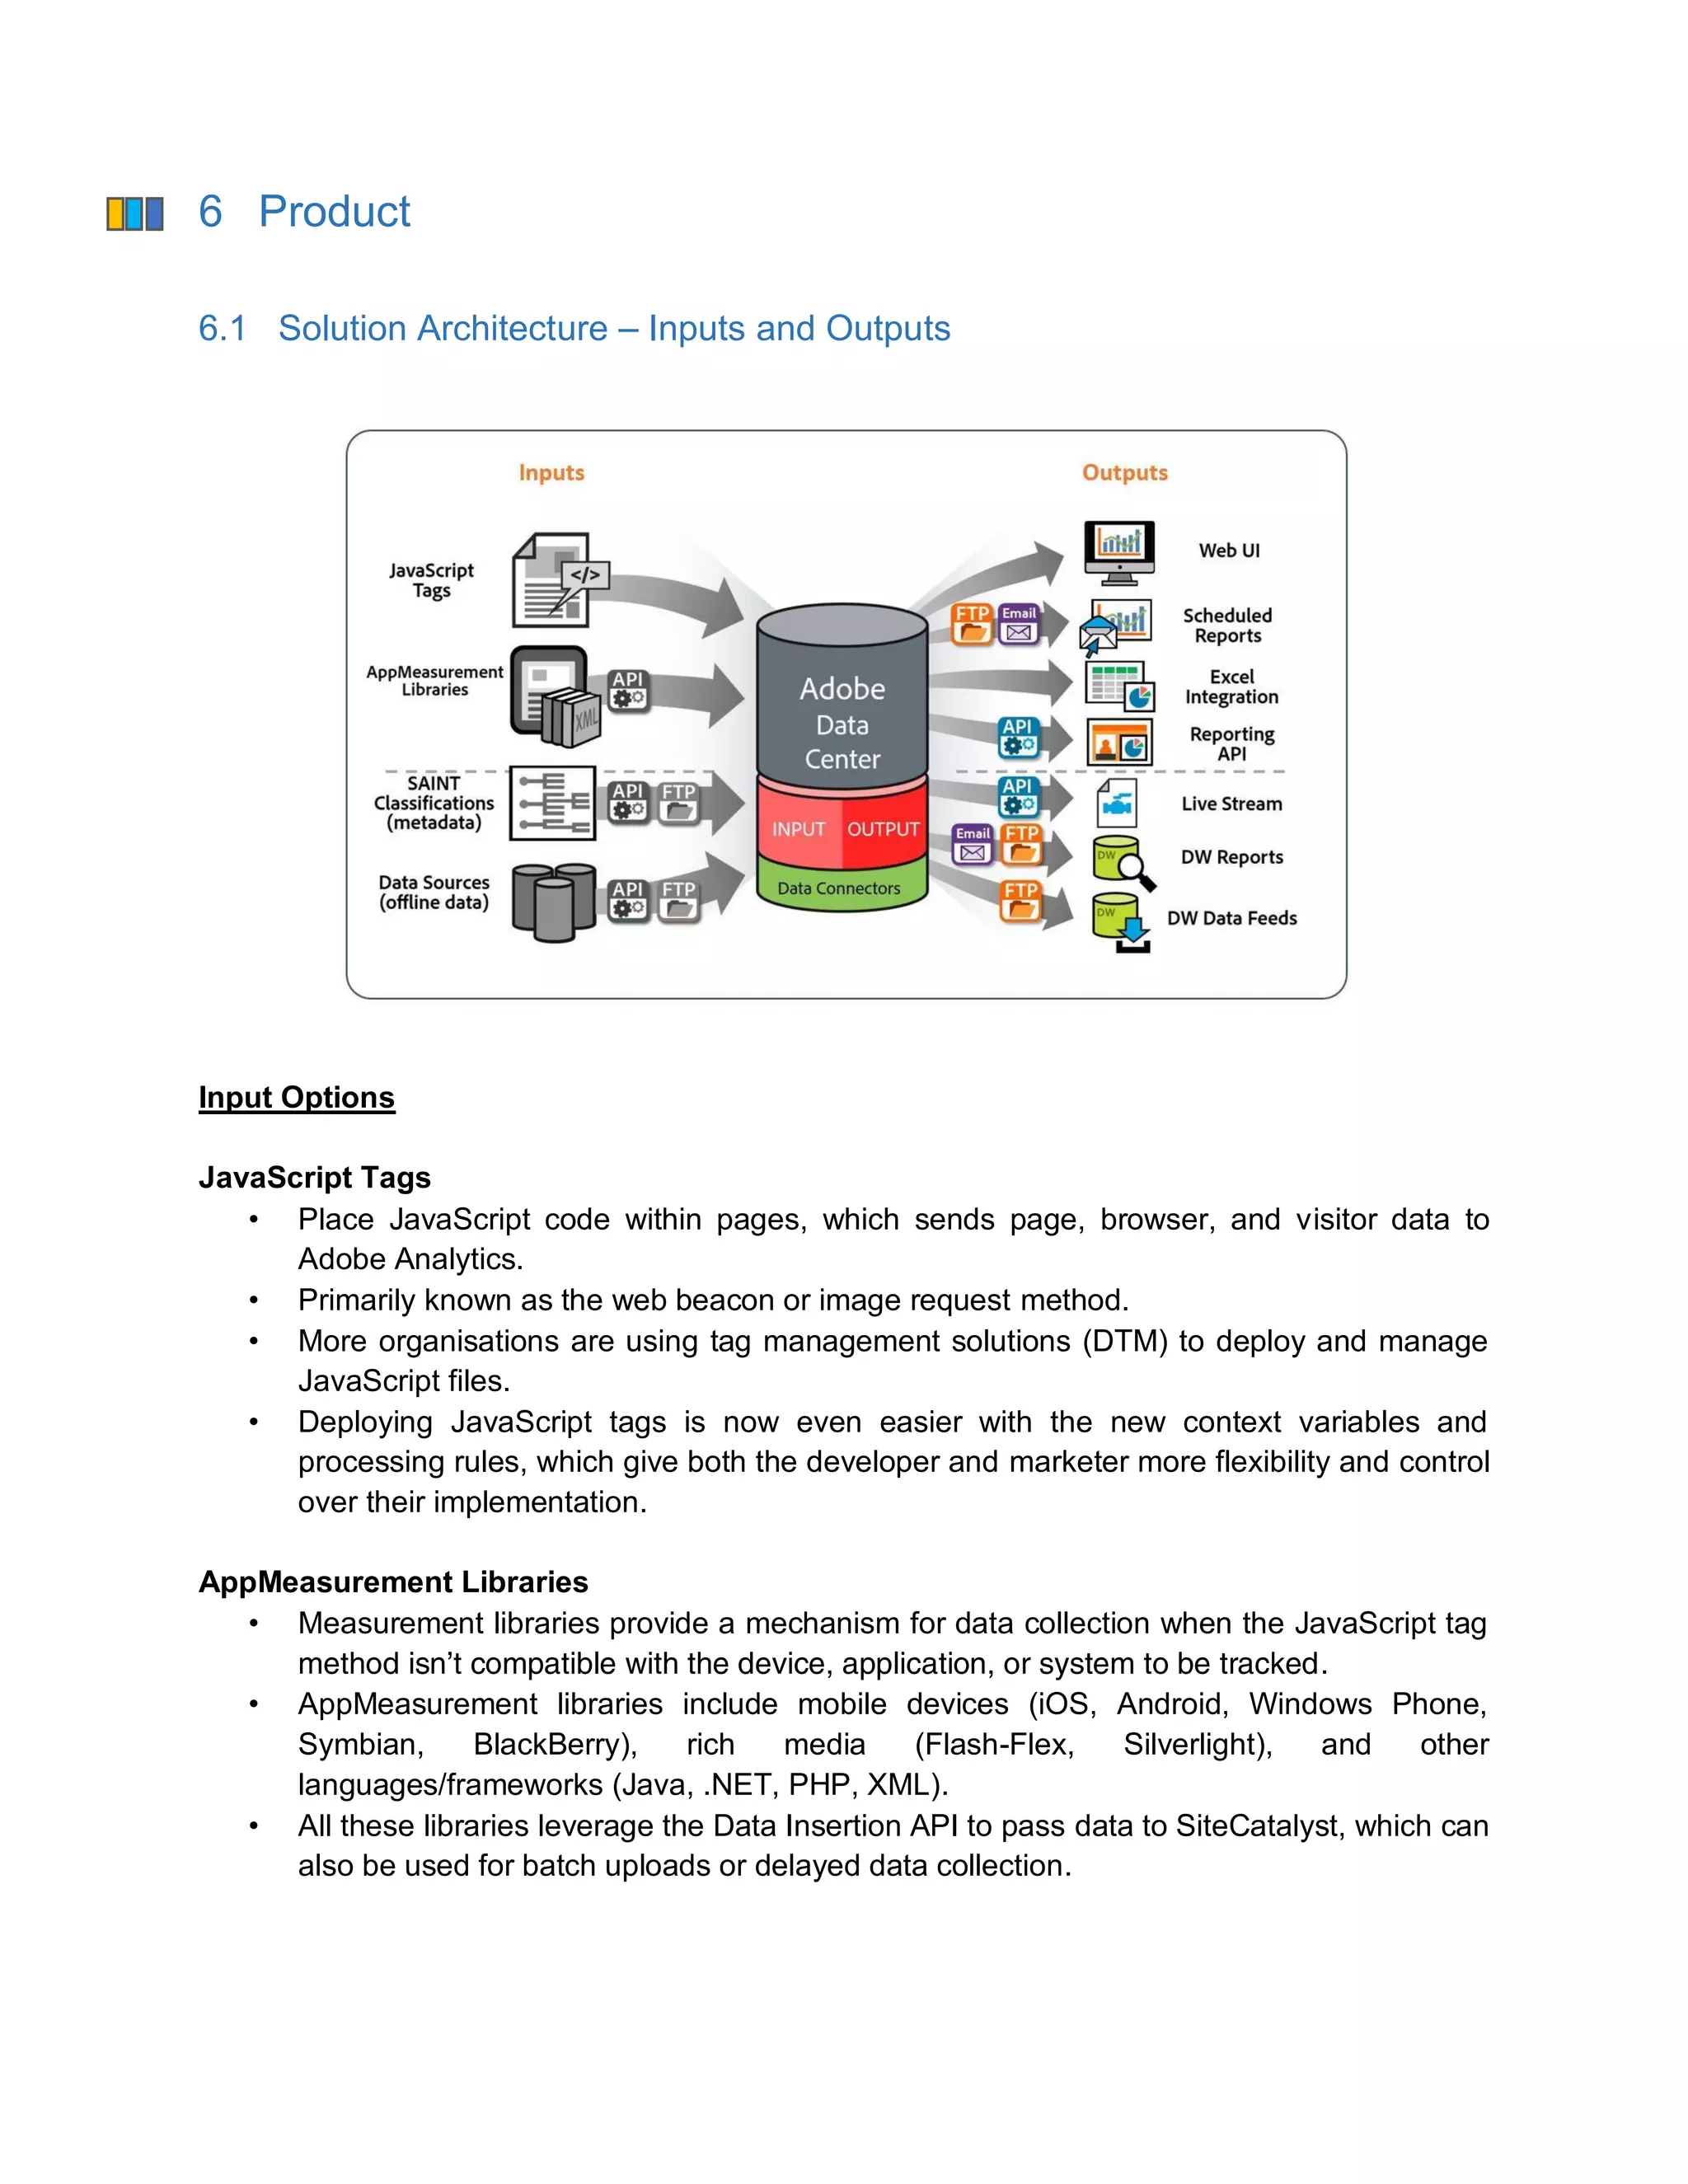
6.1 Solution Architecture – Inputs and Outputs ..................................................................................95
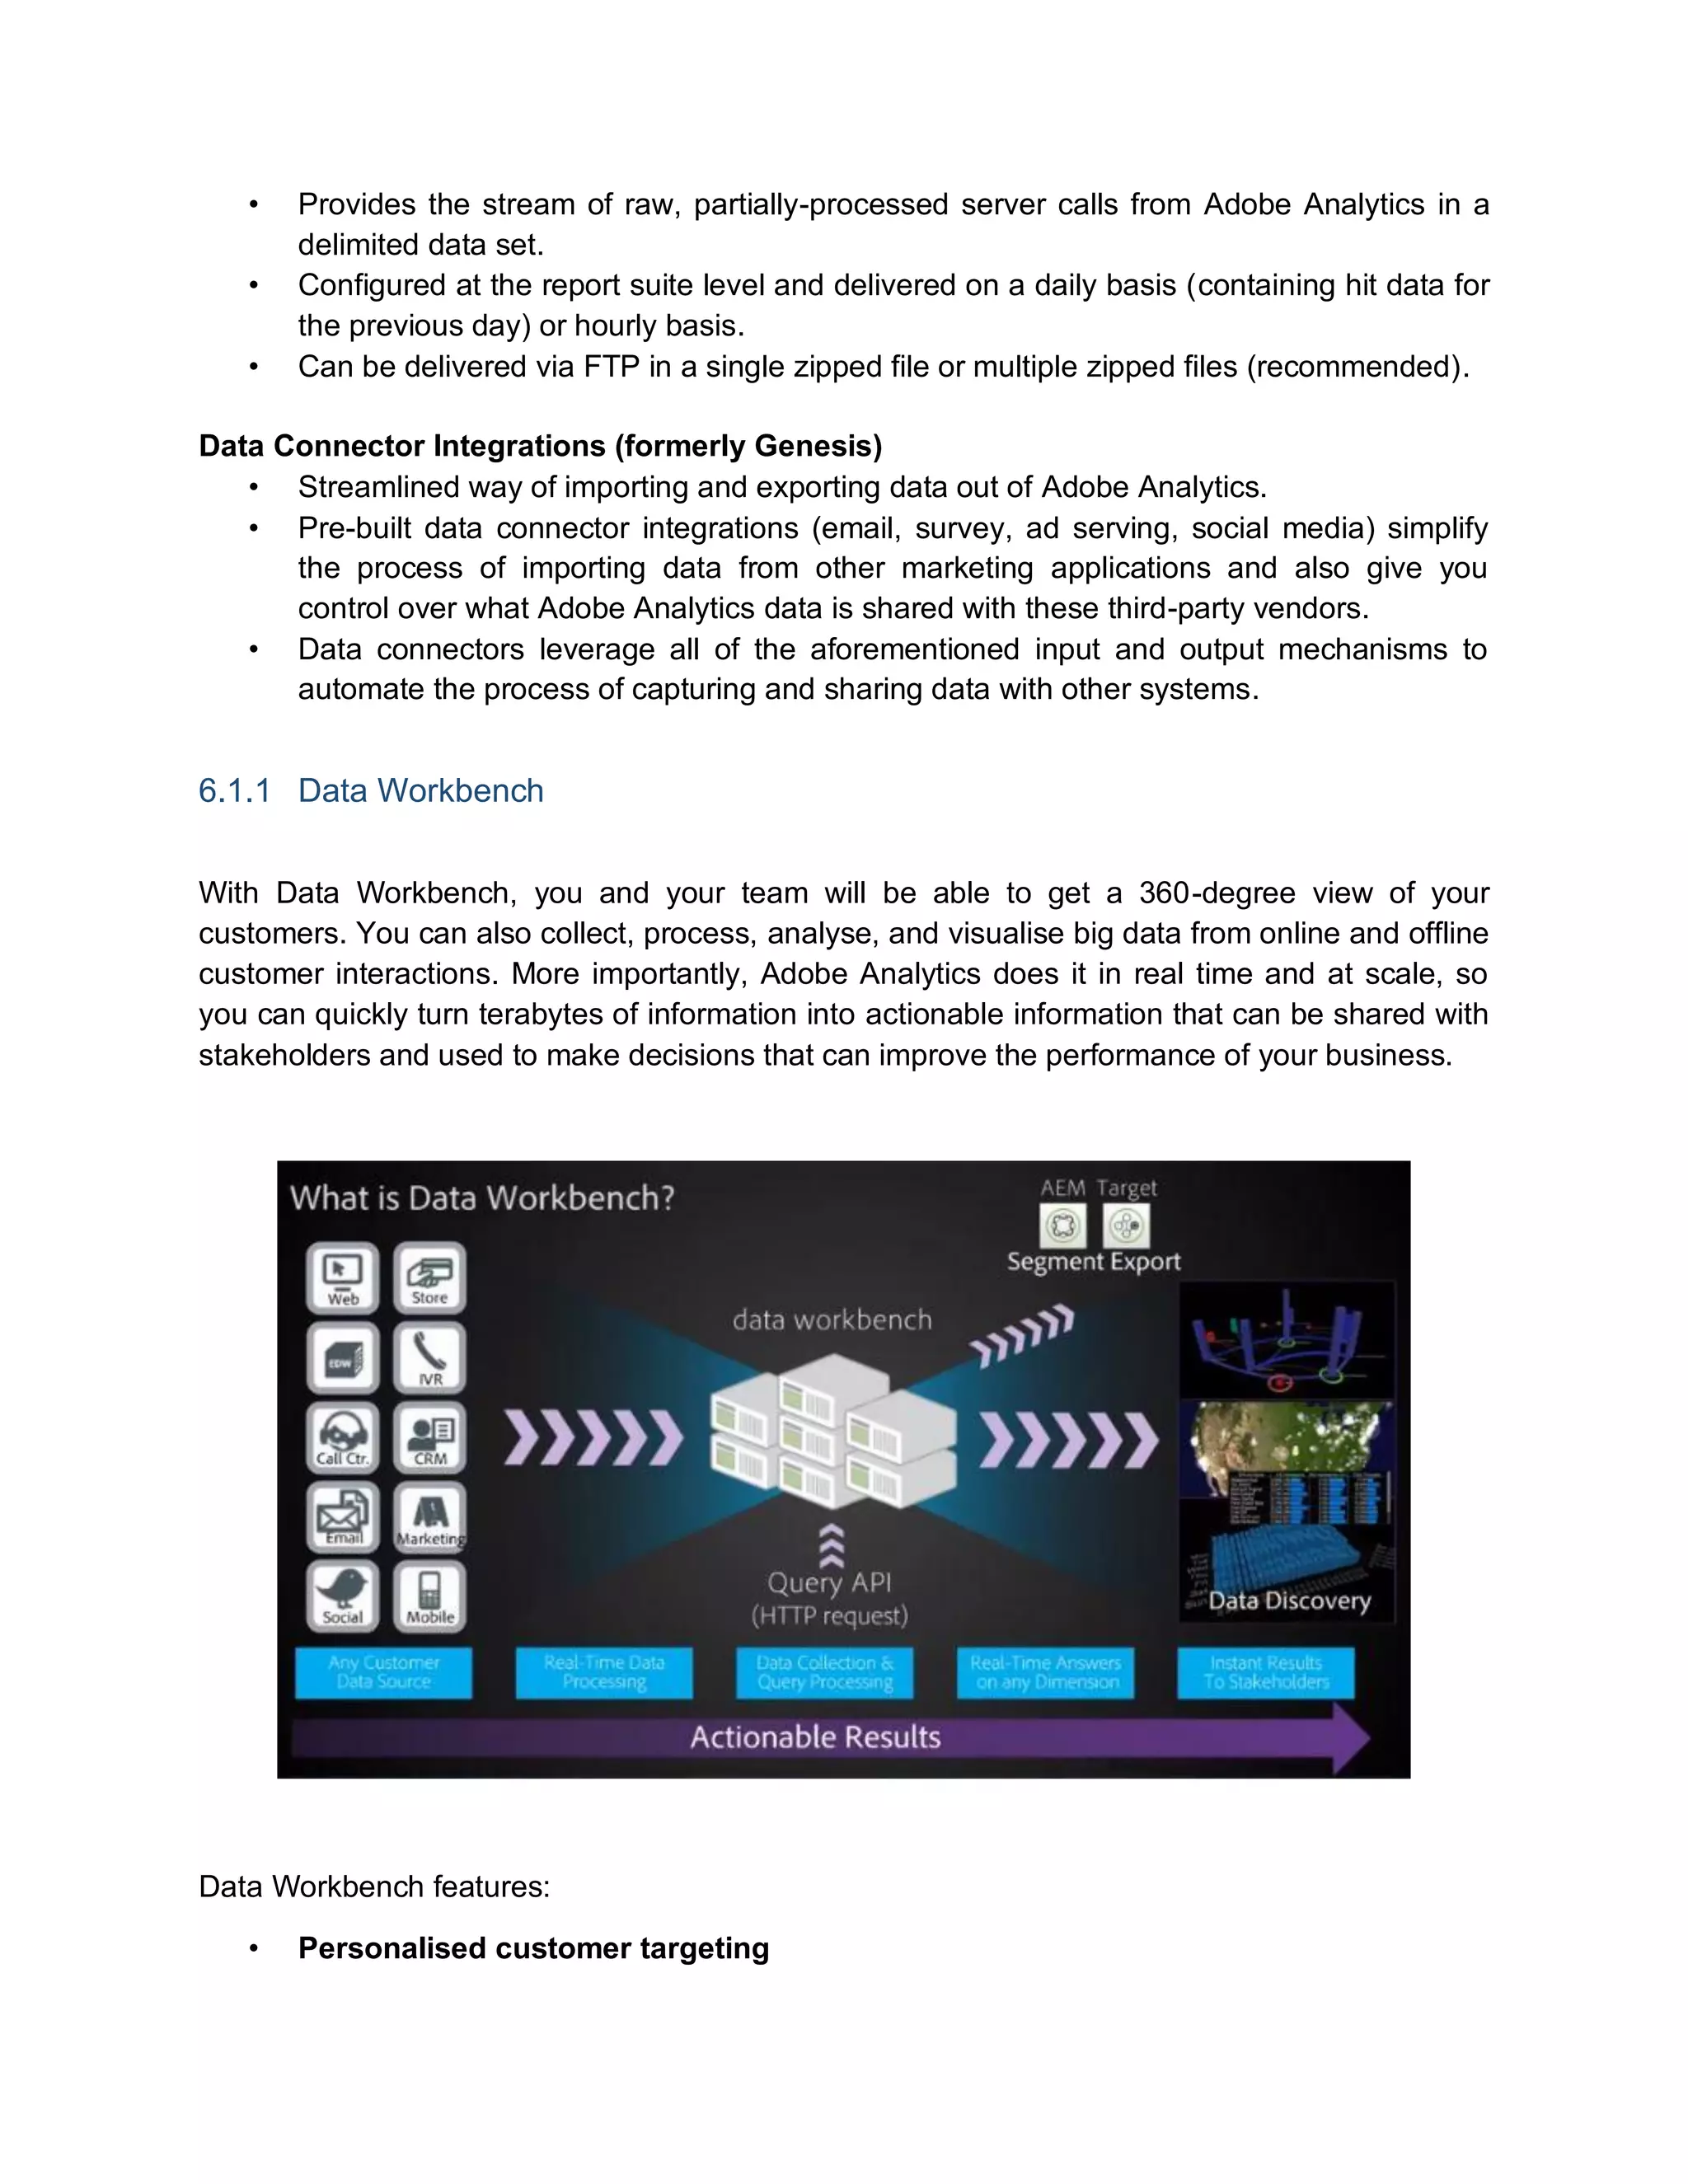
6.1.1 Data Workbench ........................................................................................................................... 98
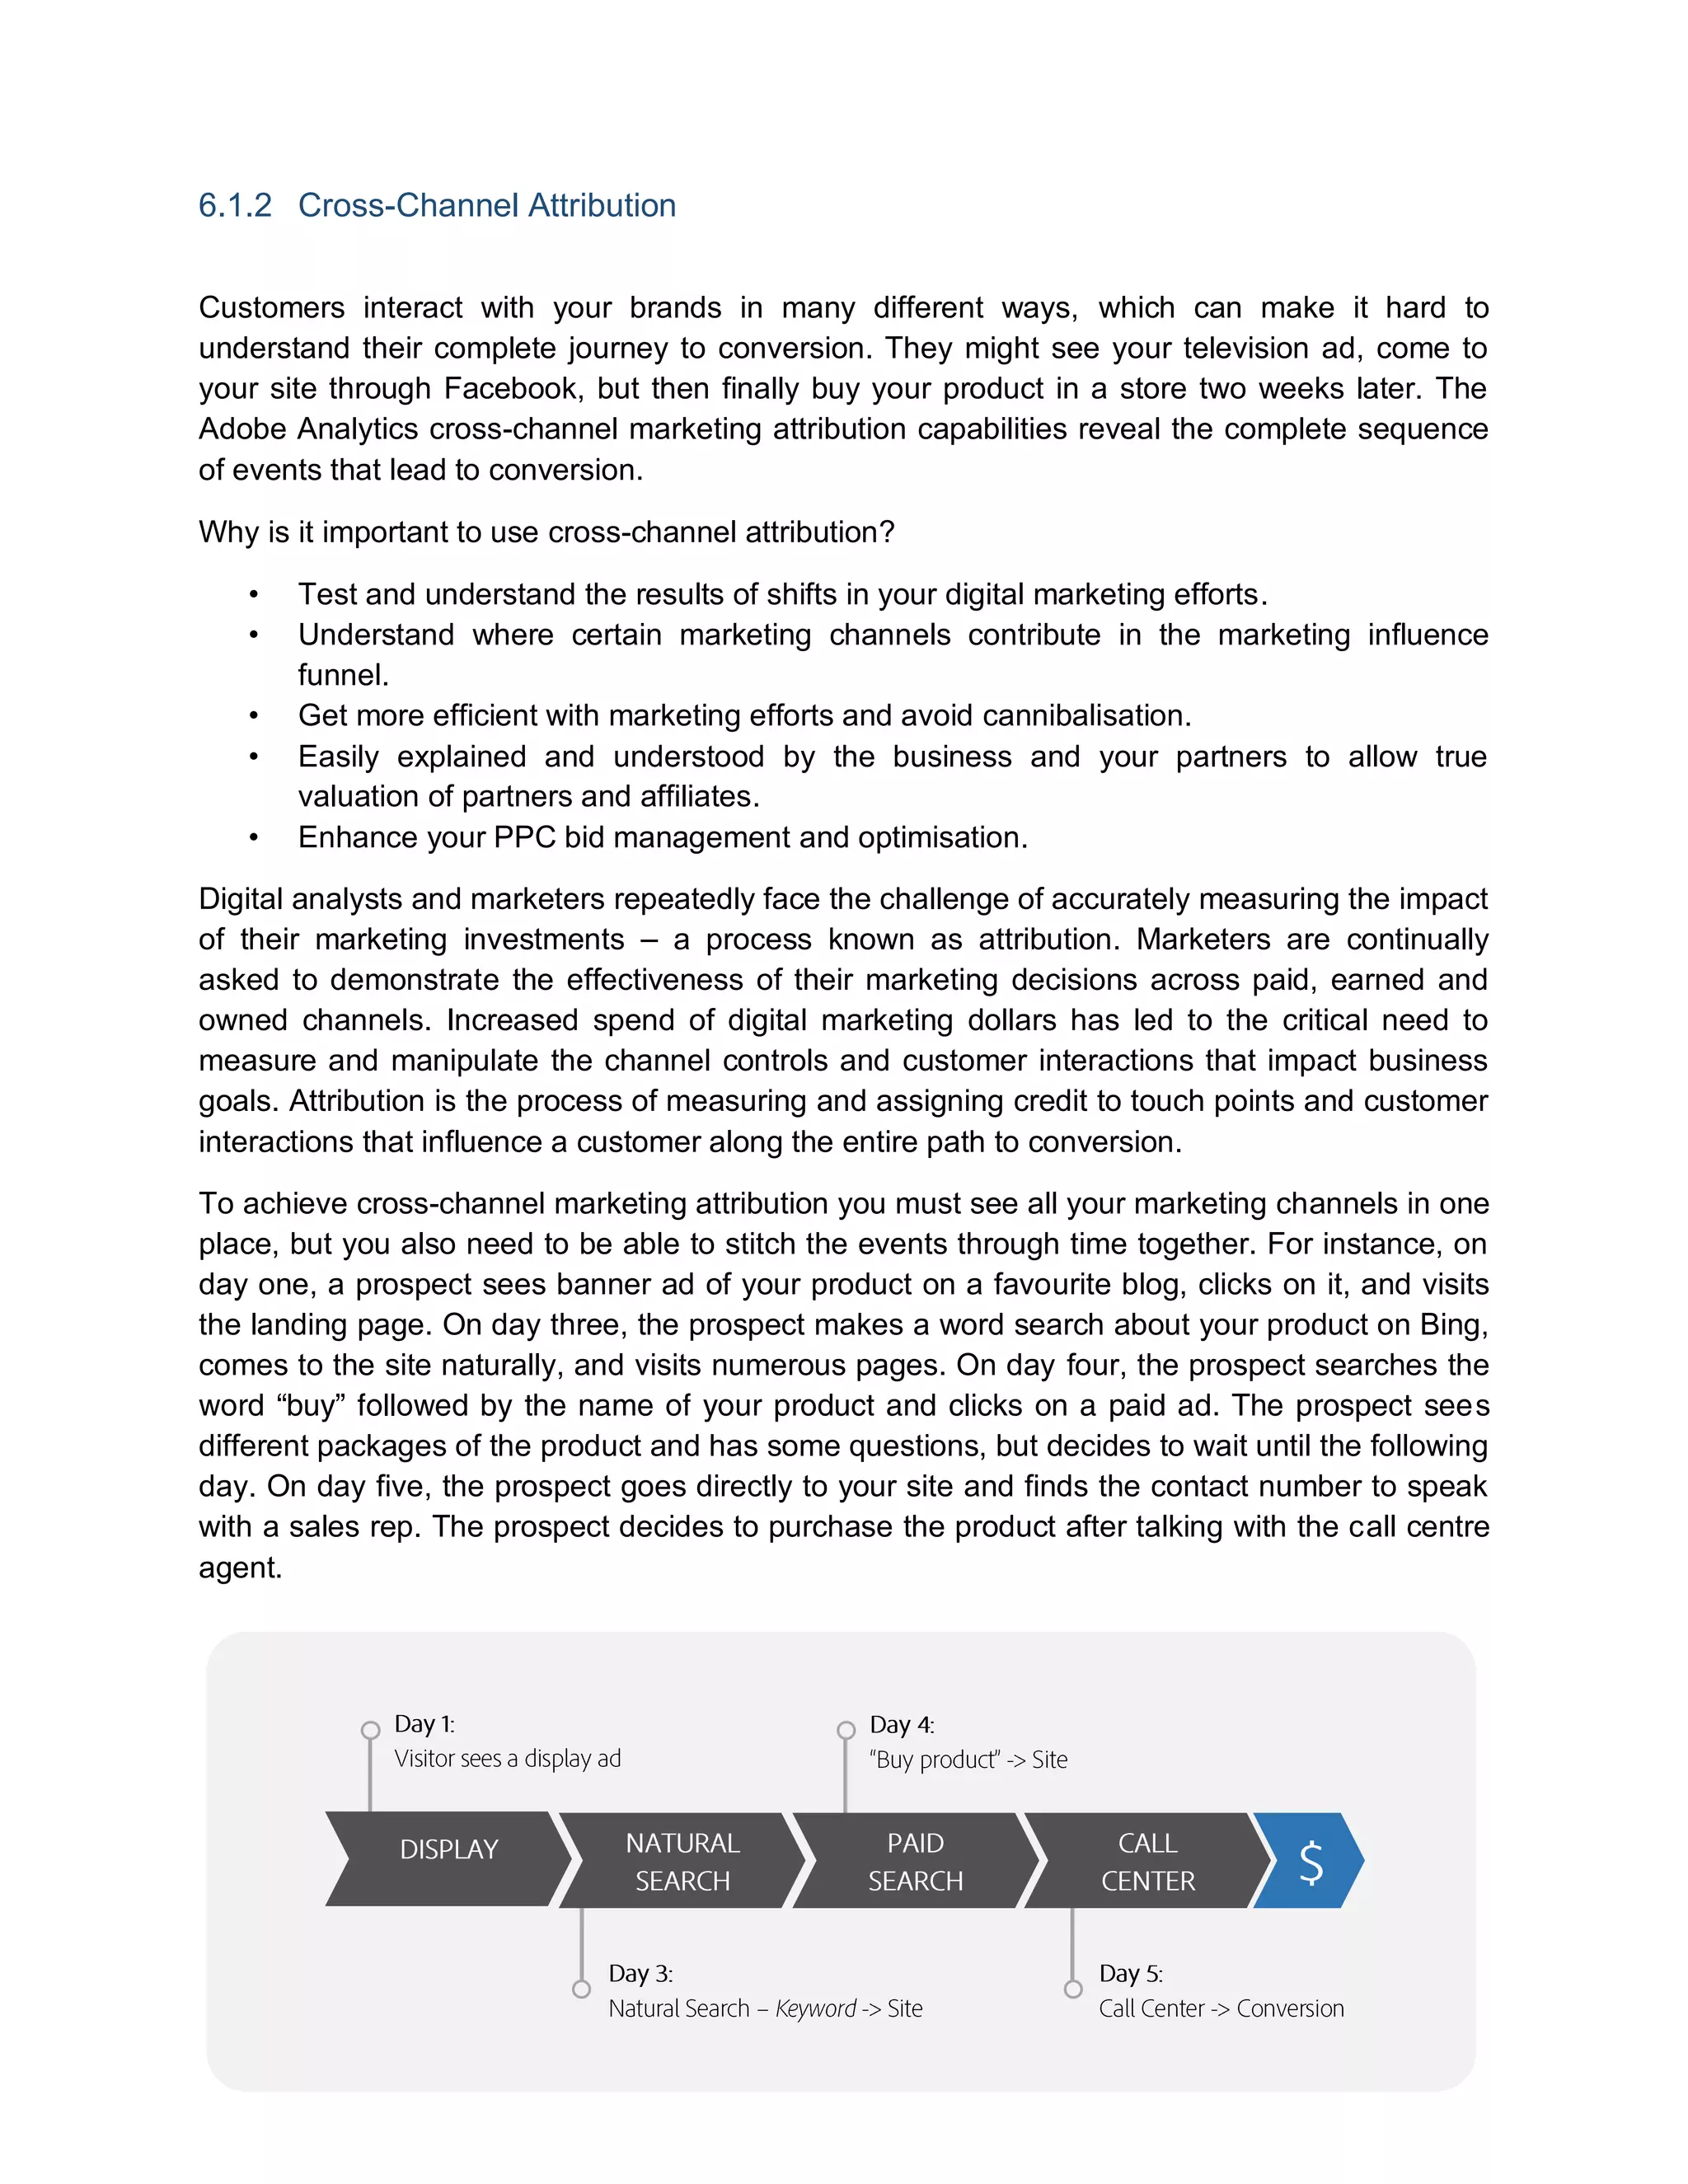
6.1.2 Cross-Channel Attribution.......................................................................................................... 100
6.1.3 Report Builder ............................................................................................................................. 101
6.1.4 Ad Hoc Analysis.......................................................................................................................... 102
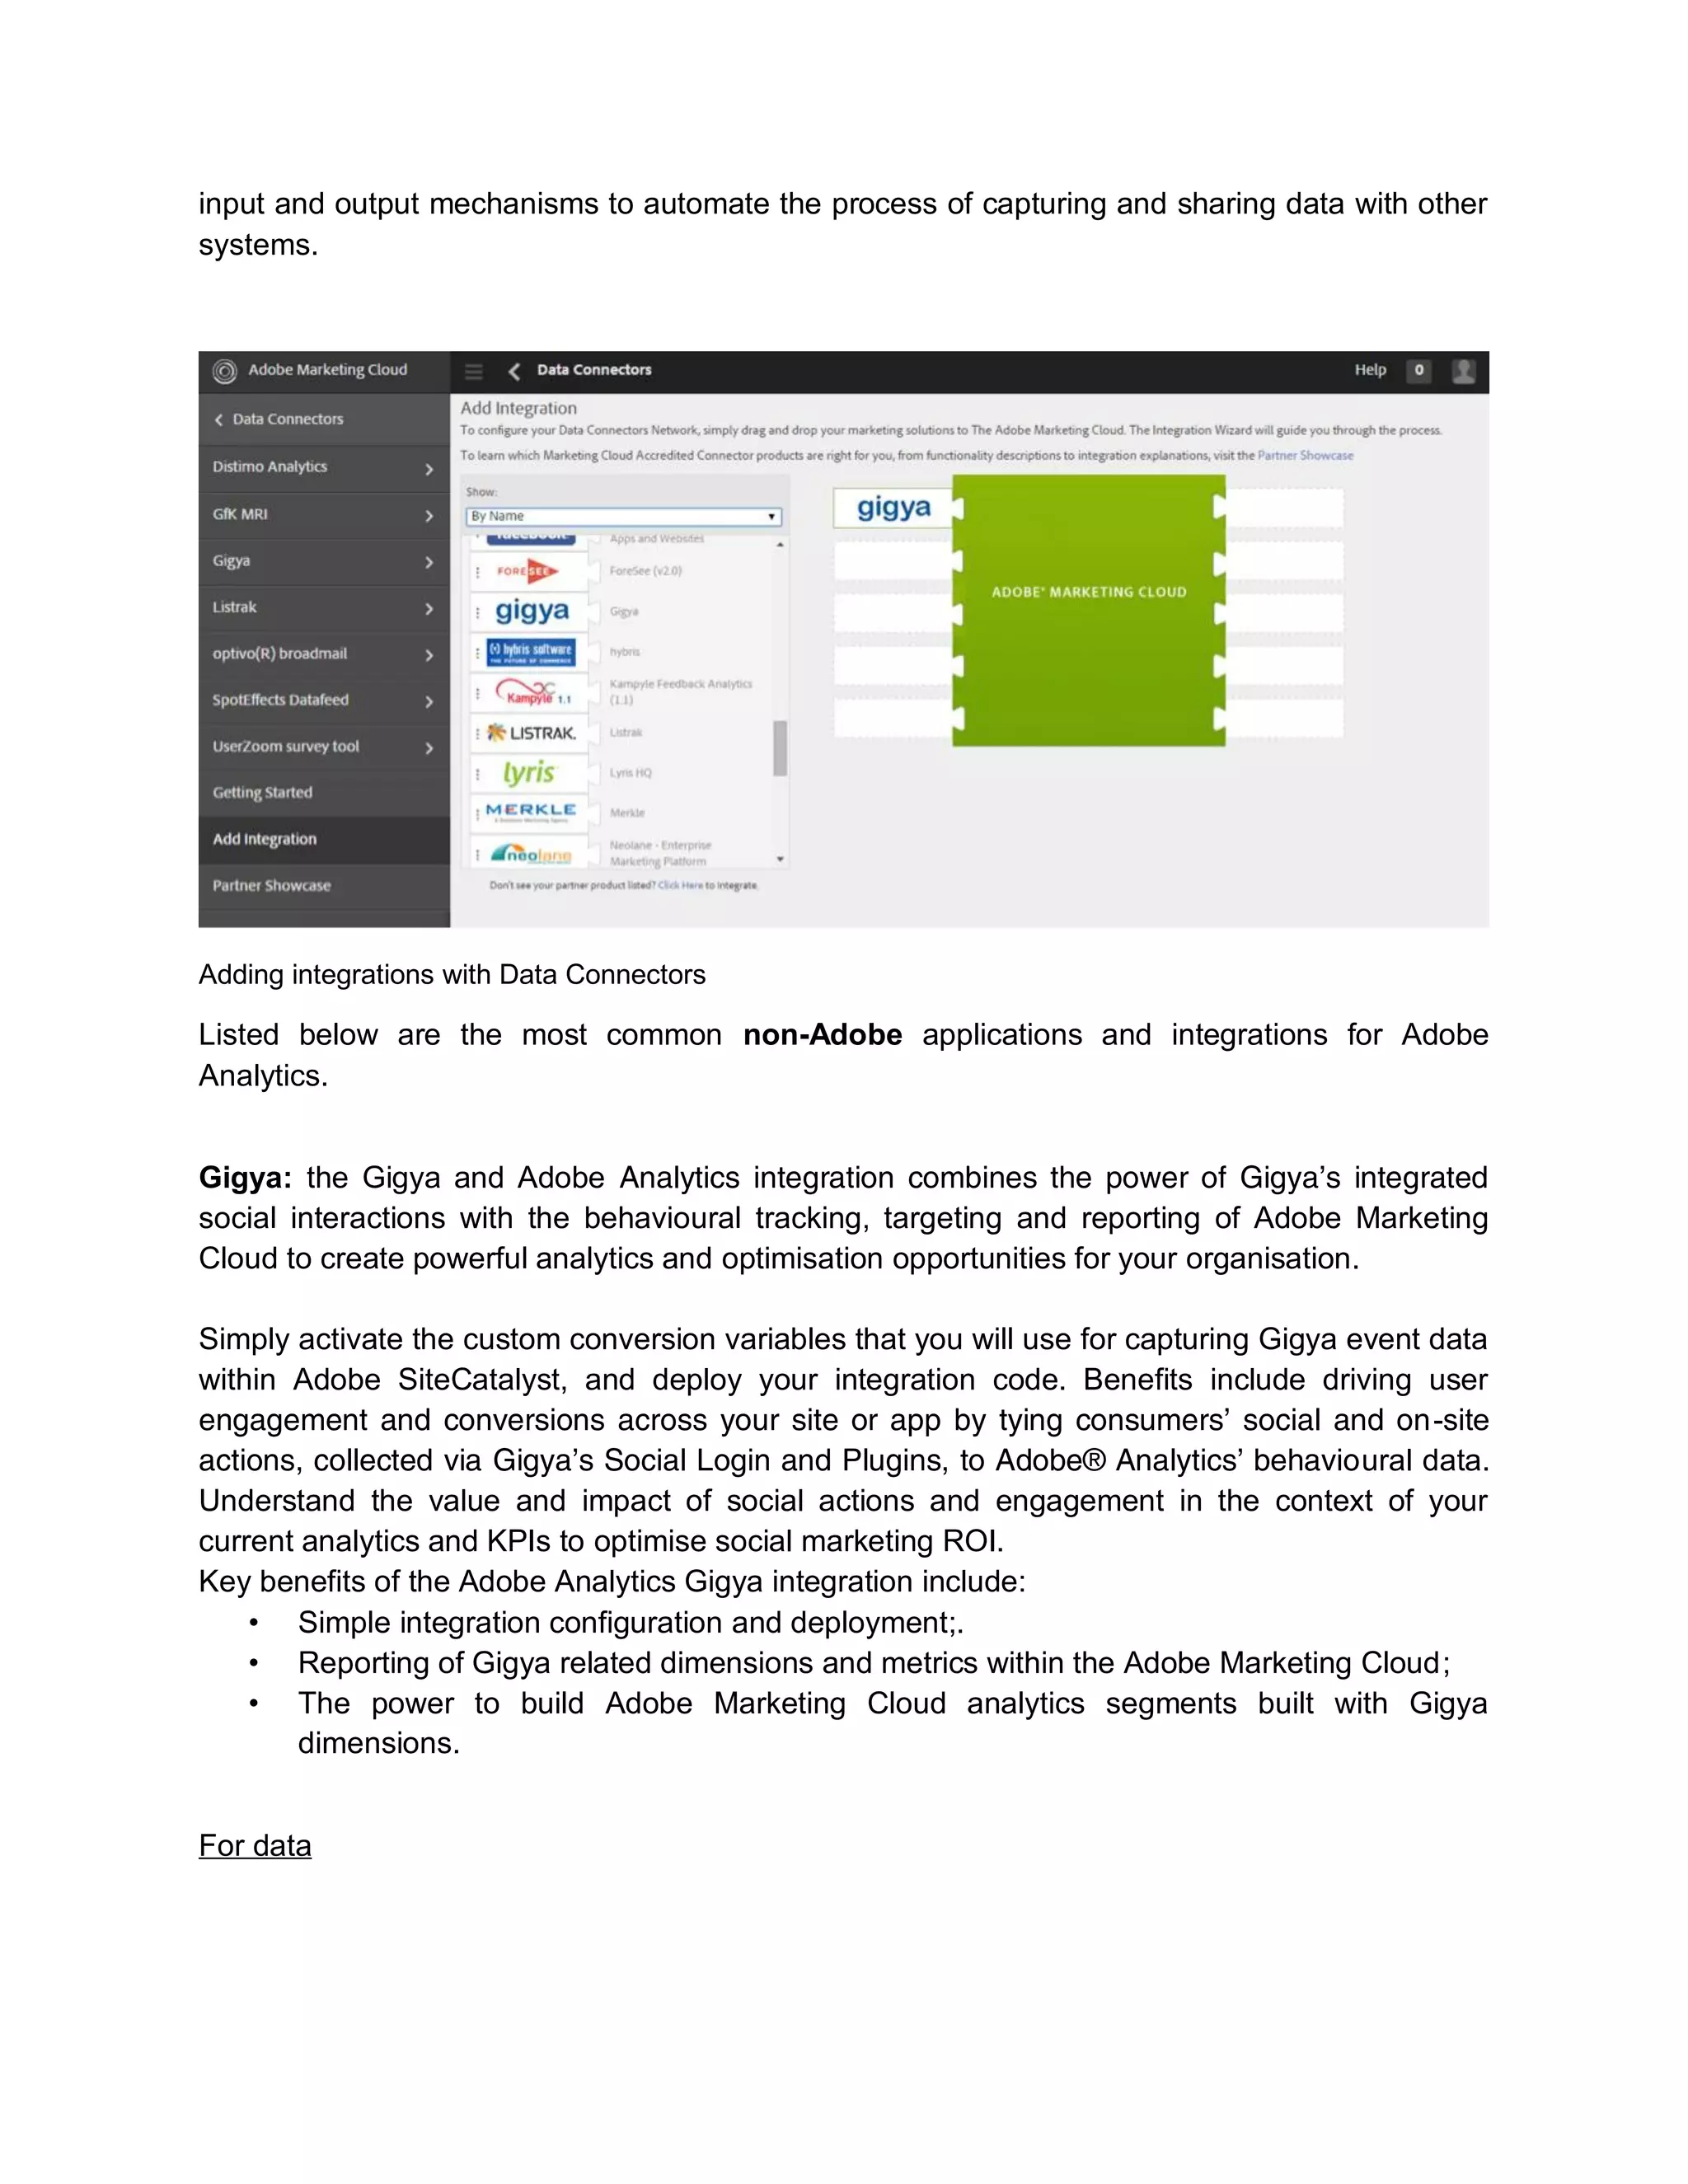
6.1.5 Data Connectors......................................................................................................................... 103
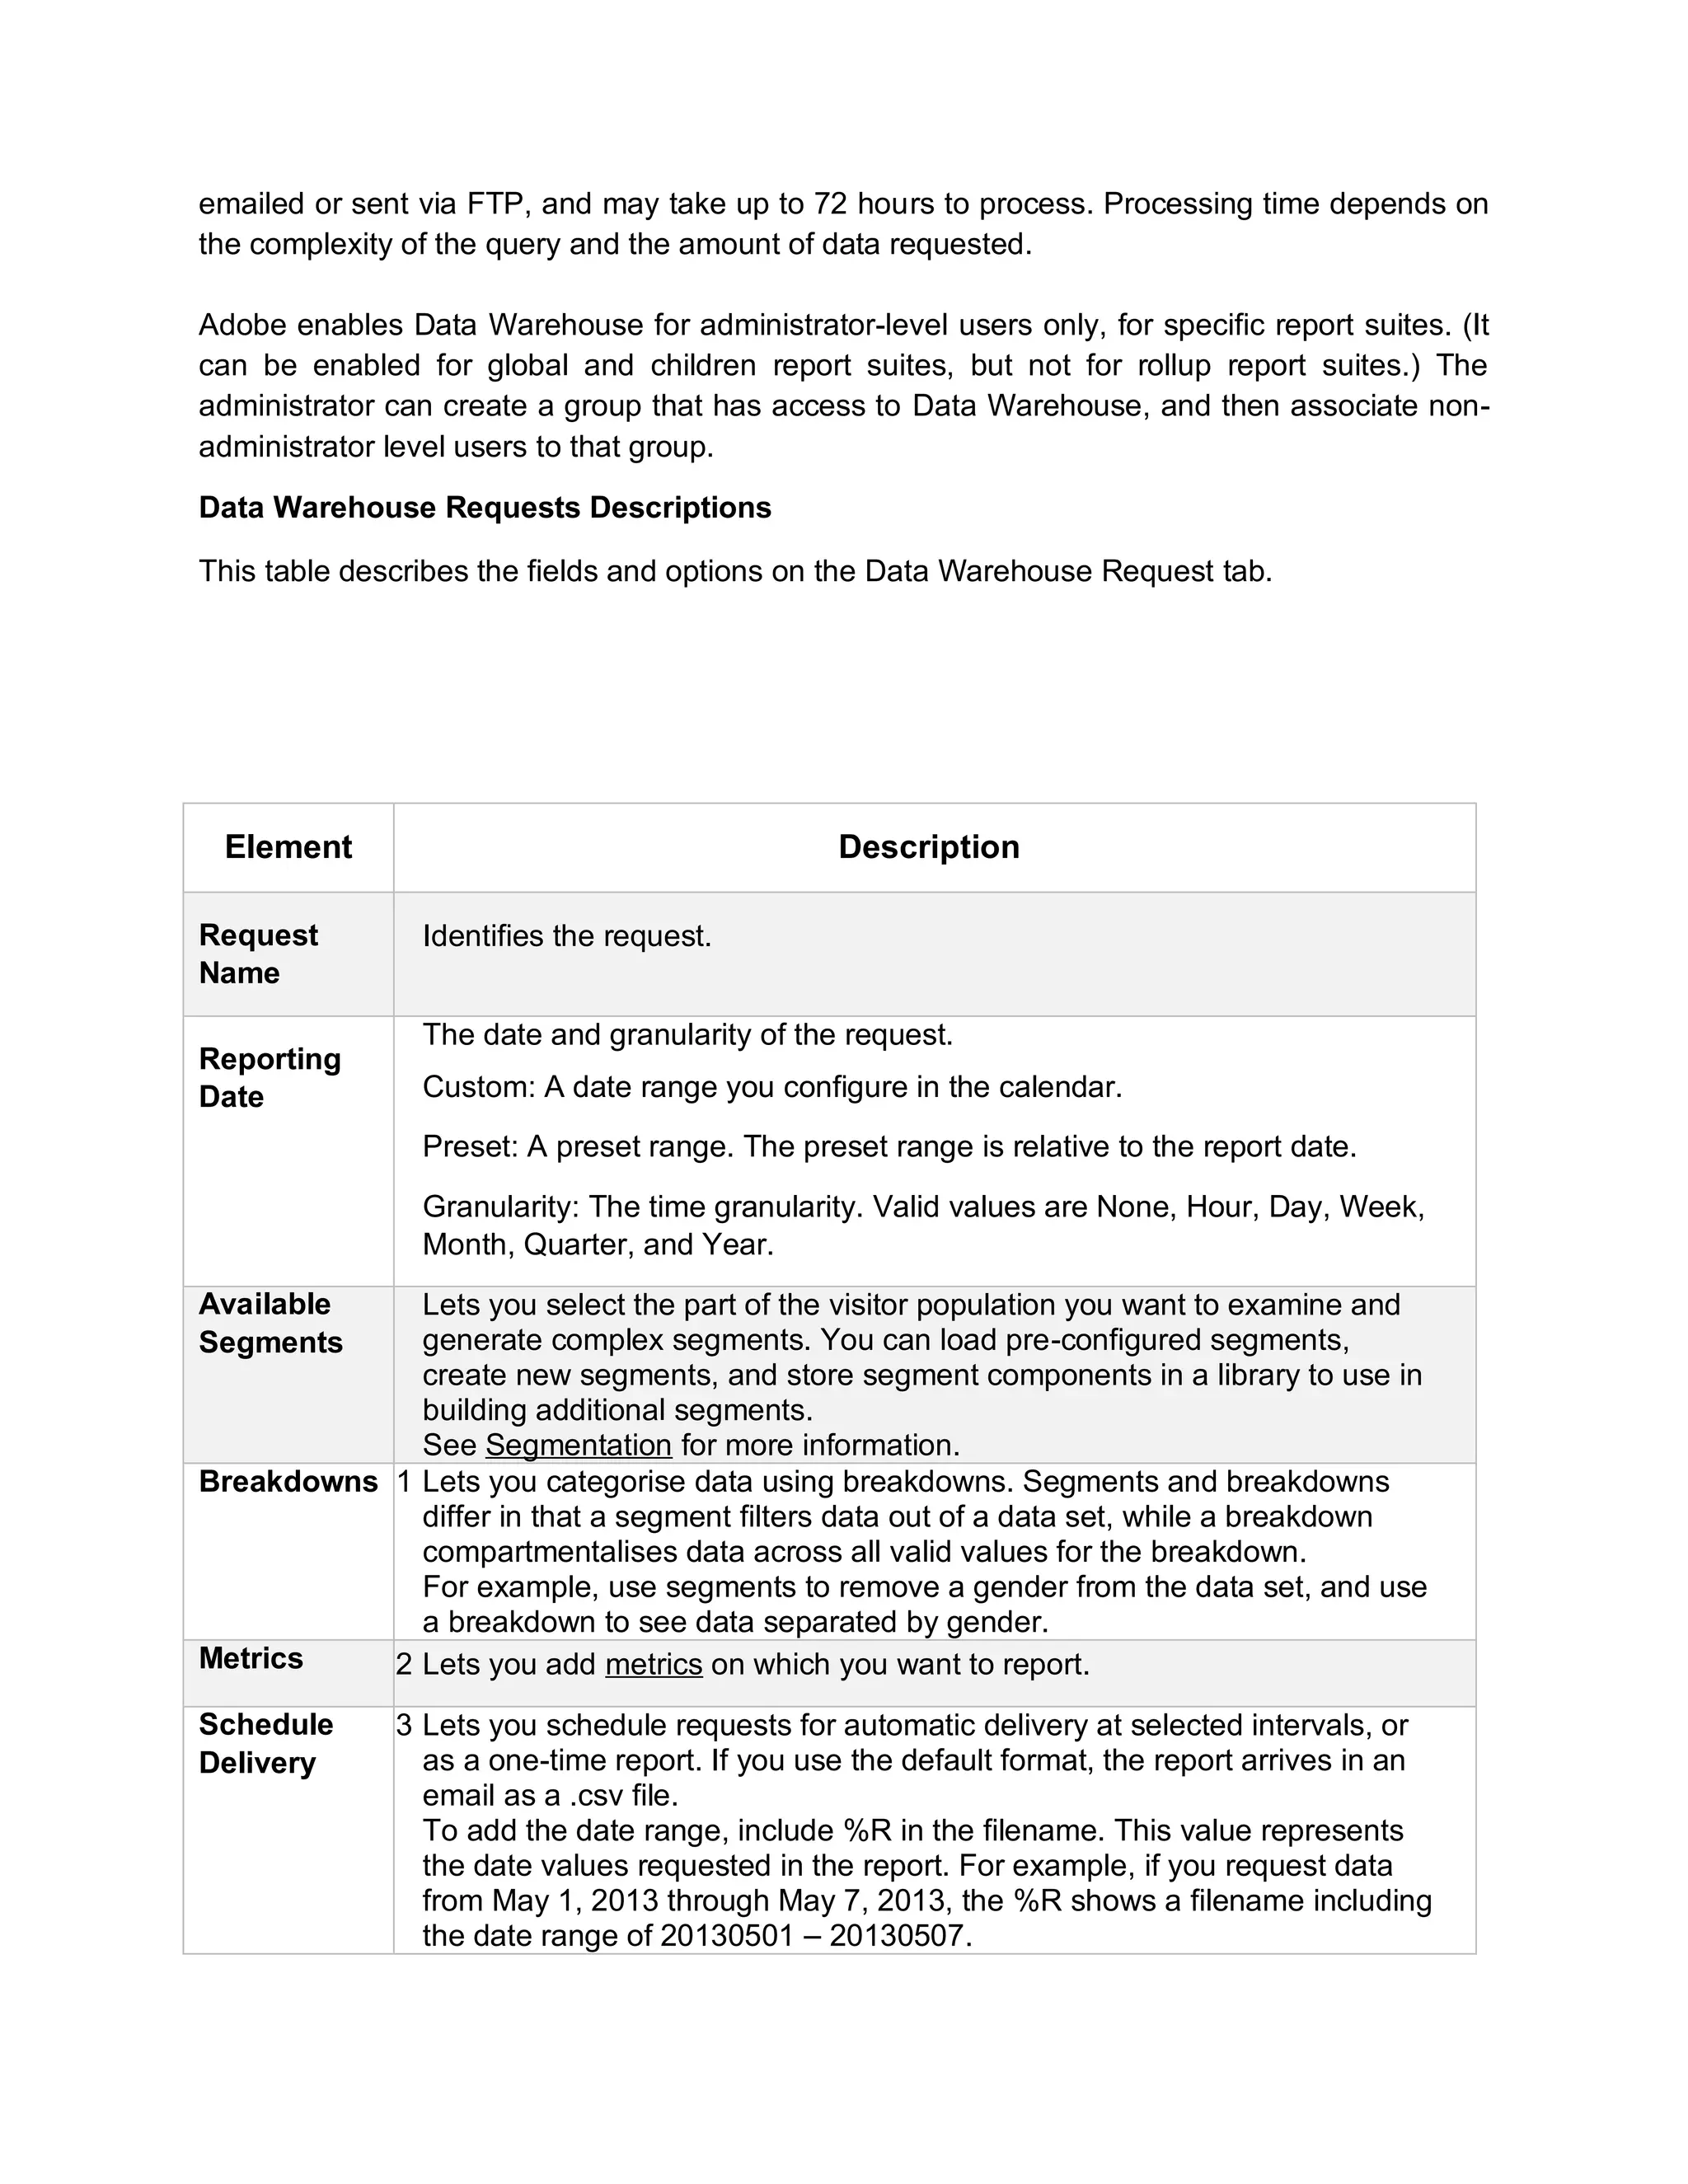
6.1.6 Data Warehouse......................................................................................................................... 103
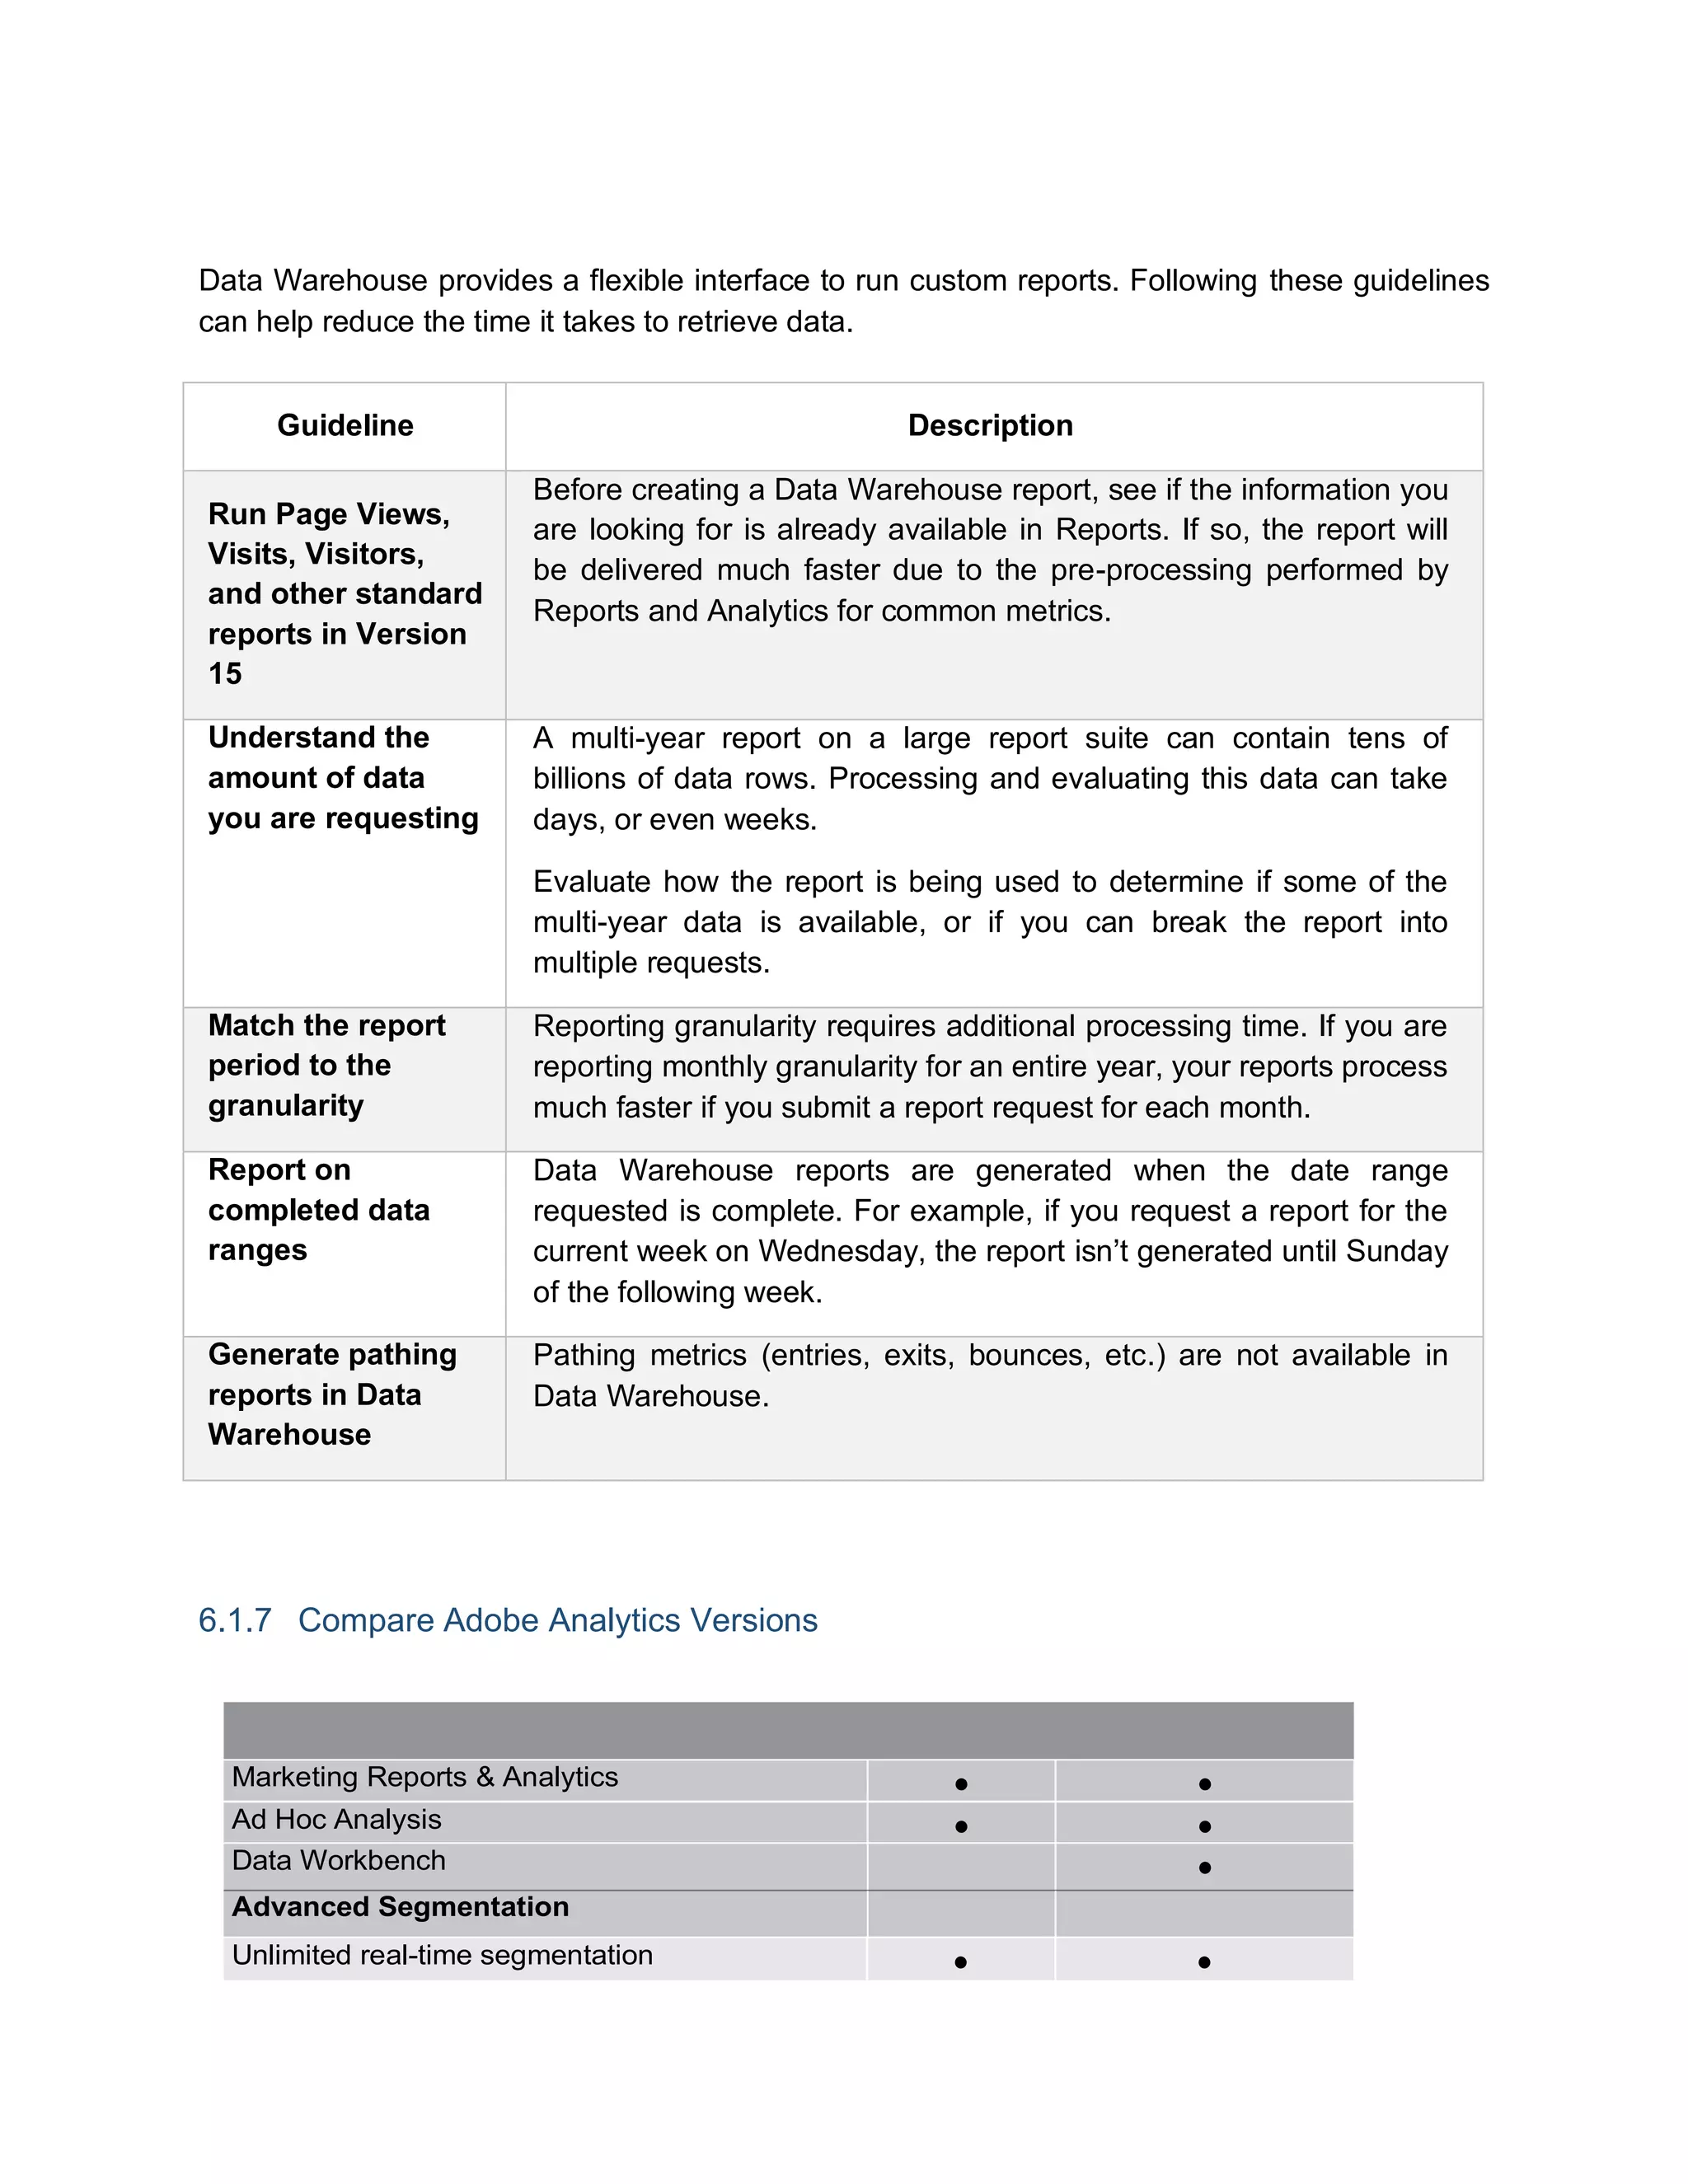
6.1.7 Compare Adobe Analytics Versions.......................................................................................... 105
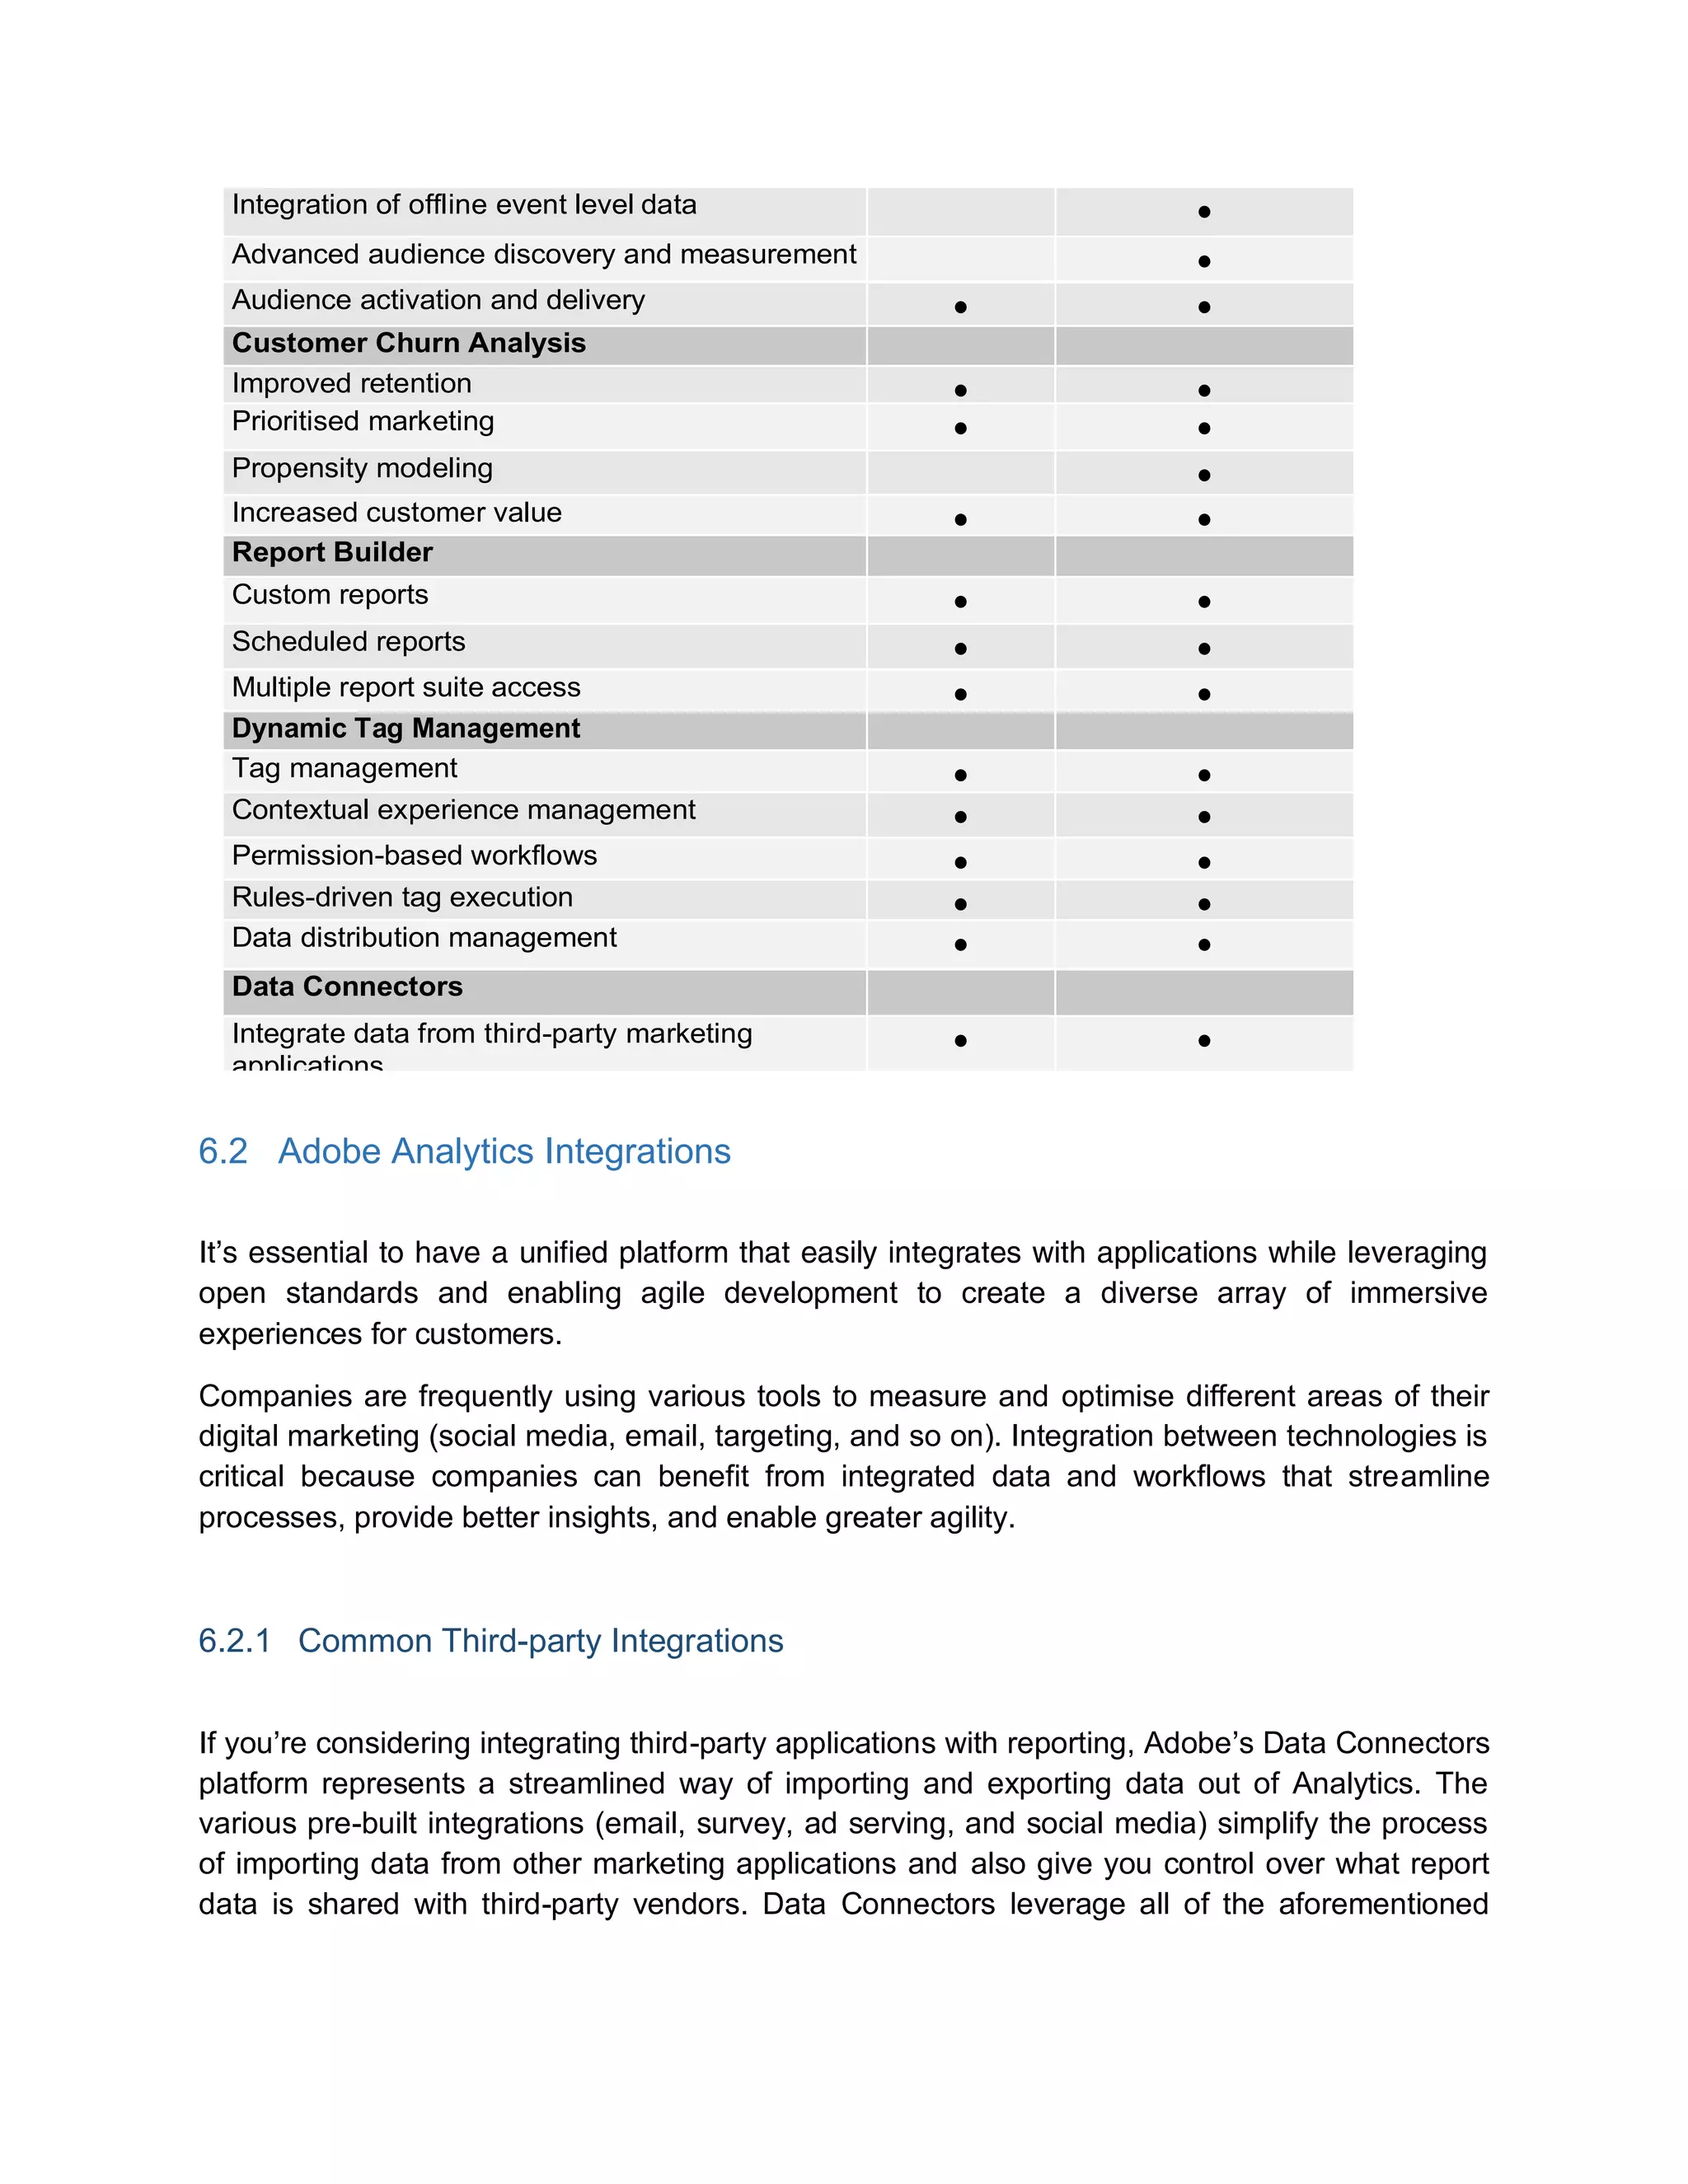
6.2 Adobe Analytics Integrations ......................................................................................................... 107
6.2.1 Common Third-party Integrations.............................................................................................. 107
6.2.2 Marketing Cloud Integrations..................................................................................................... 111
6.3 Validation, Optimisation and Security........................................................................................... 112
1 Introduction
1.1 AboutAdobe Analytics
Adobe Analytics enables marketers and analysts to tell the story of what’s happening in their
business by leveraging high-performance, real-time analytics across marketing channels.
Marketers can take advantage of the information that flows through Adobe Analytics to
continuously improve the performance of their digital marketing experiences.
This solution delivers the analytics and reporting capabilities needed to enable data-driven
decision-making. It provides the insight critical to optimising marketing efforts, such as
personalising experiences, driving better ad spend, and monetising content and campaigns.
Each measureable action that a customer or prospect takes while interacting with your brand
represents an opportunity to:
• Align digital-marketing initiatives with key business objectives;
• Gain real-time insights into customer behaviour across marketing channels;
• Find hidden patterns and behaviours in large amounts of data;
• Leverage insights to deliver relevant online consumer experiences that drive conversion.
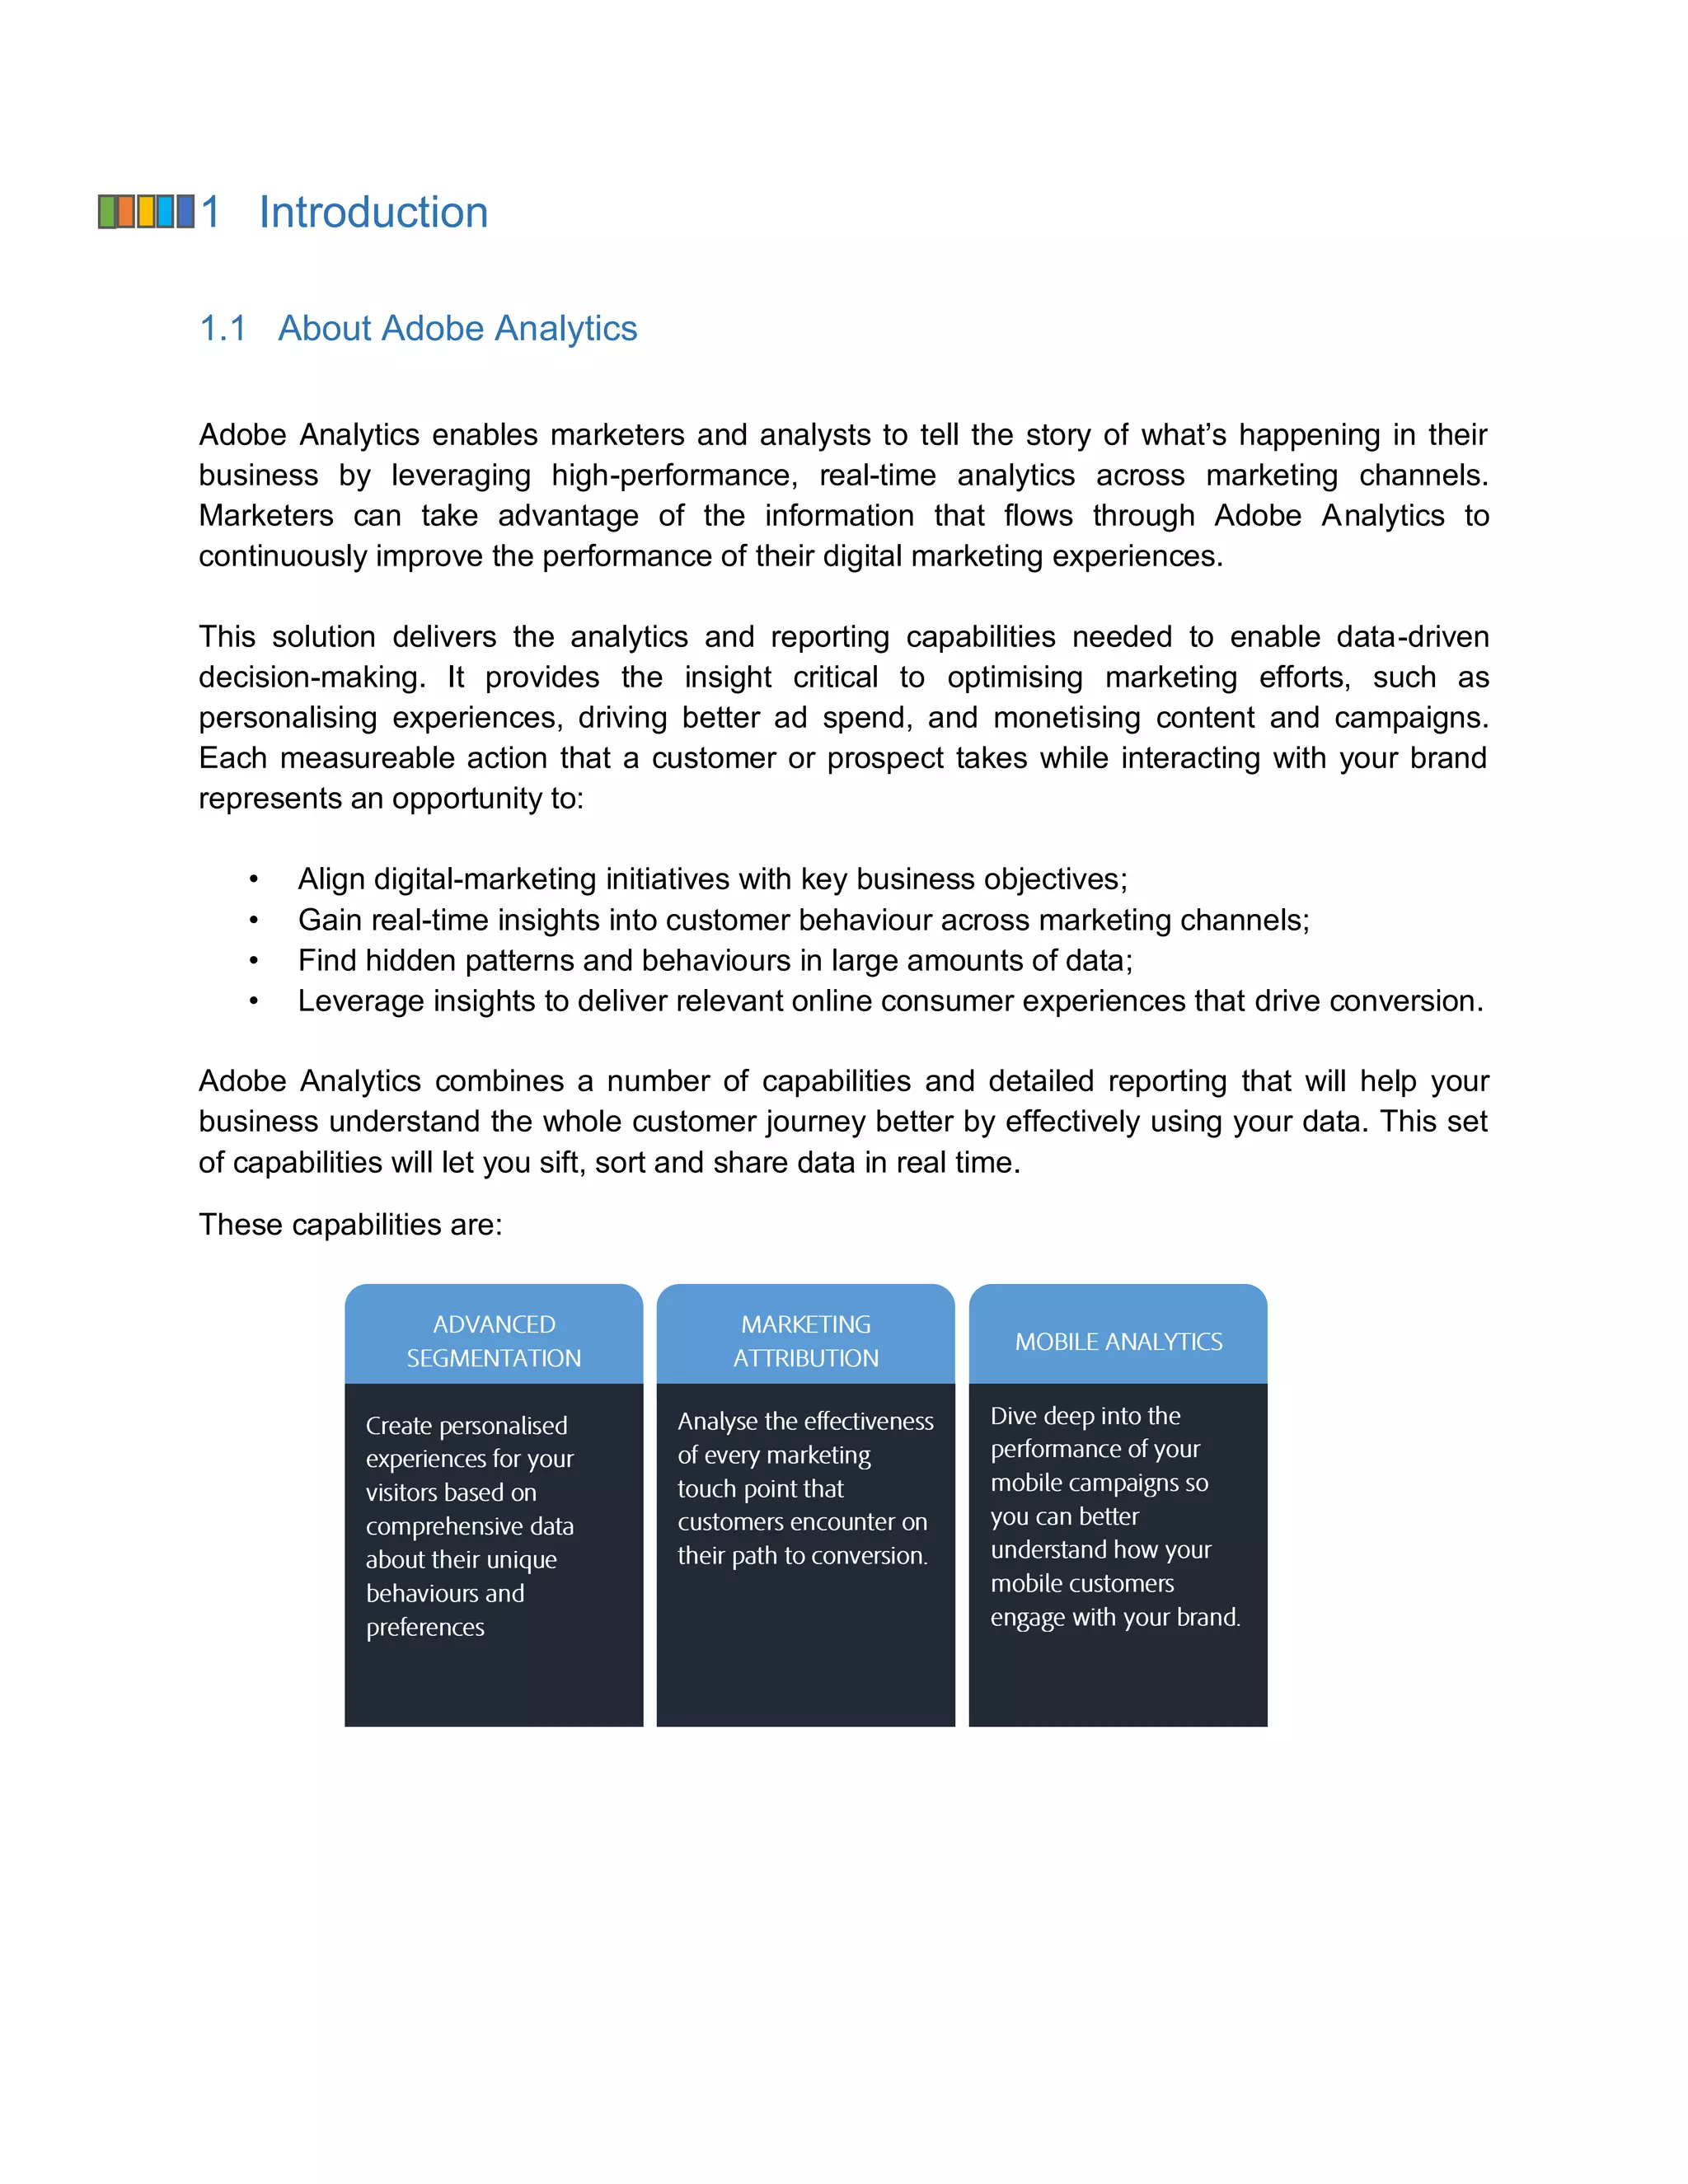
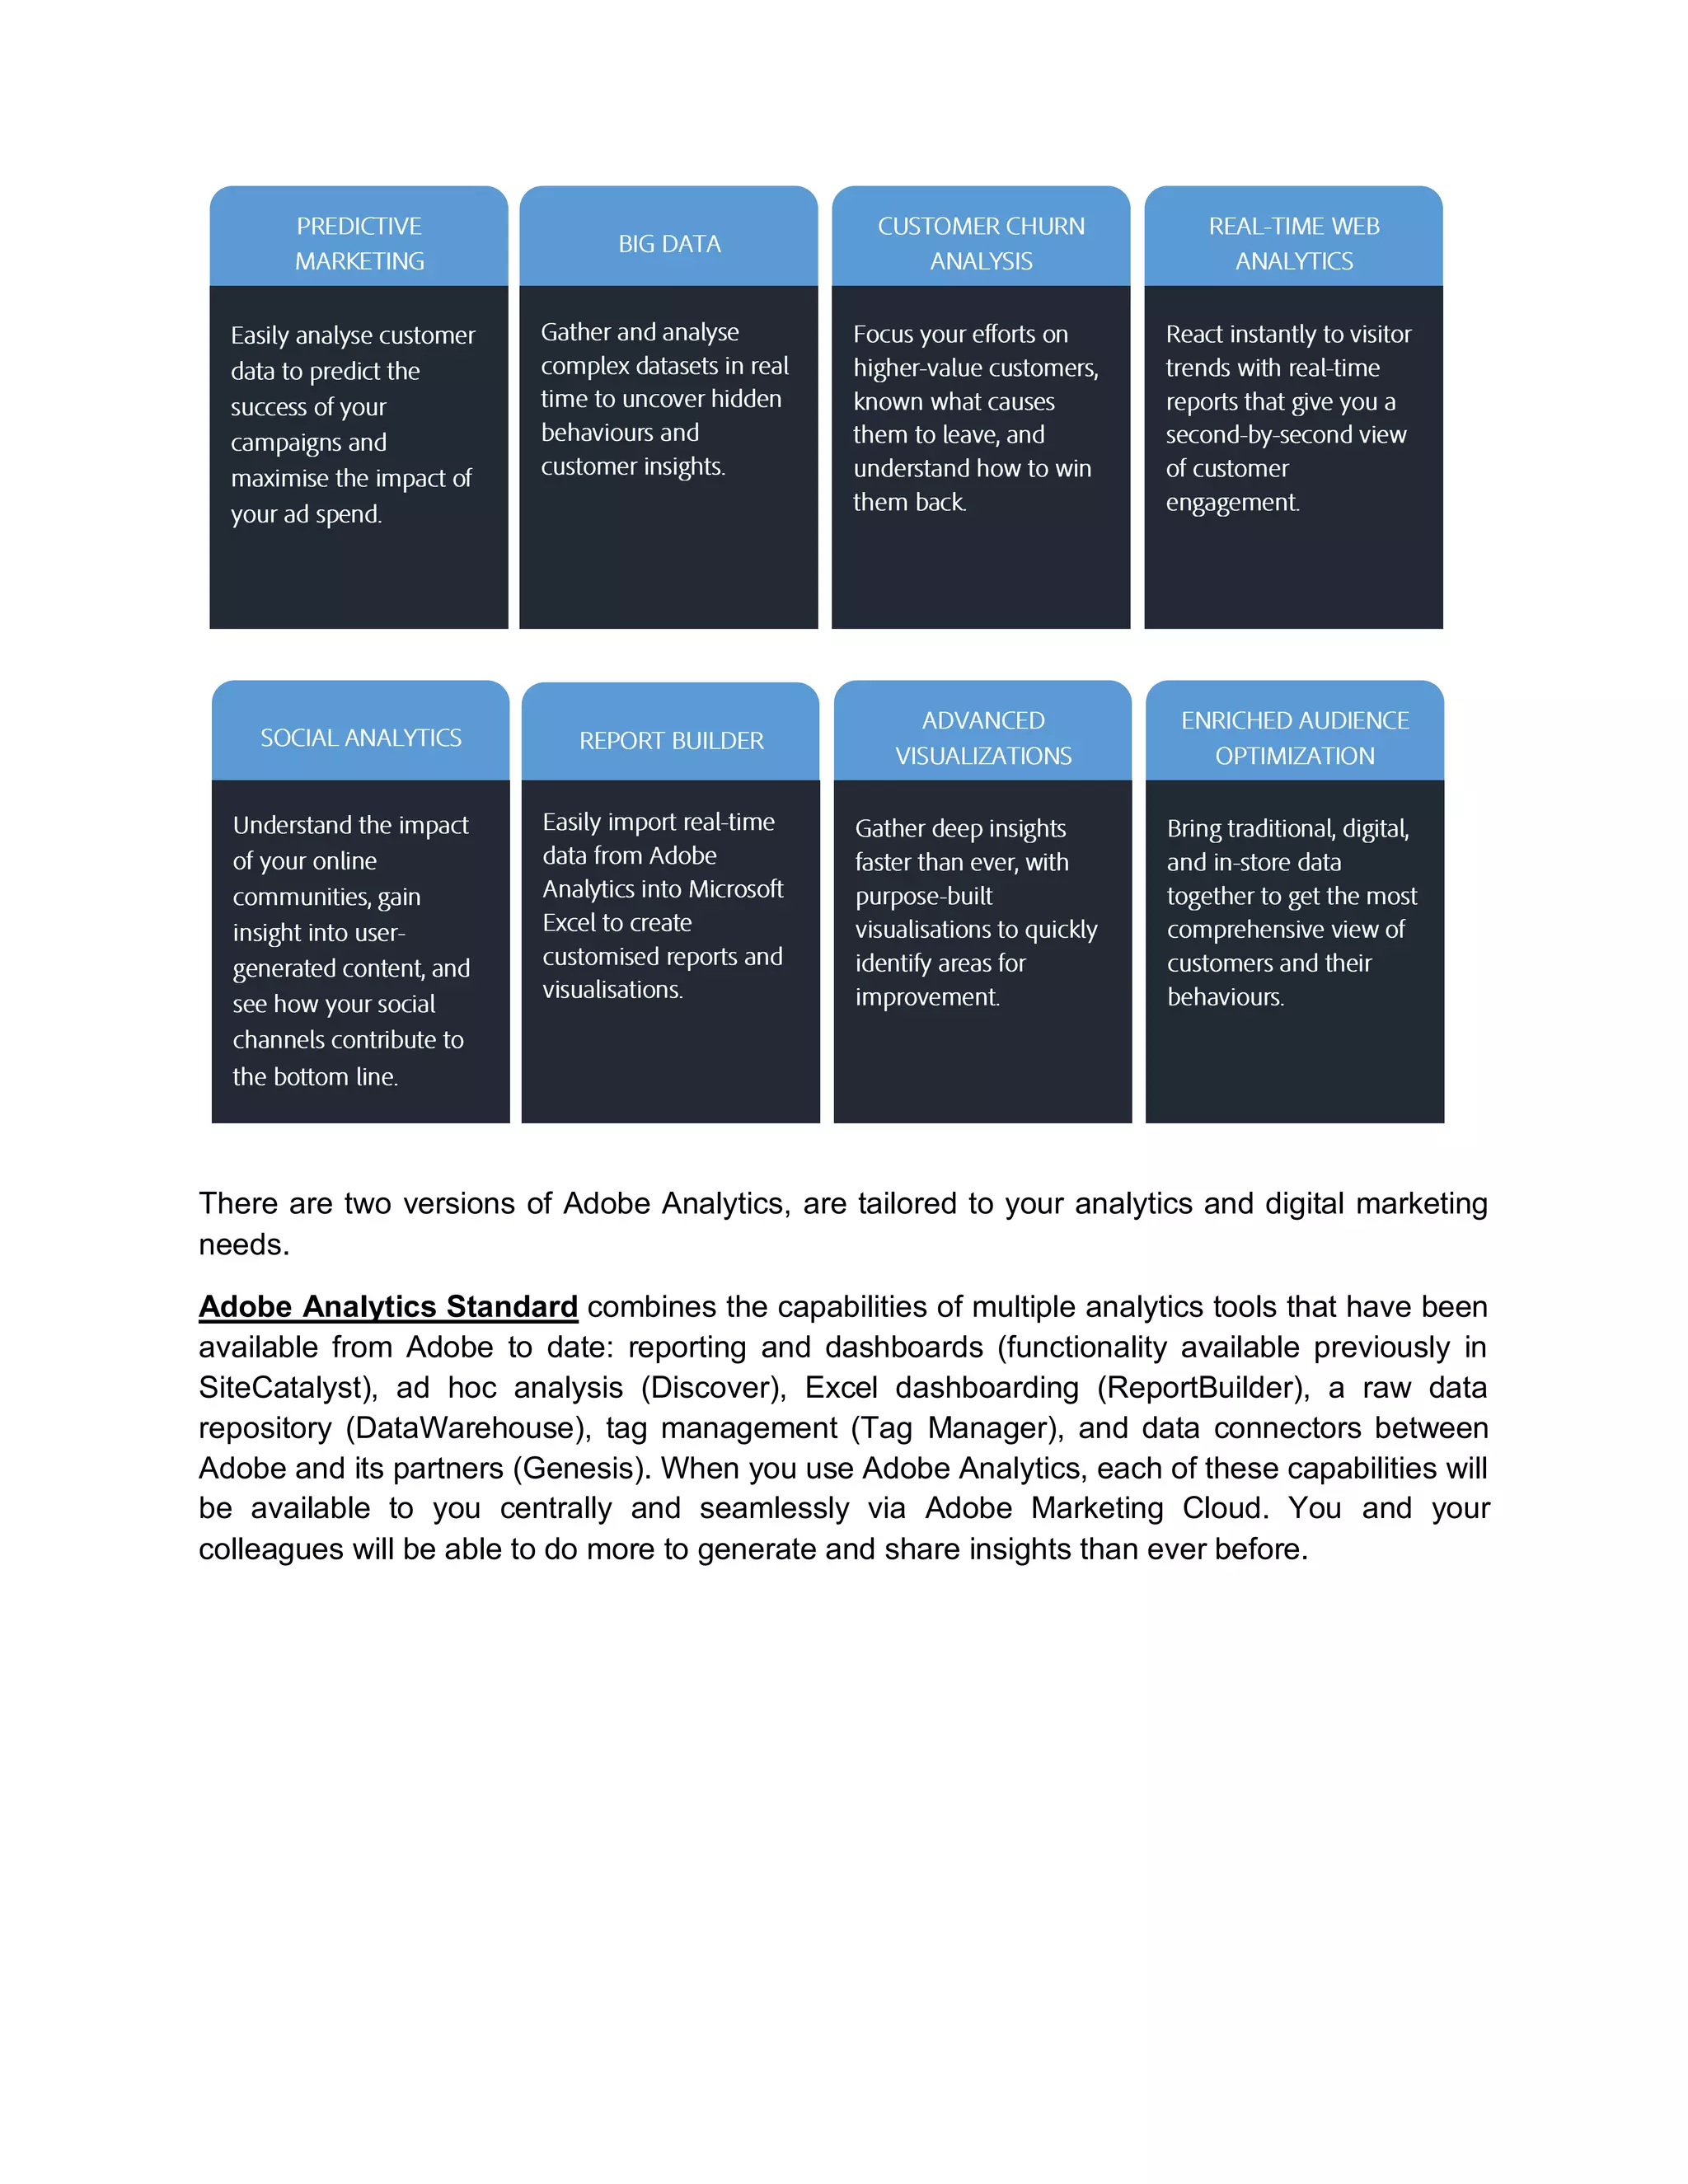
Adobe Analytics combines a number of capabilities and detailed reporting that will help your
business understand the whole customer journey better by effectively using your data. This set
of capabilities will let you sift, sort and share data in real time.
These capabilities are:
7.
There are twoversions of Adobe Analytics, are tailored to your analytics and digital marketing
needs.
Adobe Analytics Standard combines the capabilities of multiple analytics tools that have been
available from Adobe to date: reporting and dashboards (functionality available previously in
SiteCatalyst), ad hoc analysis (Discover), Excel dashboarding (ReportBuilder), a raw data
repository (DataWarehouse), tag management (Tag Manager), and data connectors between
Adobe and its partners (Genesis). When you use Adobe Analytics, each of these capabilities will
be available to you centrally and seamlessly via Adobe Marketing Cloud. You and your
colleagues will be able to do more to generate and share insights than ever before.
8.
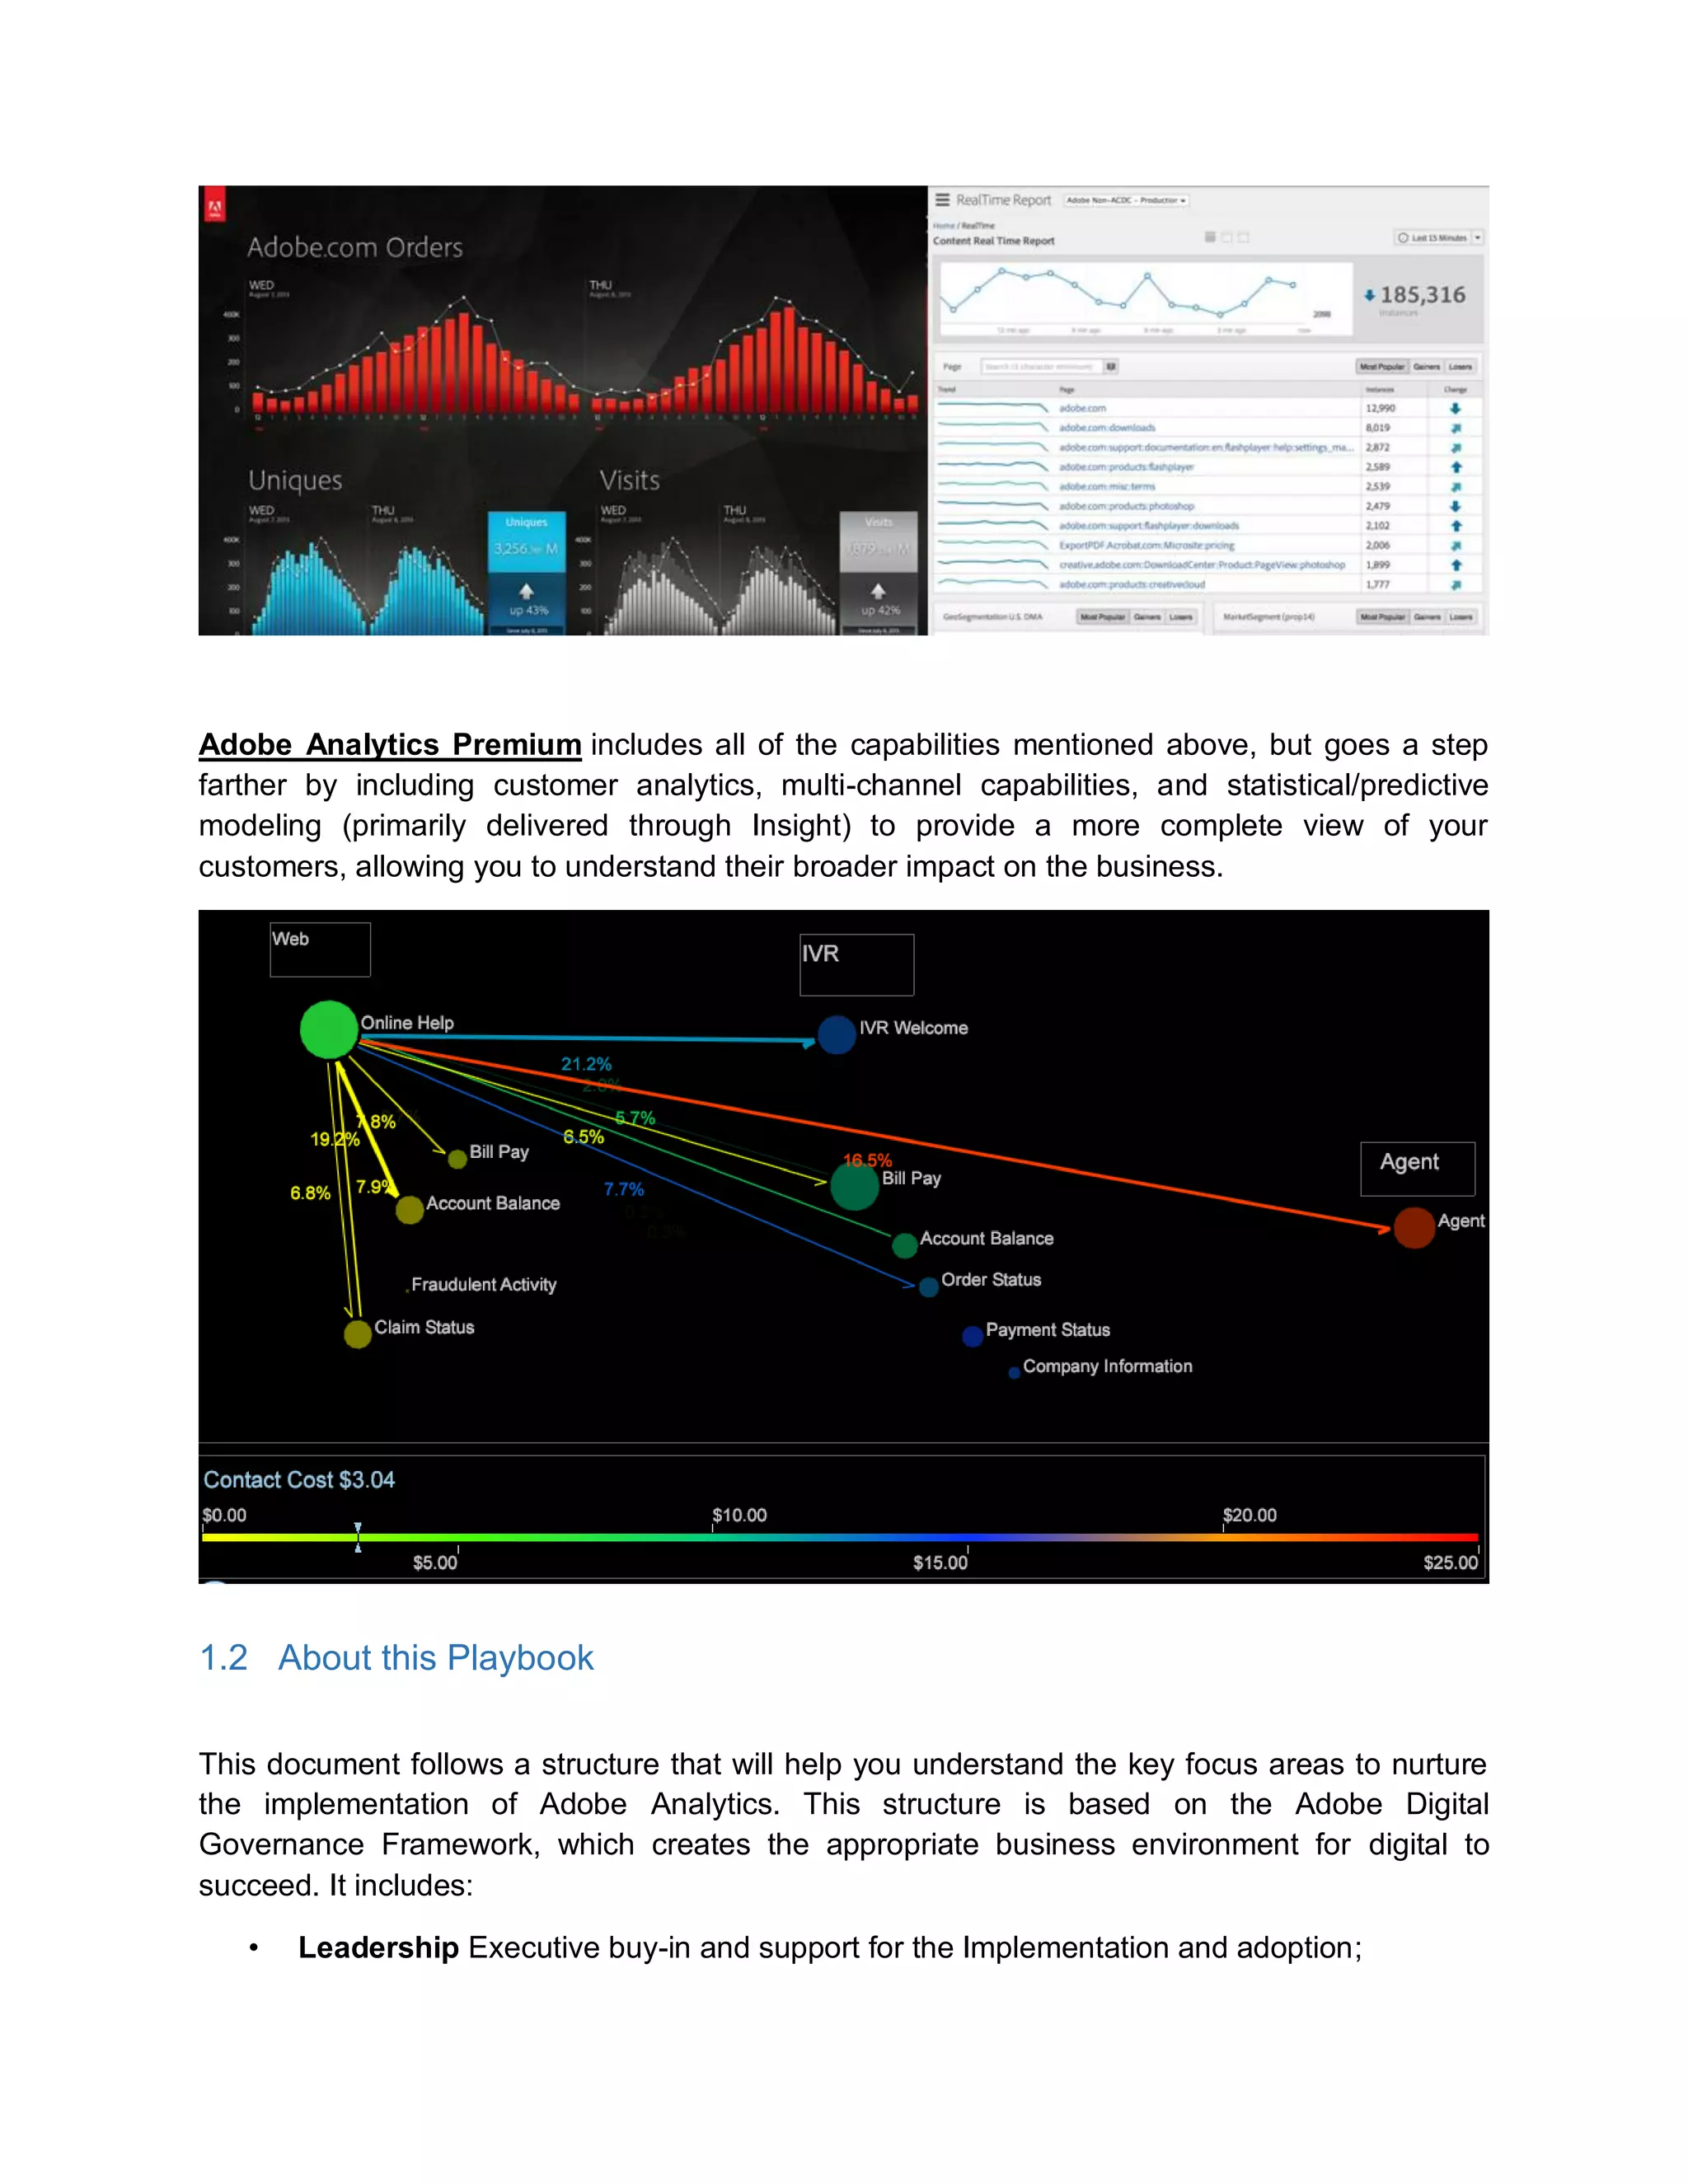
Adobe Analytics Premiumincludes all of the capabilities mentioned above, but goes a step
farther by including customer analytics, multi-channel capabilities, and statistical/predictive
modeling (primarily delivered through Insight) to provide a more complete view of your
customers, allowing you to understand their broader impact on the business.
1.2 About this Playbook
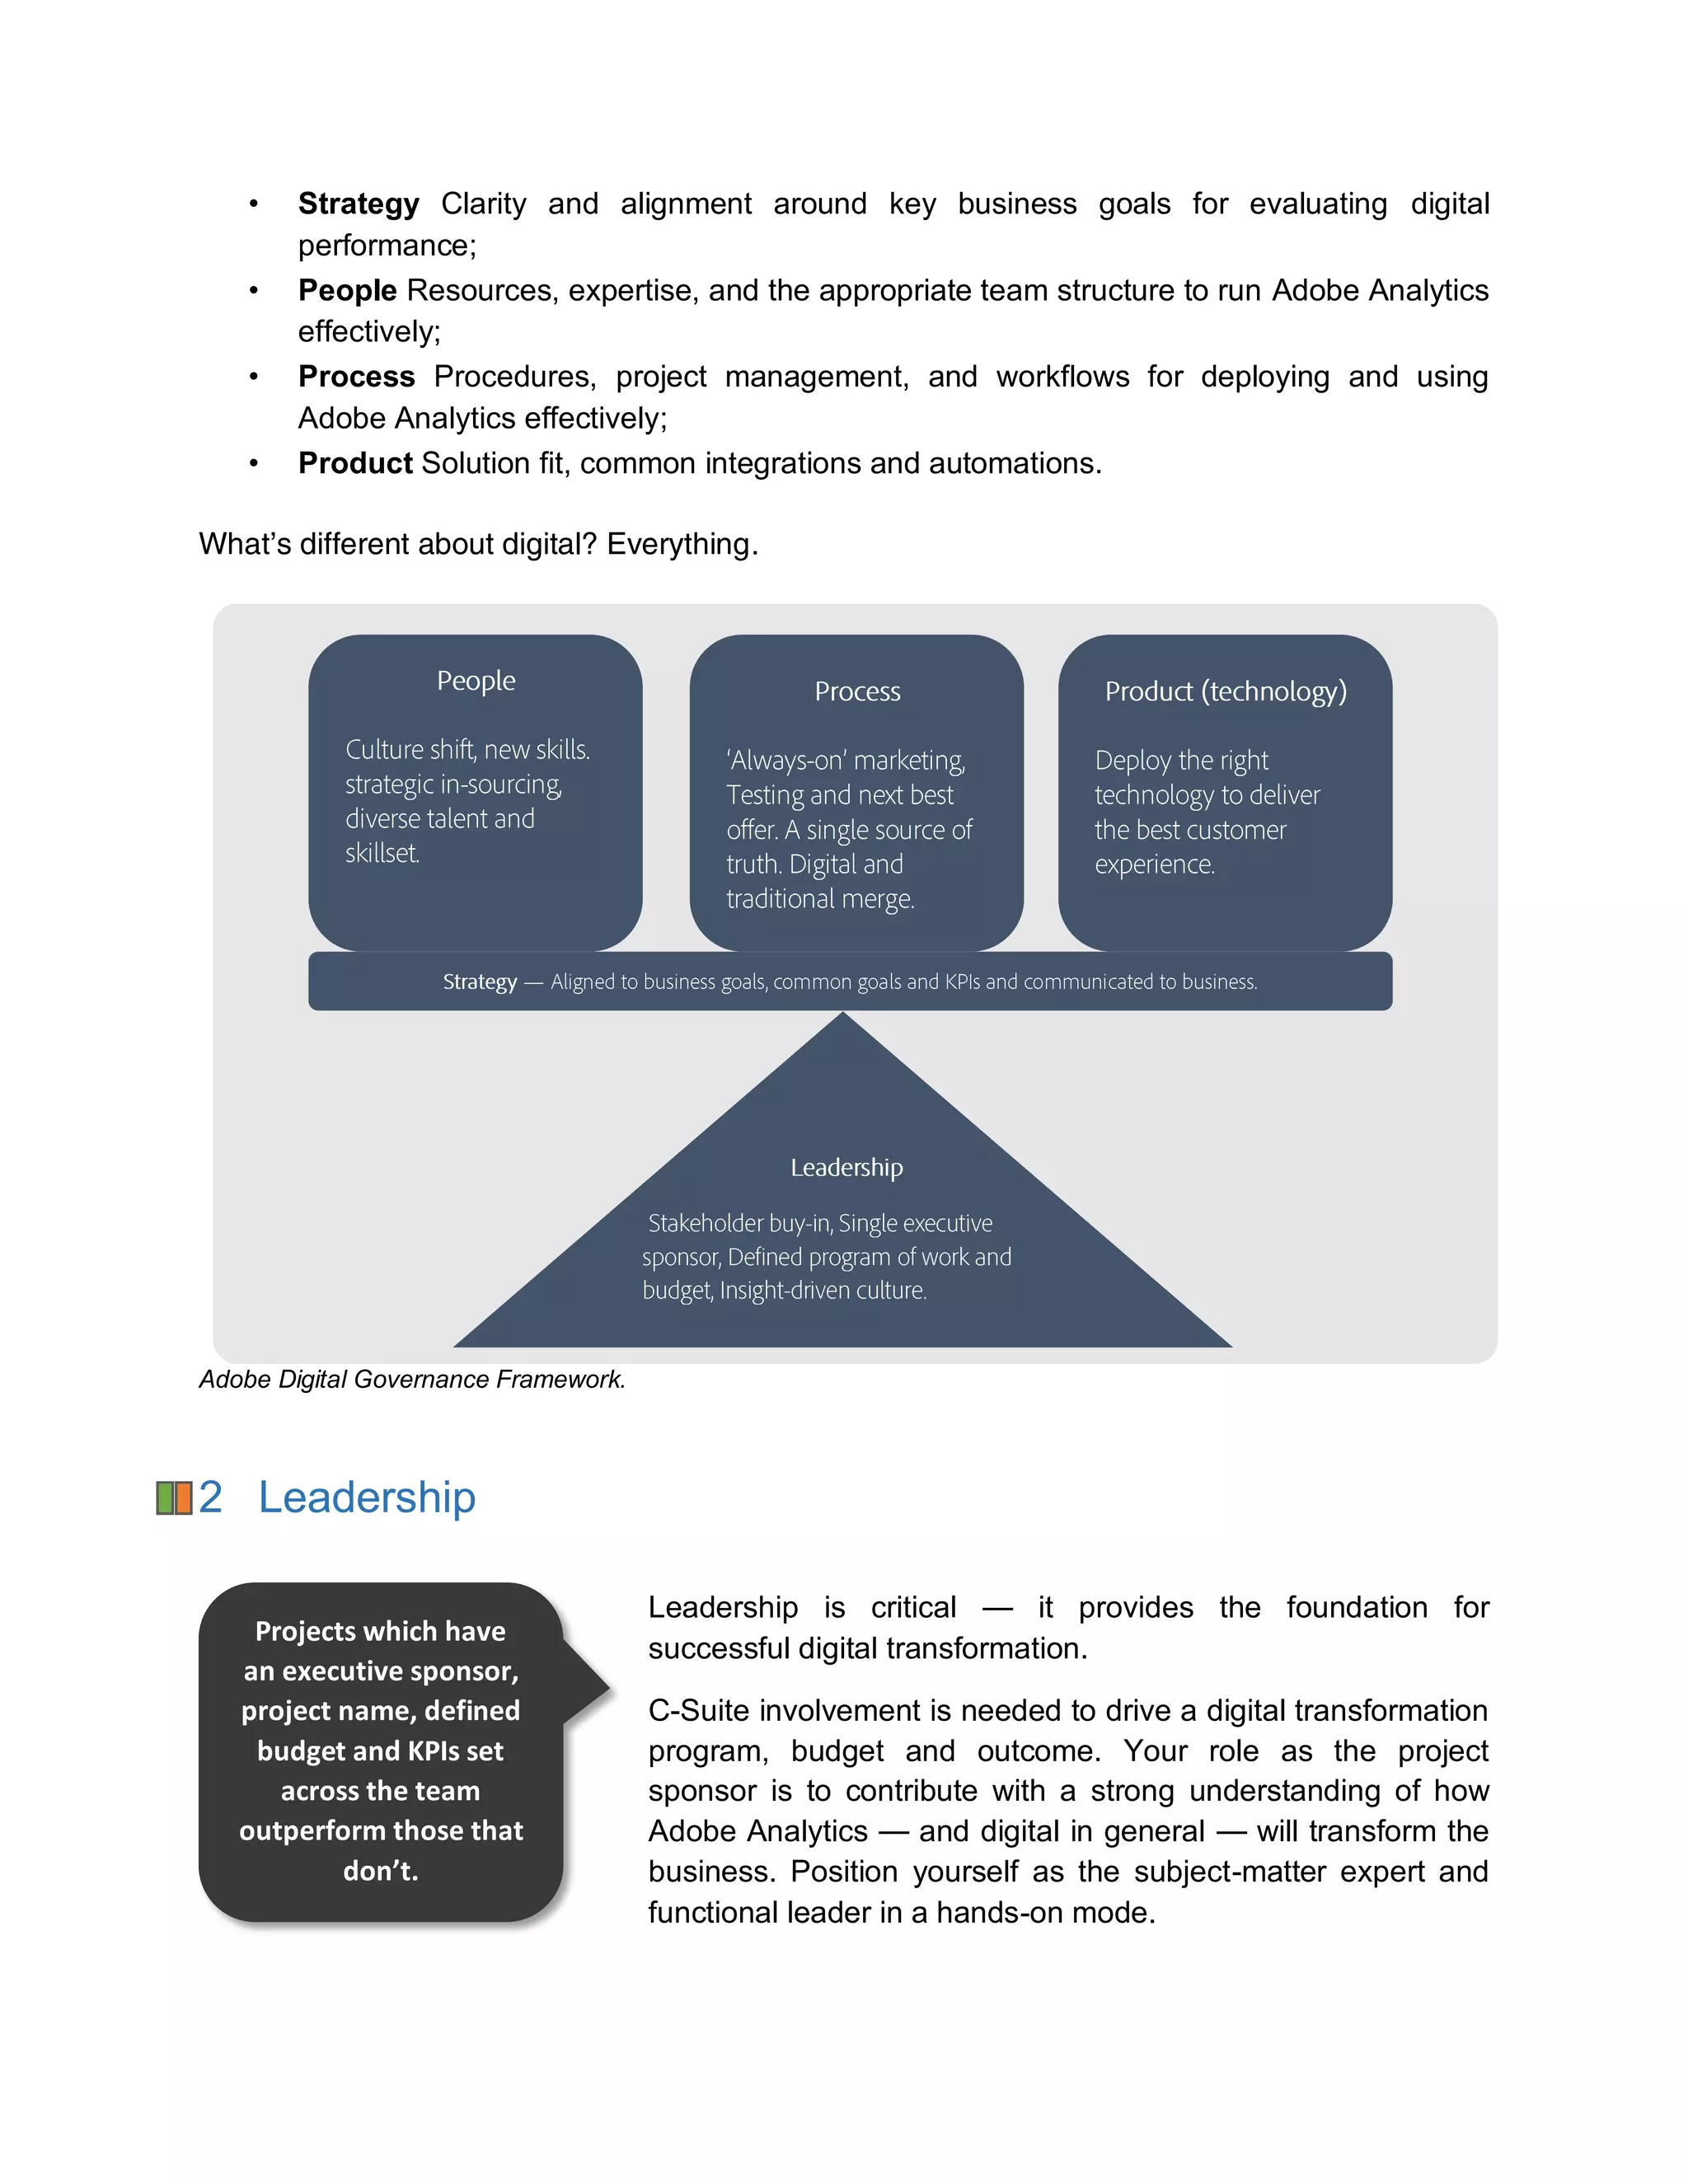
This document follows a structure that will help you understand the key focus areas to nurture
the implementation of Adobe Analytics. This structure is based on the Adobe Digital
Governance Framework, which creates the appropriate business environment for digital to
succeed. It includes:
• Leadership Executive buy-in and support for the Implementation and adoption;
9.
• Strategy Clarityand alignment around key business goals for evaluating digital
performance;
• People Resources, expertise, and the appropriate team structure to run Adobe Analytics
effectively;
• Process Procedures, project management, and workflows for deploying and using
Adobe Analytics effectively;
• Product Solution fit, common integrations and automations.
What’s different about digital? Everything.
Adobe Digital Governance Framework.
2 Leadership
Leadership is critical — it provides the foundation for
successful digital transformation.
C-Suite involvement is needed to drive a digital transformation
program, budget and outcome. Your role as the project
sponsor is to contribute with a strong understanding of how
Adobe Analytics — and digital in general — will transform the
business. Position yourself as the subject-matter expert and
functional leader in a hands-on mode.
Projects which have
an executive sponsor,
project name, defined
budget and KPIs set
across the team
outperform those that
don’t.
10.
A common traityou will find in successful digital teams is that they are owned and managed by
people who are prepared to make the necessary investments in talent, equipment and training.
Leaders are skilled at extracting optimal performance from team members and developing
strategies that take full advantage of their unique talents.
Leadership consists of four subcomponents: sponsorship, buy-in, communication, and
accountability.
2.1 Sponsorship
Having an effective executive sponsor will help the project achieve maximum success. To be
truly effective, this internal executive sponsor should have enough seniority and influence within
the business to have buy-in from other stakeholders across the organisation. Having a high
level of self-interest in the project success and a passion for digital transformation — and truly
believing in how Adobe Analytics is going to transform the business — are also critical.
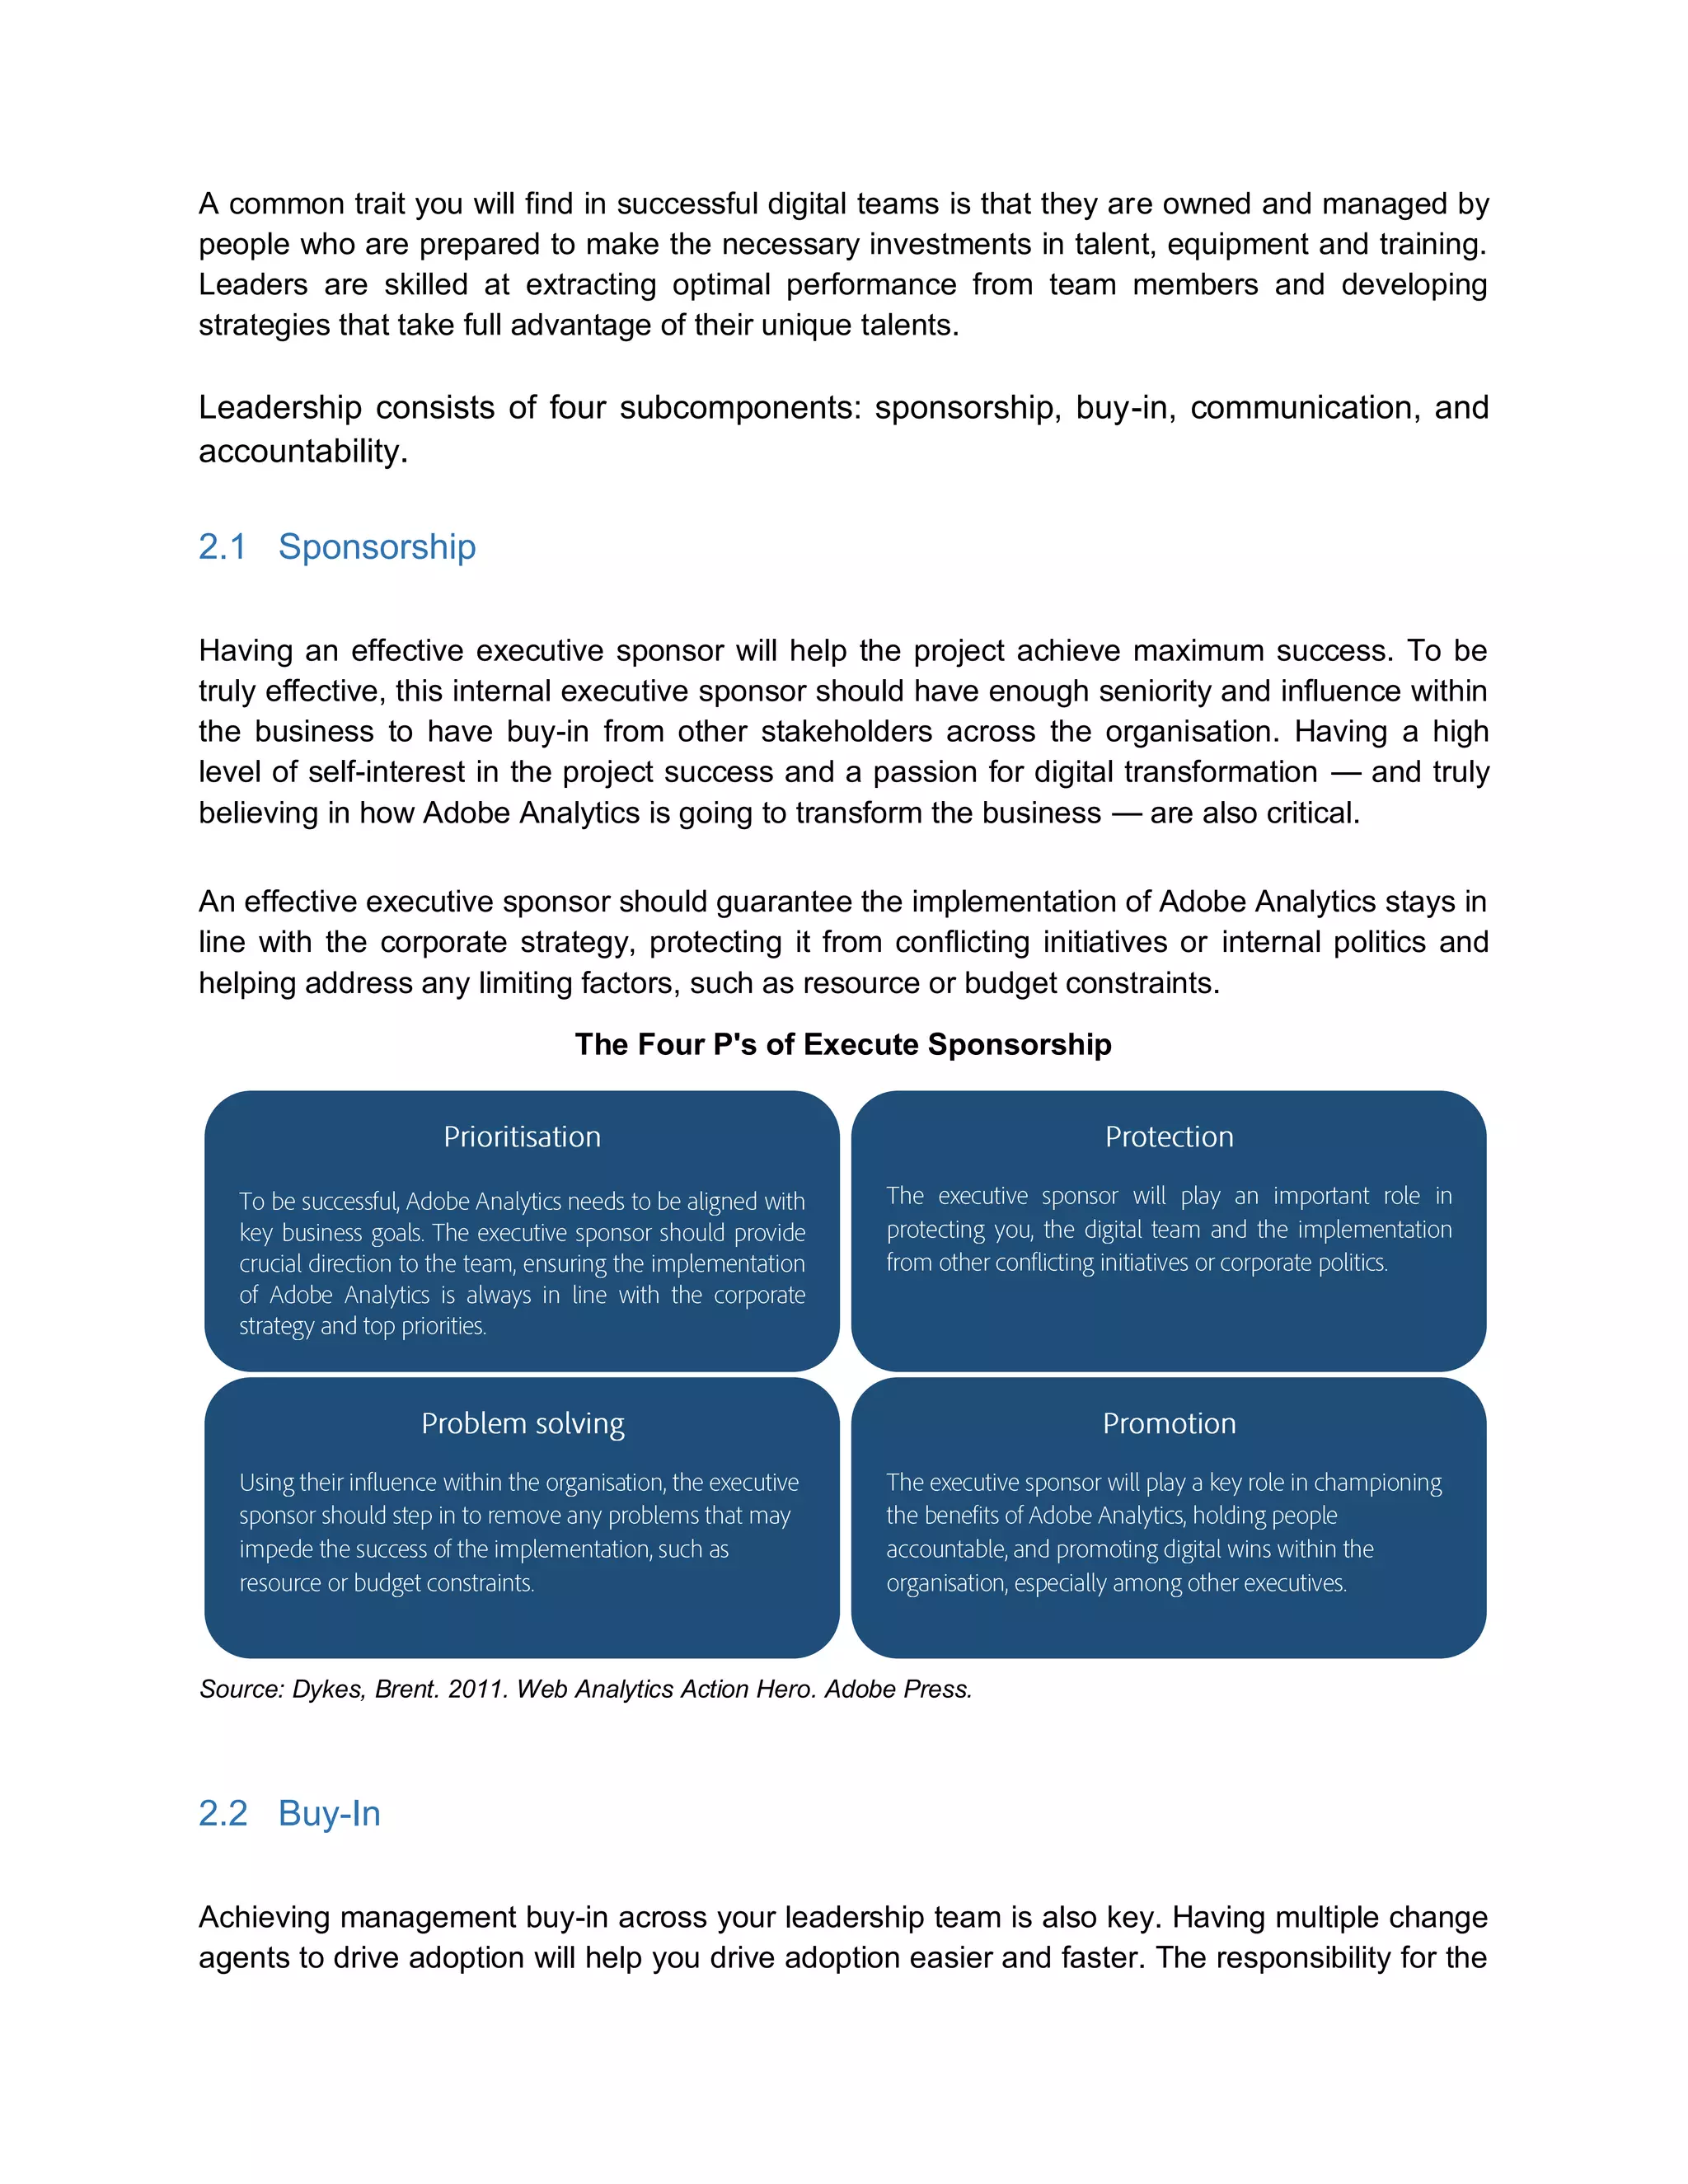
An effective executive sponsor should guarantee the implementation of Adobe Analytics stays in
line with the corporate strategy, protecting it from conflicting initiatives or internal politics and
helping address any limiting factors, such as resource or budget constraints.
The Four P's of Execute Sponsorship
Source: Dykes, Brent. 2011. Web Analytics Action Hero. Adobe Press.
2.2 Buy-In
Achieving management buy-in across your leadership team is also key. Having multiple change
agents to drive adoption will help you drive adoption easier and faster. The responsibility for the
11.
implementation and deploymentof Adobe Analytics needs to be shared by the entire leadership
team.
It is then the executive sponsor’s responsibility to win over the executive team by sharing
examples that prove the value of Adobe Analytics and digital. Typically this focuses on
delivering a better customer experience and subsequent benefits to the business.
When implementing digital projects such as Adobe Analytics, leaders will be responsible for
monitoring different departments and teams owning different
parts of the digital marketing initiatives. It is critical then to
make sure that all groups share a common strategy to
achieve common goals. Having an internal roadshow to win
support from executives will help raise awareness towards
aligning all teams and obtaining the necessary resources for
an optimal implementation.
2.3 Communication
To get the organisation on board, it is always a good idea to share the vision and repeatedly
reinforce the reason why your company is investing in Adobe Analytics technology by
articulating both the customer benefits and business benefits. Sharing documentation such as
success case studies of digital implementations will help you validate why and how this
investment will take the organisation to a new level. If you want the organisation to embrace
digital transformation, it’s important to let employees know it is a priority.
2.3.1 Communication Management
A communication strategy can lay out the foundation and framework for communicating
initiatives and objectives across business and technology teams. It can also help by:
• Providing guidance and framework for effective communication within and outside of the
project;
• Ensuring that proper protocols are always followed when preparing and delivering
communication;
• Providing precise and concise project communication at the right time;
• Involving all necessary stakeholders and maintaining regular contact to keep
transparency in all transactions;
• Having clear communication channels with well-defined roles and responsibilities;
• Clarifying doubts, overcoming challenges and averting risks that affect the project;
• Building trust and developing open relationships between the parties;
• Promoting openness and transparency.
Having cross-function
stakeholder
participation in the
vision elicits
stakeholder buy-in
12.
2.3.2 Recommended CommunicationProcess and Principles
You can build your communication strategy around the following key principles:
• Communication is critical to effect change. Ongoing and timely communication is a
fundamental requirement to inform and respond to stakeholders about the change, its
impact on them and its outcomes; to enable feedback; to manage expectations; to
ensure a smooth change transition; and to support uptake and continual improvement.
• Communication delivery is local. Communication from the local area will mean that
messages are relayed in a language that is relevant to the audience. Engagement with
local communicators across the business and technology will increase the effectiveness
of the communication.
• Communication is consistent and repetitive. With a common approach across the
program, stakeholders will come to expect communication through specific methods
(channels), with given formats (look) and timing. Repeating key messages through
multiple channels will increase the amount of information that is absorbed.
• Communication is linked to the project objectives. Linking the communication to the
objectives provides a context and reasoning behind change. Repeatedly providing these
links will serve as reminders as to the wider benefits of the project.
2.3.3 Setting Communication Goals
All communication developed and distributed throughout the project is intended to achieve the
following goals:
• Stakeholders and project team members are aware and informed;
o Stakeholders and project team members should receive timely information about
what is happening (why, when and how, and what it means to them). This
information starts at a generic level (and is repeated throughout the project
lifecycle), and becomes more detailed, specific and targeted to the audience and
as the project progresses. This enables stakeholders to think about, understand,
and be prepared for change and plan for future project-related work.
• Stakeholders and project team members are engaged;
o Opportunities are created and communicated to key stakeholders to support
them in exploring and becoming involved in and committing to a new way of
doing things;
Different stakeholders and project team members will move through and
transition at different rates/times;
13.
Communication willaim to gain key stakeholders’ and project team
members’ commitment by implementation;
Strategies and implementation roadmaps can be developed to manage
stakeholders and project team members who are resistant to the change
throughout the transition.
o Communication is two-way, with stakeholder input and feedback sought and
valued at all stages;
o Stakeholders and project team members expectations are managed;
The aim of communication is to provide set expectations of strategic
initiatives, program/project scope, associated constraints, risks and
dependencies. Explain why this may differ from expectations (in targeted
messages), and to provide ongoing updates on expected and actual
outcomes.
o Support the acquisition of skills and knowledge. Training is backed up by
supporting communication to reinforce training and provide opportunities to share
knowledge.
2.3.4 Recommendations on a Communication Approach
An approach to communication management for the project may include:
o Conduct an effective stakeholder analysis;
Stakeholder analysis is developed at the Project Board, User Group,
Project Team and Stakeholder levels.
The Stakeholder Analysis will focus on all parties (users, management,
executives or third parties) required to achieve the desired outcomes and
any parties impacted by the change to ensure full coverage.
Categorise stakeholders into specific audiences (communication
channels).
o Identify information requirements of all parties and establish distribution lists by
subject area;
Have regular meetings. There should be regular meetings organised with
various levels within the project to ensure that there is regular
communication.
(Use sparingly) Where project team meetings do not meet communication
requirements (for example, where cross-area representation is required
for specific project deliverables):
14.
One-on-one meetingsmay be required to obtain specific input
and/or deliver important messages (as required).
A common wiki or alternate online knowledge management solution to
provide access to all parties and used by some to provide a workspace.
A shared drive to maintain the main reference point for overview of the
project with links to documentation for wide dissemination and feedback.
Electronic newsletter or company-wide communications, providing regular
project news (updates, upcoming events, outcomes) delivered by email.
E-mail may be used for targeted, individual or group communication —
with a specific purpose.
Standard templates for communicating regular information such as
project status reports, meeting minutes, and reports should be used to
ensure communication is consistent and repeatable.
o Track required message delivery.
Accountability
Your organisation is investing in Adobe Analytics and top
executives are expecting results. For this to happen, it is the
leader’s and senior stakeholders’ jobs to hold themselves and
their people accountable — employees, teams, partners, and
most importantly him or herself. Start with changing the
perception that accountability is about punishment and hard
discipline — it should really be about learning and improvement.
To define accountability, you can create a project charter (PC).
This document states that a project exists, why it is important,
who is involved, its timeframes, the expected outcomes, and
the resources needed for it to be successful. It also gives you
written authority to begin work.
2.3.5 Steering Committee
Use a DACI model to
categorise
stakeholders and their
communication needs
Think about how your
team’s bonuses are
measured and if they
are being
compensated
appropriately for
project success.
15.
Setting up agroup of high-level stakeholders and/or experts will help you achieving the four
subcomponents of leadership and at the same time set direction to the project. This Steering
Committee can also help by:
• Prioritising initiatives;
• Reviewing business cases for new initiatives;
• Lobbying for the necessary time, personnel and budget;
• Ensuring quality in decision-making;
• Encouraging a collaborative work environment;
• Monitoring progress towards goals;
• Controlling scope and resolving conflicts.
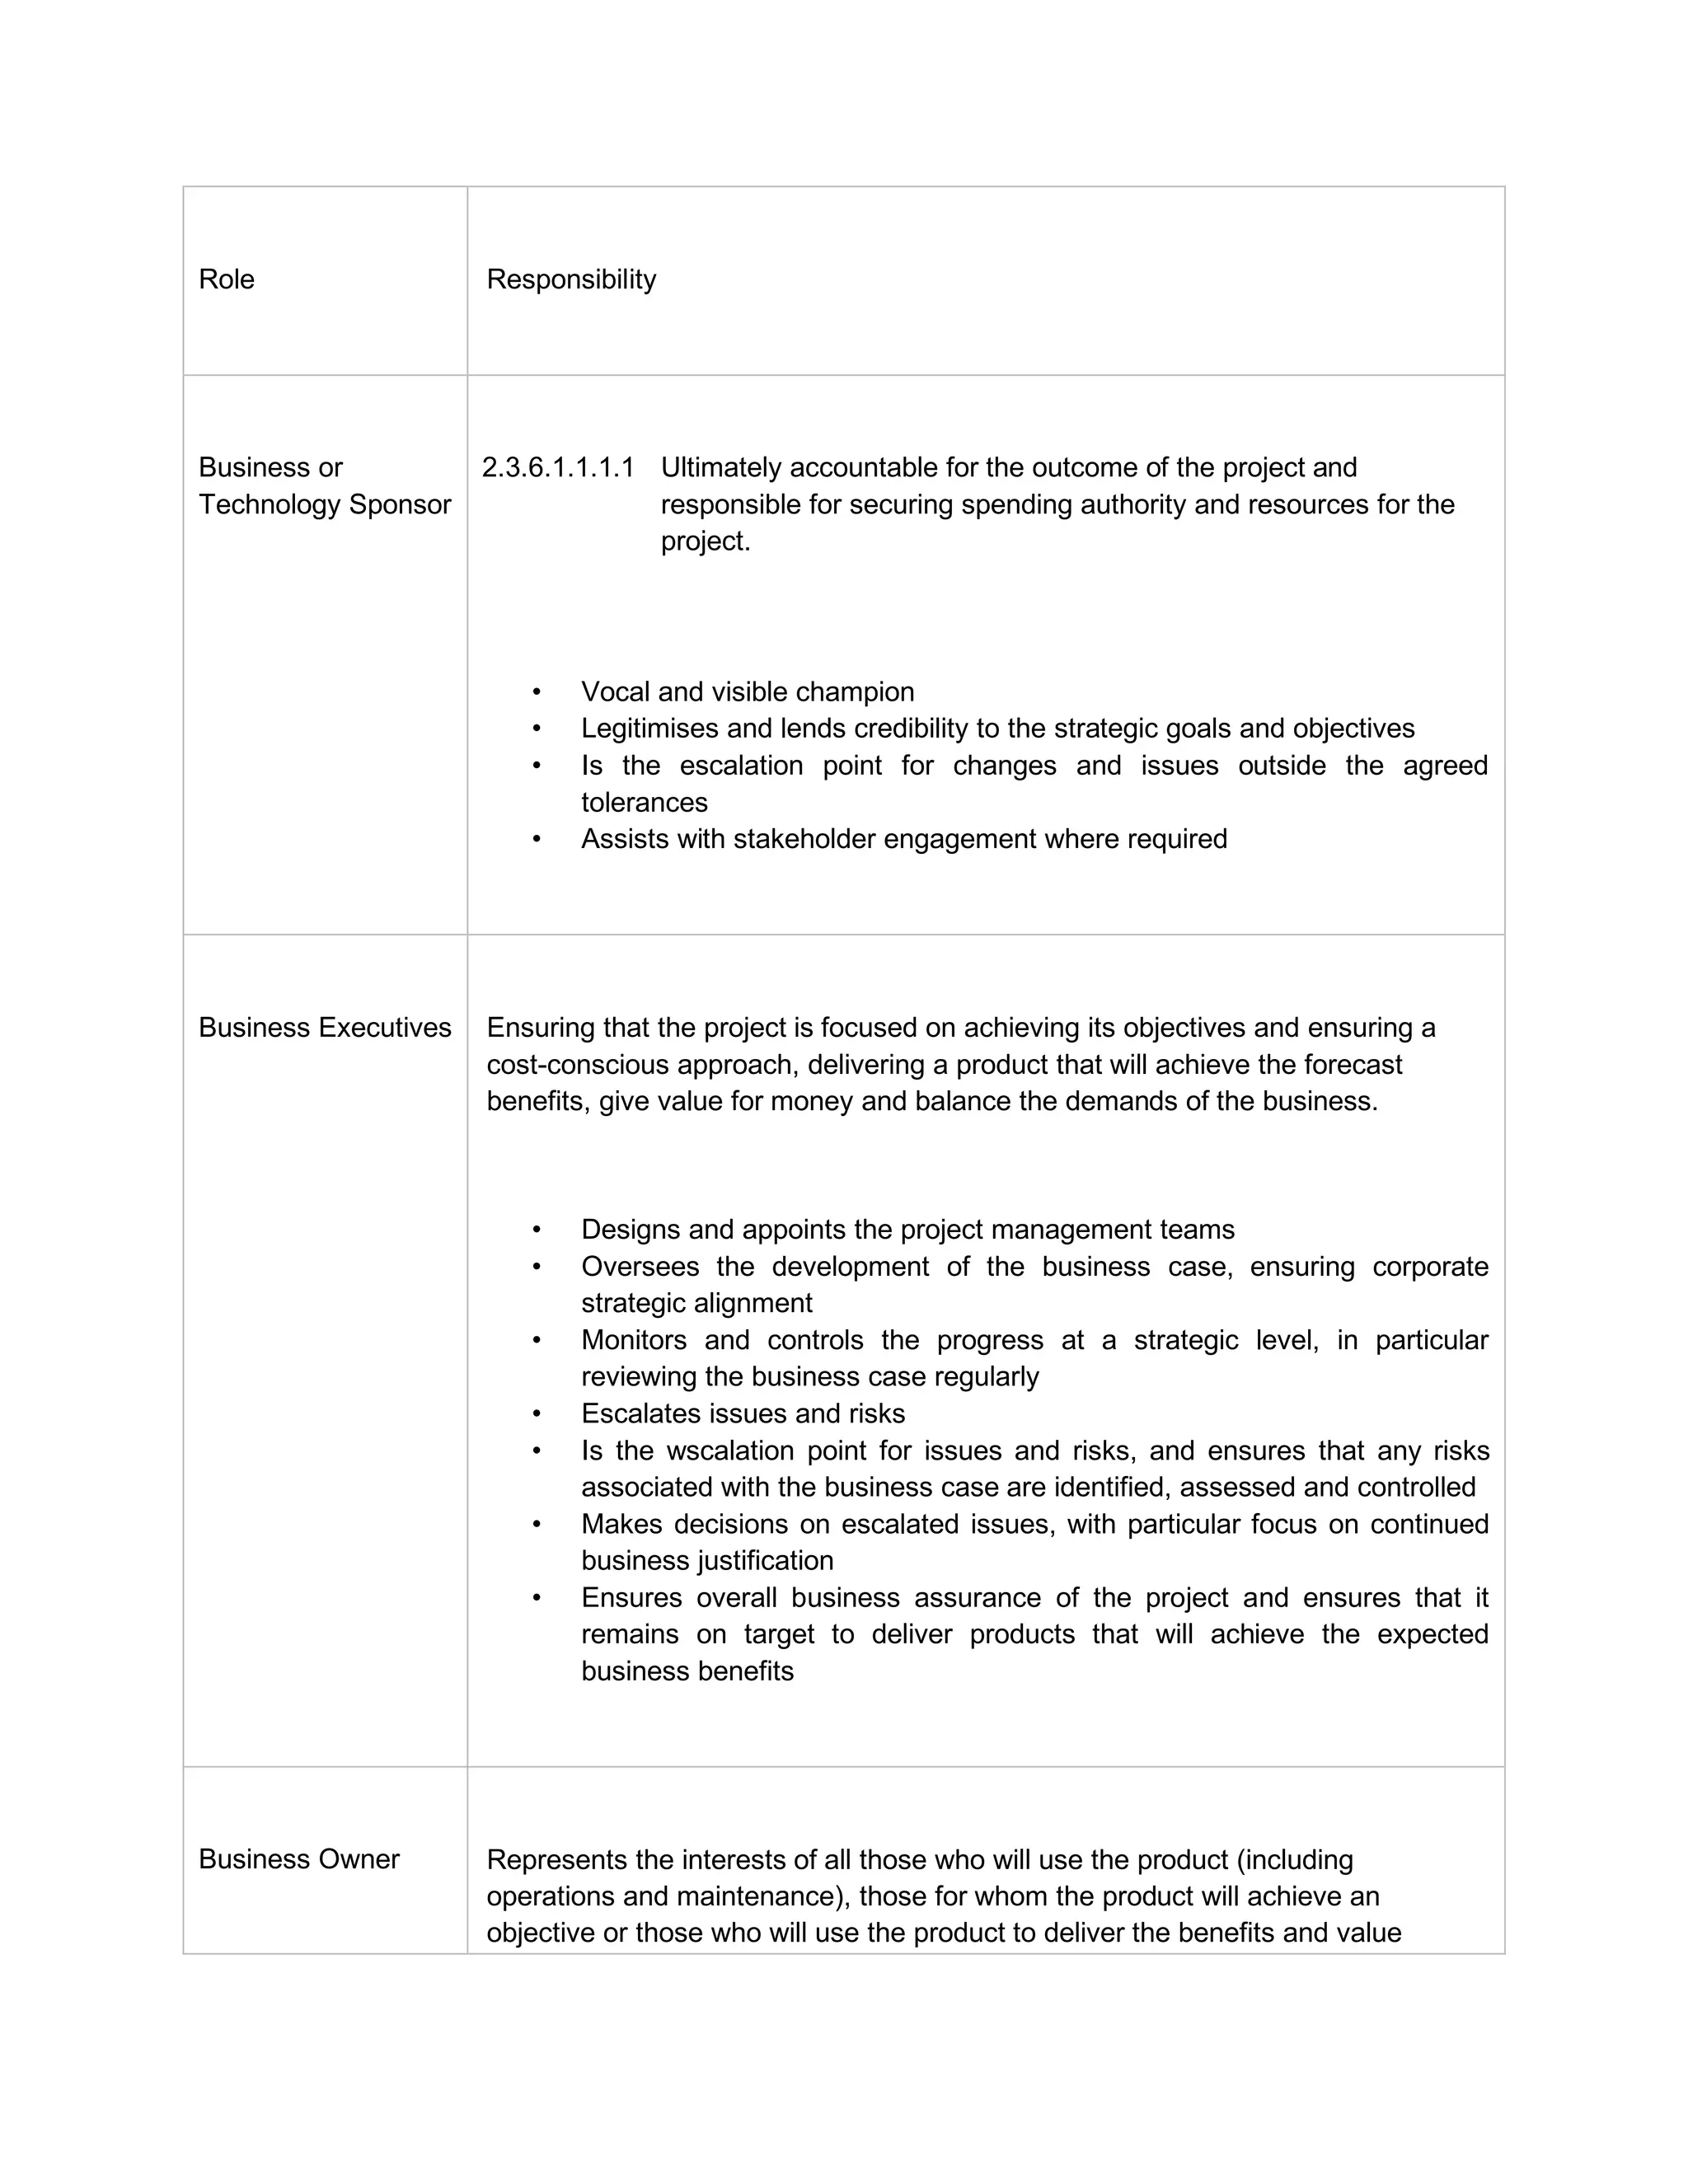
2.3.6 Common Roles and Responsibilities within a Steering Committee
The following high-level roles and responsibilities are based on industry-standard practices for
Steering Committees.
16.
Role Responsibility
Business or
TechnologySponsor
2.3.6.1.1.1.1 Ultimately accountable for the outcome of the project and
responsible for securing spending authority and resources for the
project.
• Vocal and visible champion
• Legitimises and lends credibility to the strategic goals and objectives
• Is the escalation point for changes and issues outside the agreed
tolerances
• Assists with stakeholder engagement where required
Business Executives2.3.6.1.1.1.2 Ensuring that the project is focused on achieving its objectives and ensuring a
cost-conscious approach, delivering a product that will achieve the forecast
benefits, give value for money and balance the demands of the business.
• Designs and appoints the project management teams
• Oversees the development of the business case, ensuring corporate
strategic alignment
• Monitors and controls the progress at a strategic level, in particular
reviewing the business case regularly
• Escalates issues and risks
• Is the wscalation point for issues and risks, and ensures that any risks
associated with the business case are identified, assessed and controlled
• Makes decisions on escalated issues, with particular focus on continued
business justification
• Ensures overall business assurance of the project and ensures that it
remains on target to deliver products that will achieve the expected
business benefits
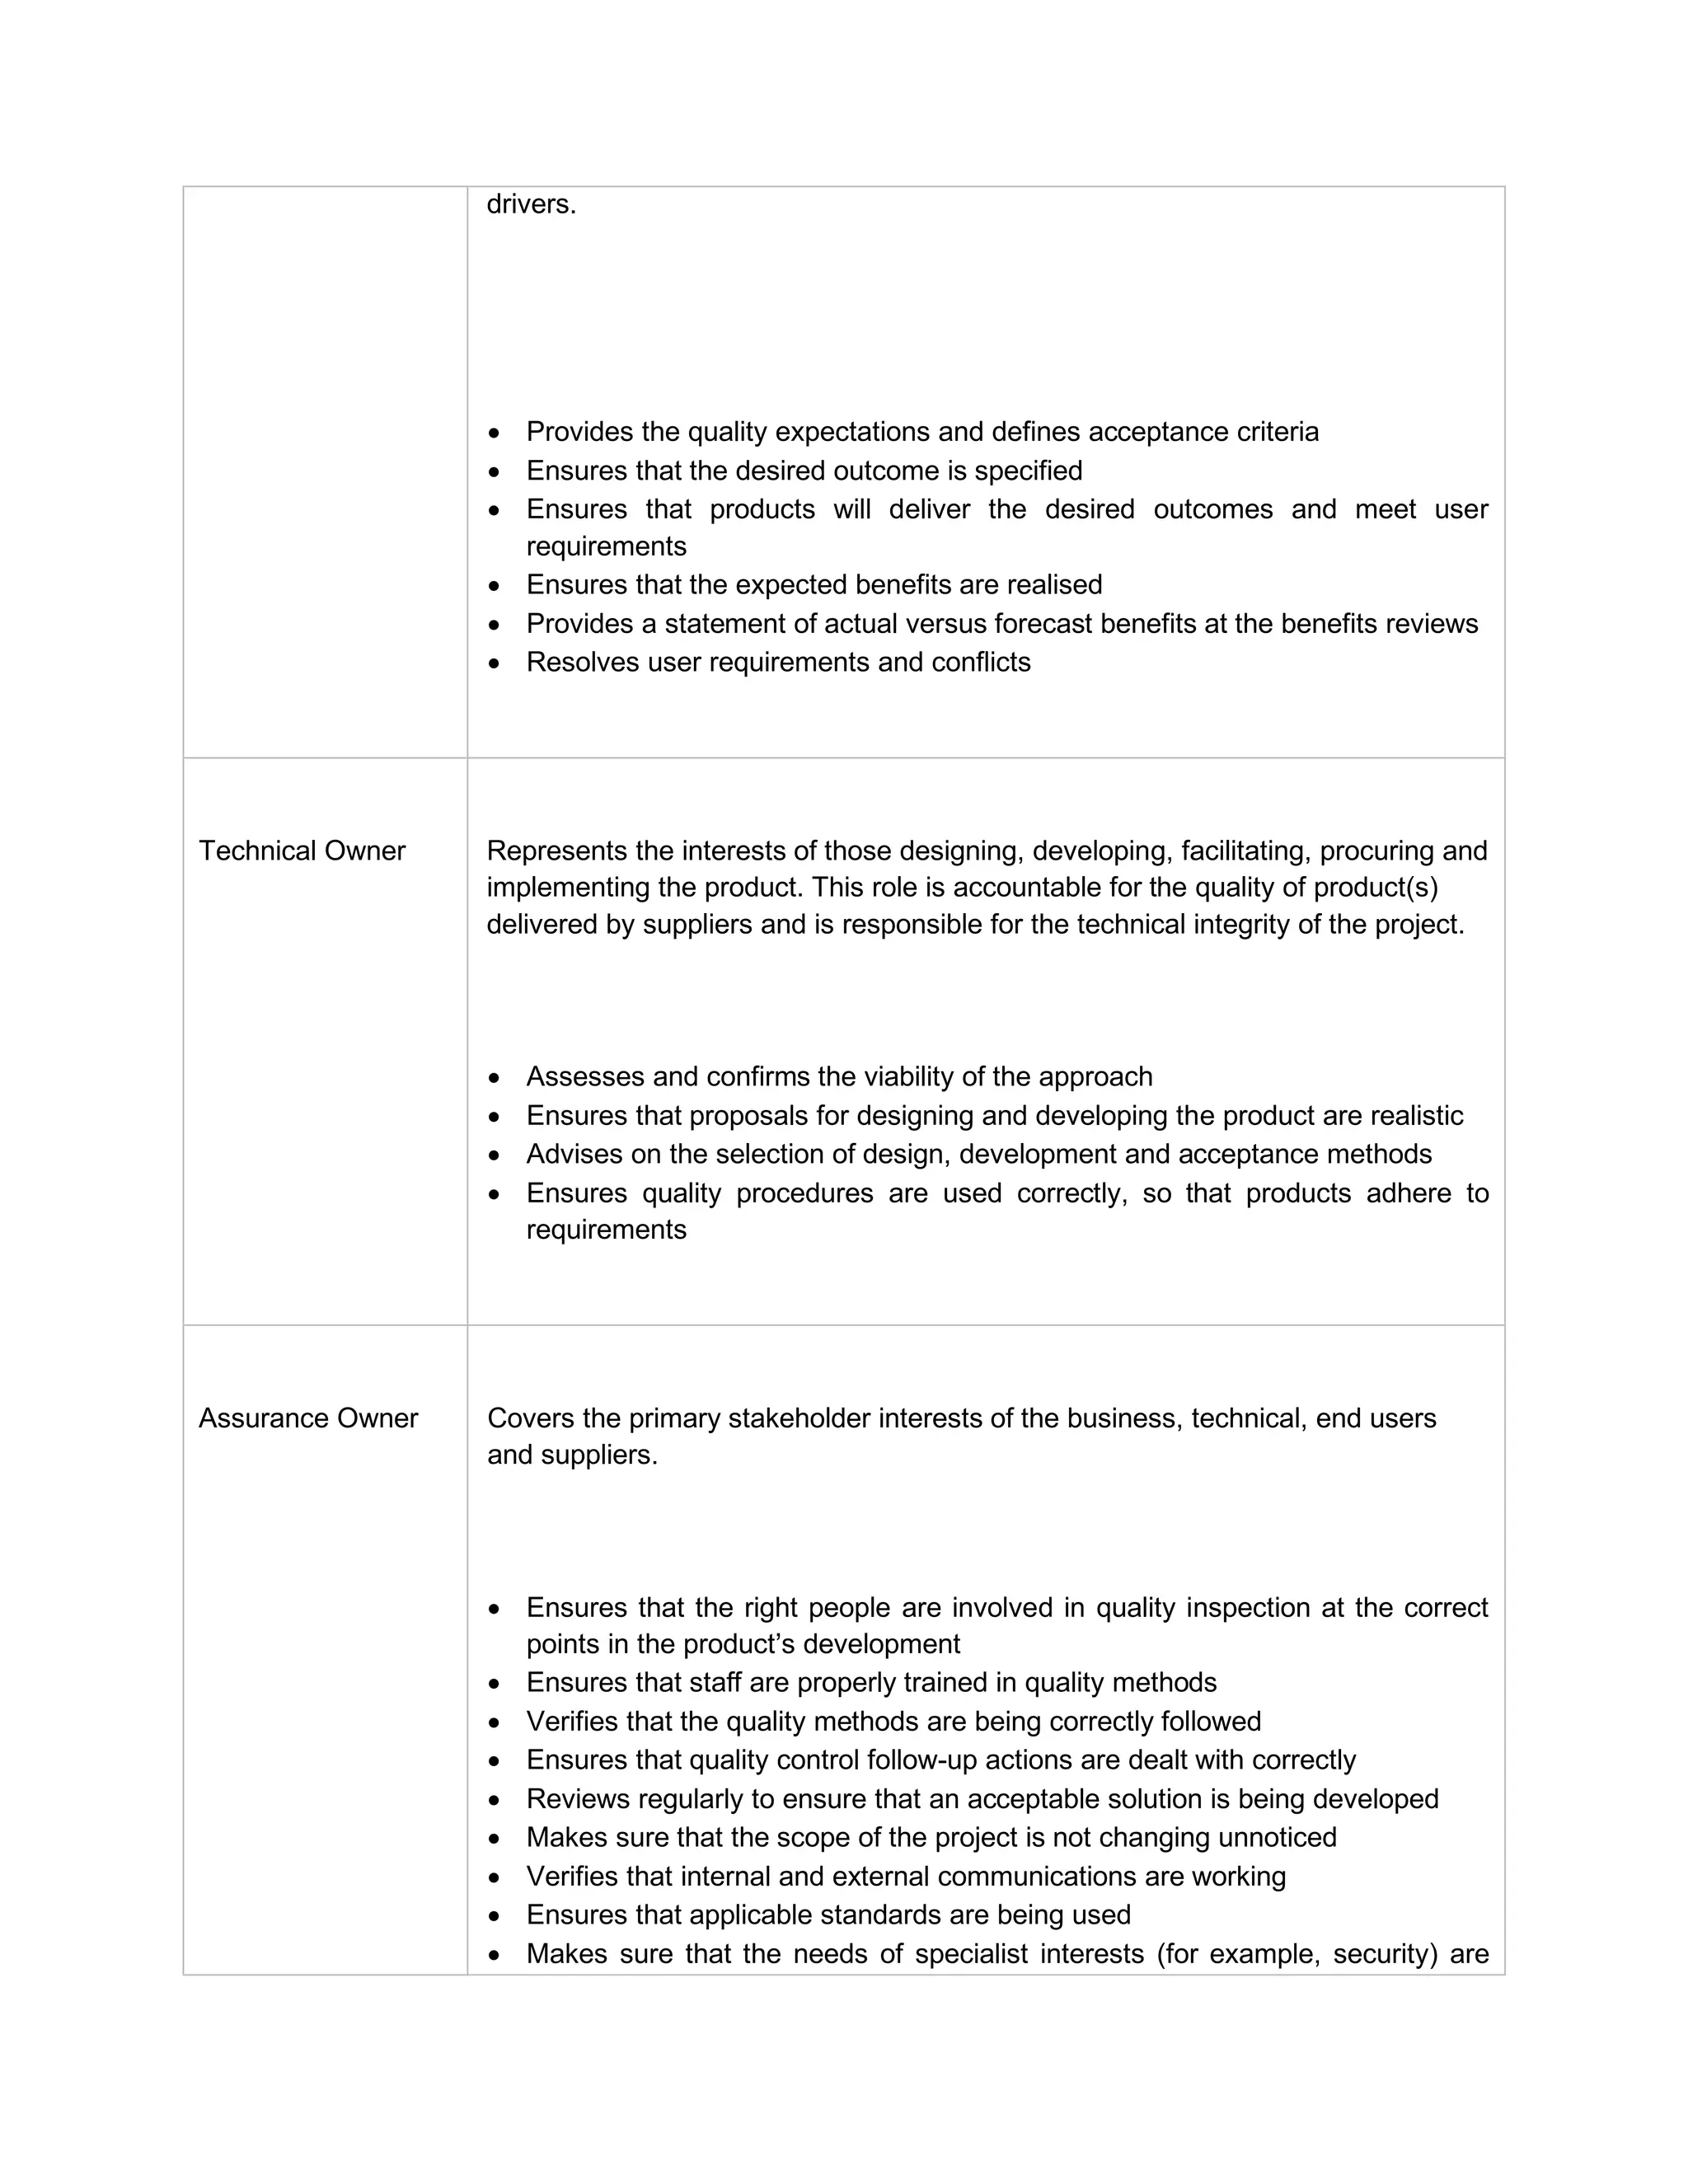
Business Owner2.3.6.1.1.1.3 Represents the interests of all those who will use the product (including
operations and maintenance), those for whom the product will achieve an
objective or those who will use the product to deliver the benefits and value
17.
drivers.
Provides thequality expectations and defines acceptance criteria
Ensures that the desired outcome is specified
Ensures that products will deliver the desired outcomes and meet user
requirements
Ensures that the expected benefits are realised
Provides a statement of actual versus forecast benefits at the benefits reviews
Resolves user requirements and conflicts
Technical Owner2.3.6.1.1.1.4 Represents the interests of those designing, developing, facilitating, procuring and
implementing the product. This role is accountable for the quality of product(s)
delivered by suppliers and is responsible for the technical integrity of the project.
Assesses and confirms the viability of the approach
Ensures that proposals for designing and developing the product are realistic
Advises on the selection of design, development and acceptance methods
Ensures quality procedures are used correctly, so that products adhere to
requirements
Assurance Owner2.3.6.1.1.1.5 Covers the primary stakeholder interests of the business, technical, end users
and suppliers.
Ensures that the right people are involved in quality inspection at the correct
points in the product’s development
Ensures that staff are properly trained in quality methods
Verifies that the quality methods are being correctly followed
Ensures that quality control follow-up actions are dealt with correctly
Reviews regularly to ensure that an acceptable solution is being developed
Makes sure that the scope of the project is not changing unnoticed
Verifies that internal and external communications are working
Ensures that applicable standards are being used
Makes sure that the needs of specialist interests (for example, security) are
18.
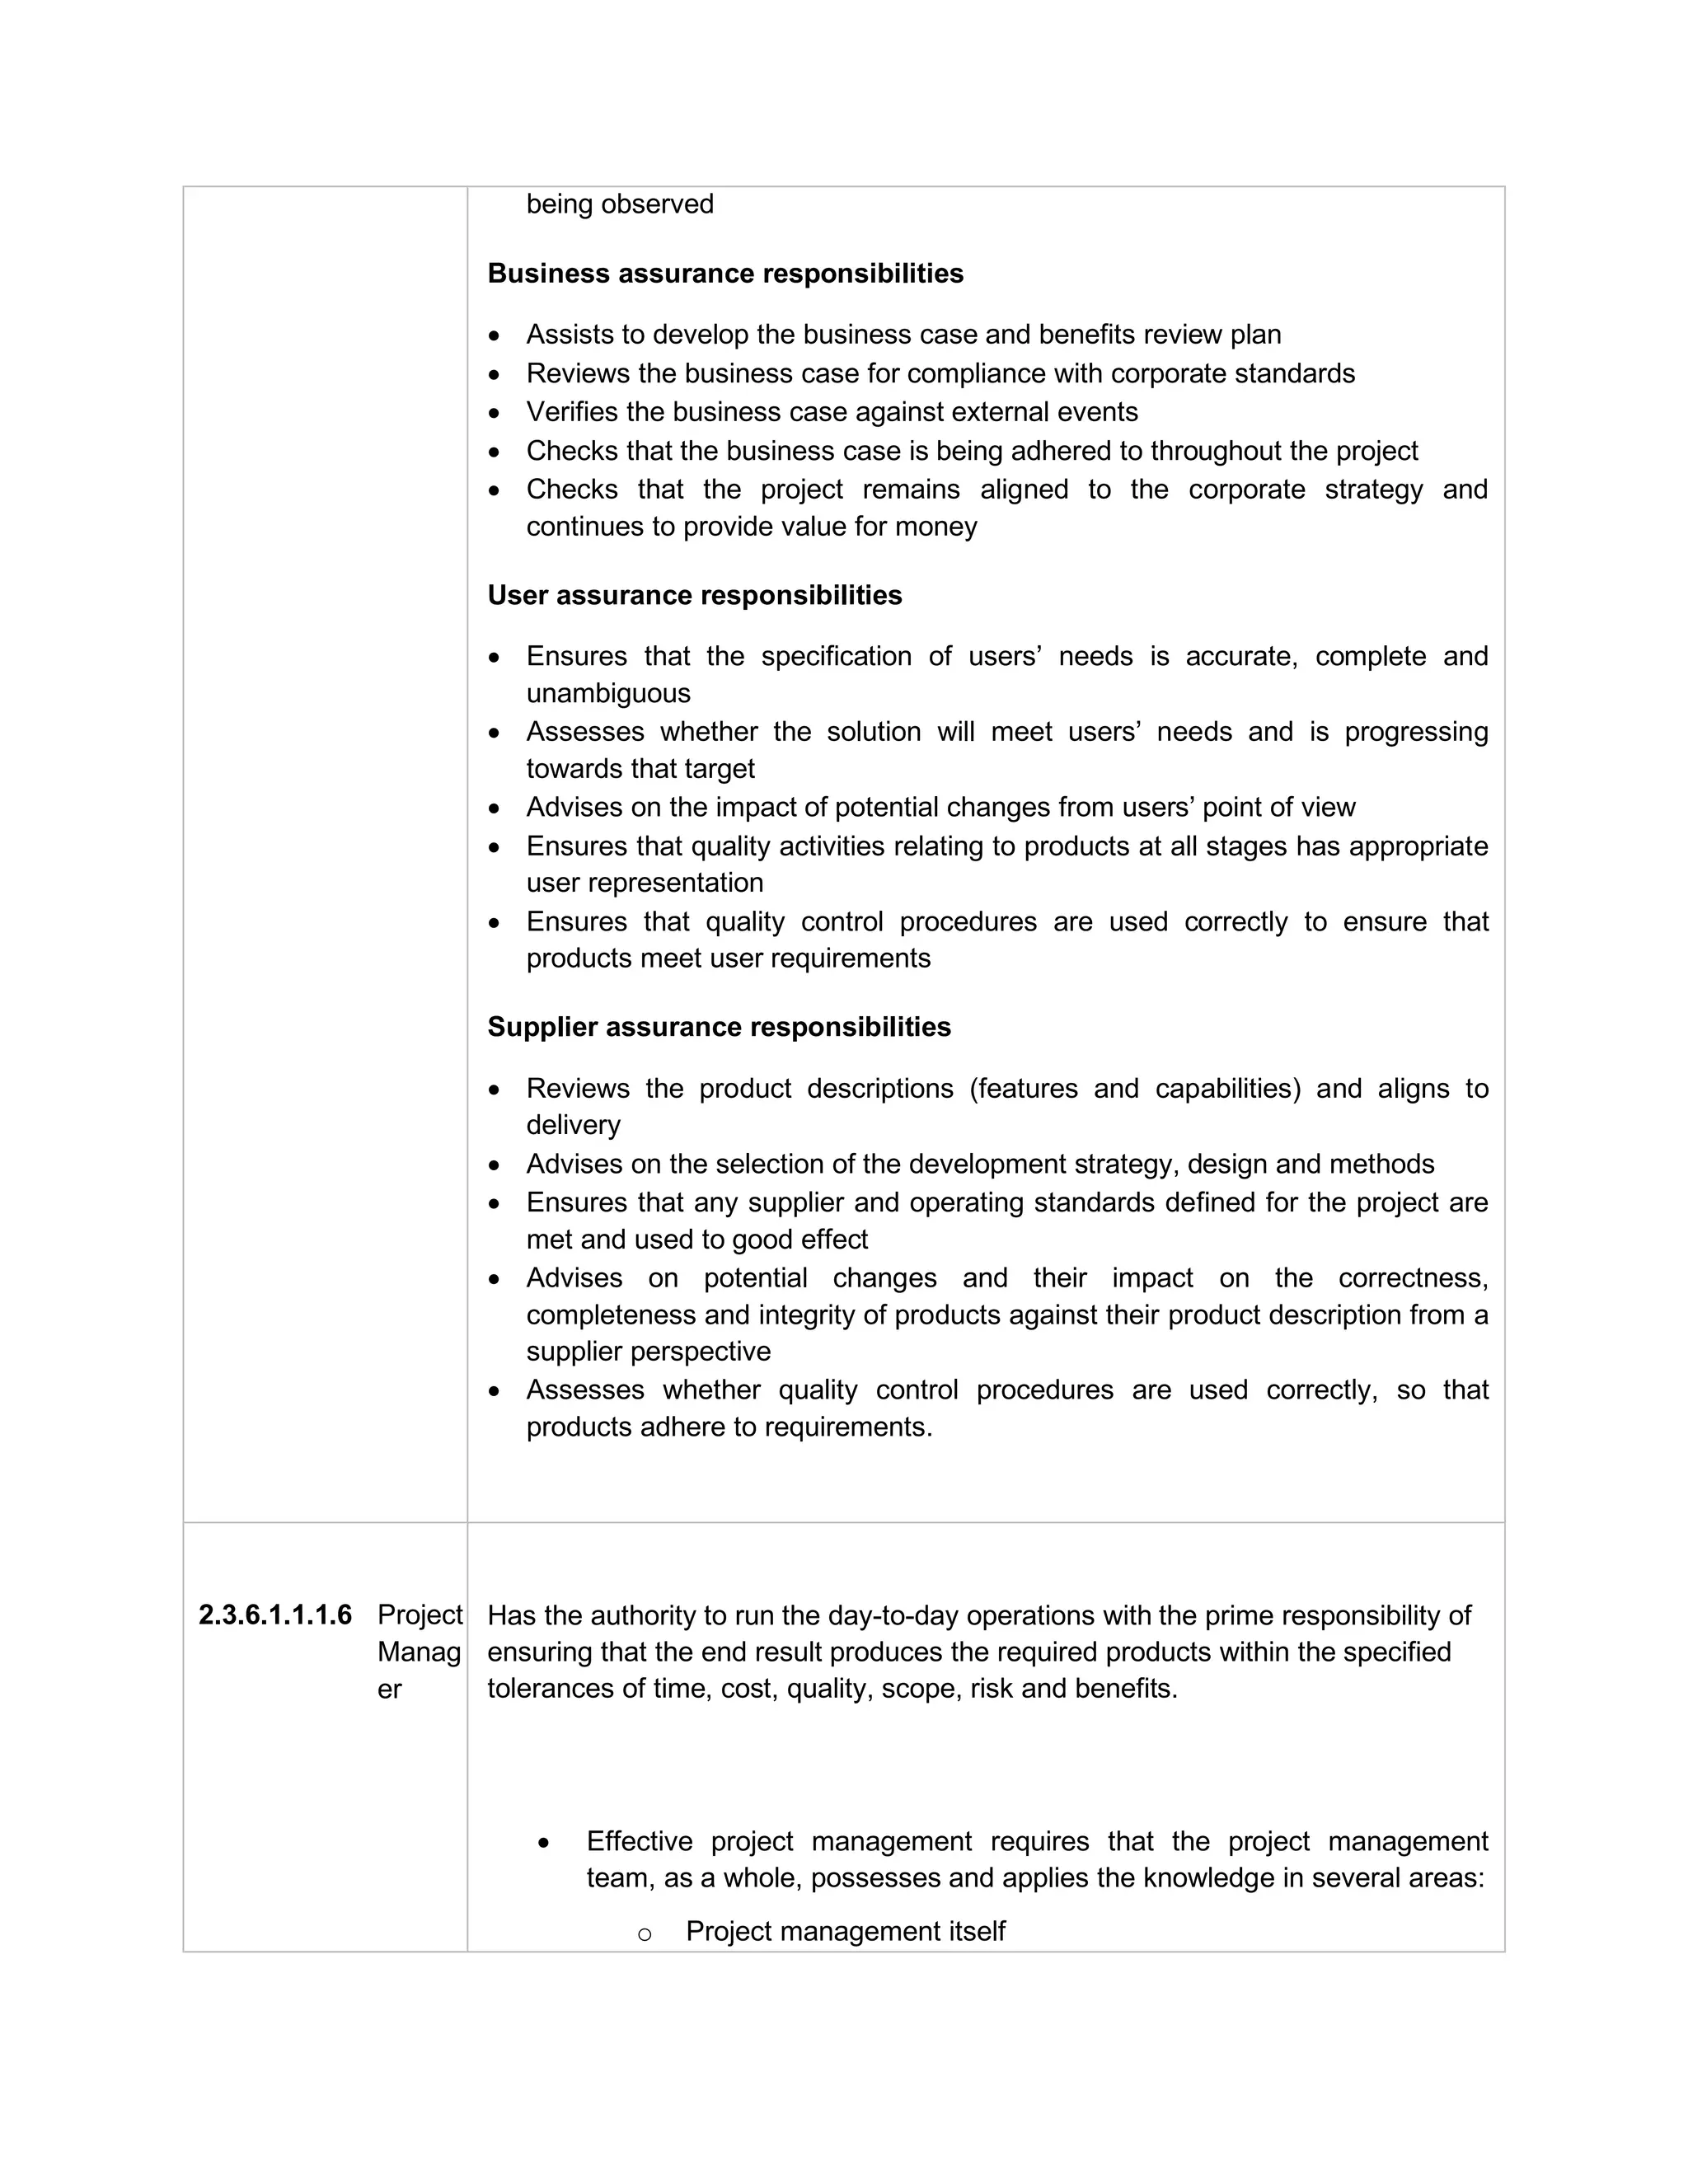
being observed
Business assuranceresponsibilities
Assists to develop the business case and benefits review plan
Reviews the business case for compliance with corporate standards
Verifies the business case against external events
Checks that the business case is being adhered to throughout the project
Checks that the project remains aligned to the corporate strategy and
continues to provide value for money
User assurance responsibilities
Ensures that the specification of users’ needs is accurate, complete and
unambiguous
Assesses whether the solution will meet users’ needs and is progressing
towards that target
Advises on the impact of potential changes from users’ point of view
Ensures that quality activities relating to products at all stages has appropriate
user representation
Ensures that quality control procedures are used correctly to ensure that
products meet user requirements
Supplier assurance responsibilities
Reviews the product descriptions (features and capabilities) and aligns to
delivery
Advises on the selection of the development strategy, design and methods
Ensures that any supplier and operating standards defined for the project are
met and used to good effect
Advises on potential changes and their impact on the correctness,
completeness and integrity of products against their product description from a
supplier perspective
Assesses whether quality control procedures are used correctly, so that
products adhere to requirements.
2.3.6.1.1.1.6 Project
Manag
er
2.3.6.1.1.1.7 Has the authority to run the day-to-day operations with the prime responsibility of
ensuring that the end result produces the required products within the specified
tolerances of time, cost, quality, scope, risk and benefits.
Effective project management requires that the project management
team, as a whole, possesses and applies the knowledge in several areas:
o Project management itself
19.
o Business andindustry domain knowledge specific to the project
o Technology knowledge required by the project
o Interpersonal and communication skills
The Project Management Framework consists of five key activity groups:
Initiation, Planning, Execution, Monitoring and Control, and Closing.
o These are the processes or activities for managing the project
and they are different from the Project Life Cycle.
o The Project Life Cycle activities are generally sequential, while
project management activities are performed concurrently,
because project management activities may overlap and repeat
along the timeline depending on risks (for example, the
controlling activities may lead back to planning to revise the
project plan as a result of changes).
2.3.7 Setting up a Working Group
Having a Working Group (with subject-matter experts) working below a Steering Committee will
help achieve specified goals. In your Adobe Analytics implementation, this Working Group
comprises the practitioner leads executing the project. They would meet more regularly and
report upwards to the Steering Committee.
The Working Group should have a weekly discussion where issues and risks are addressed and
the status, progress and approach of the project are discussed.
3 Strategy
“74 per cent of business executives say their company has a business
strategy. Only 15 per cent believe that their company has the skills and
capabilities to execute on that strategy.”
Forrester: Accelerating your digital business, 2013
3.1 Moving from Web Analytics to Marketing Analytics
20.
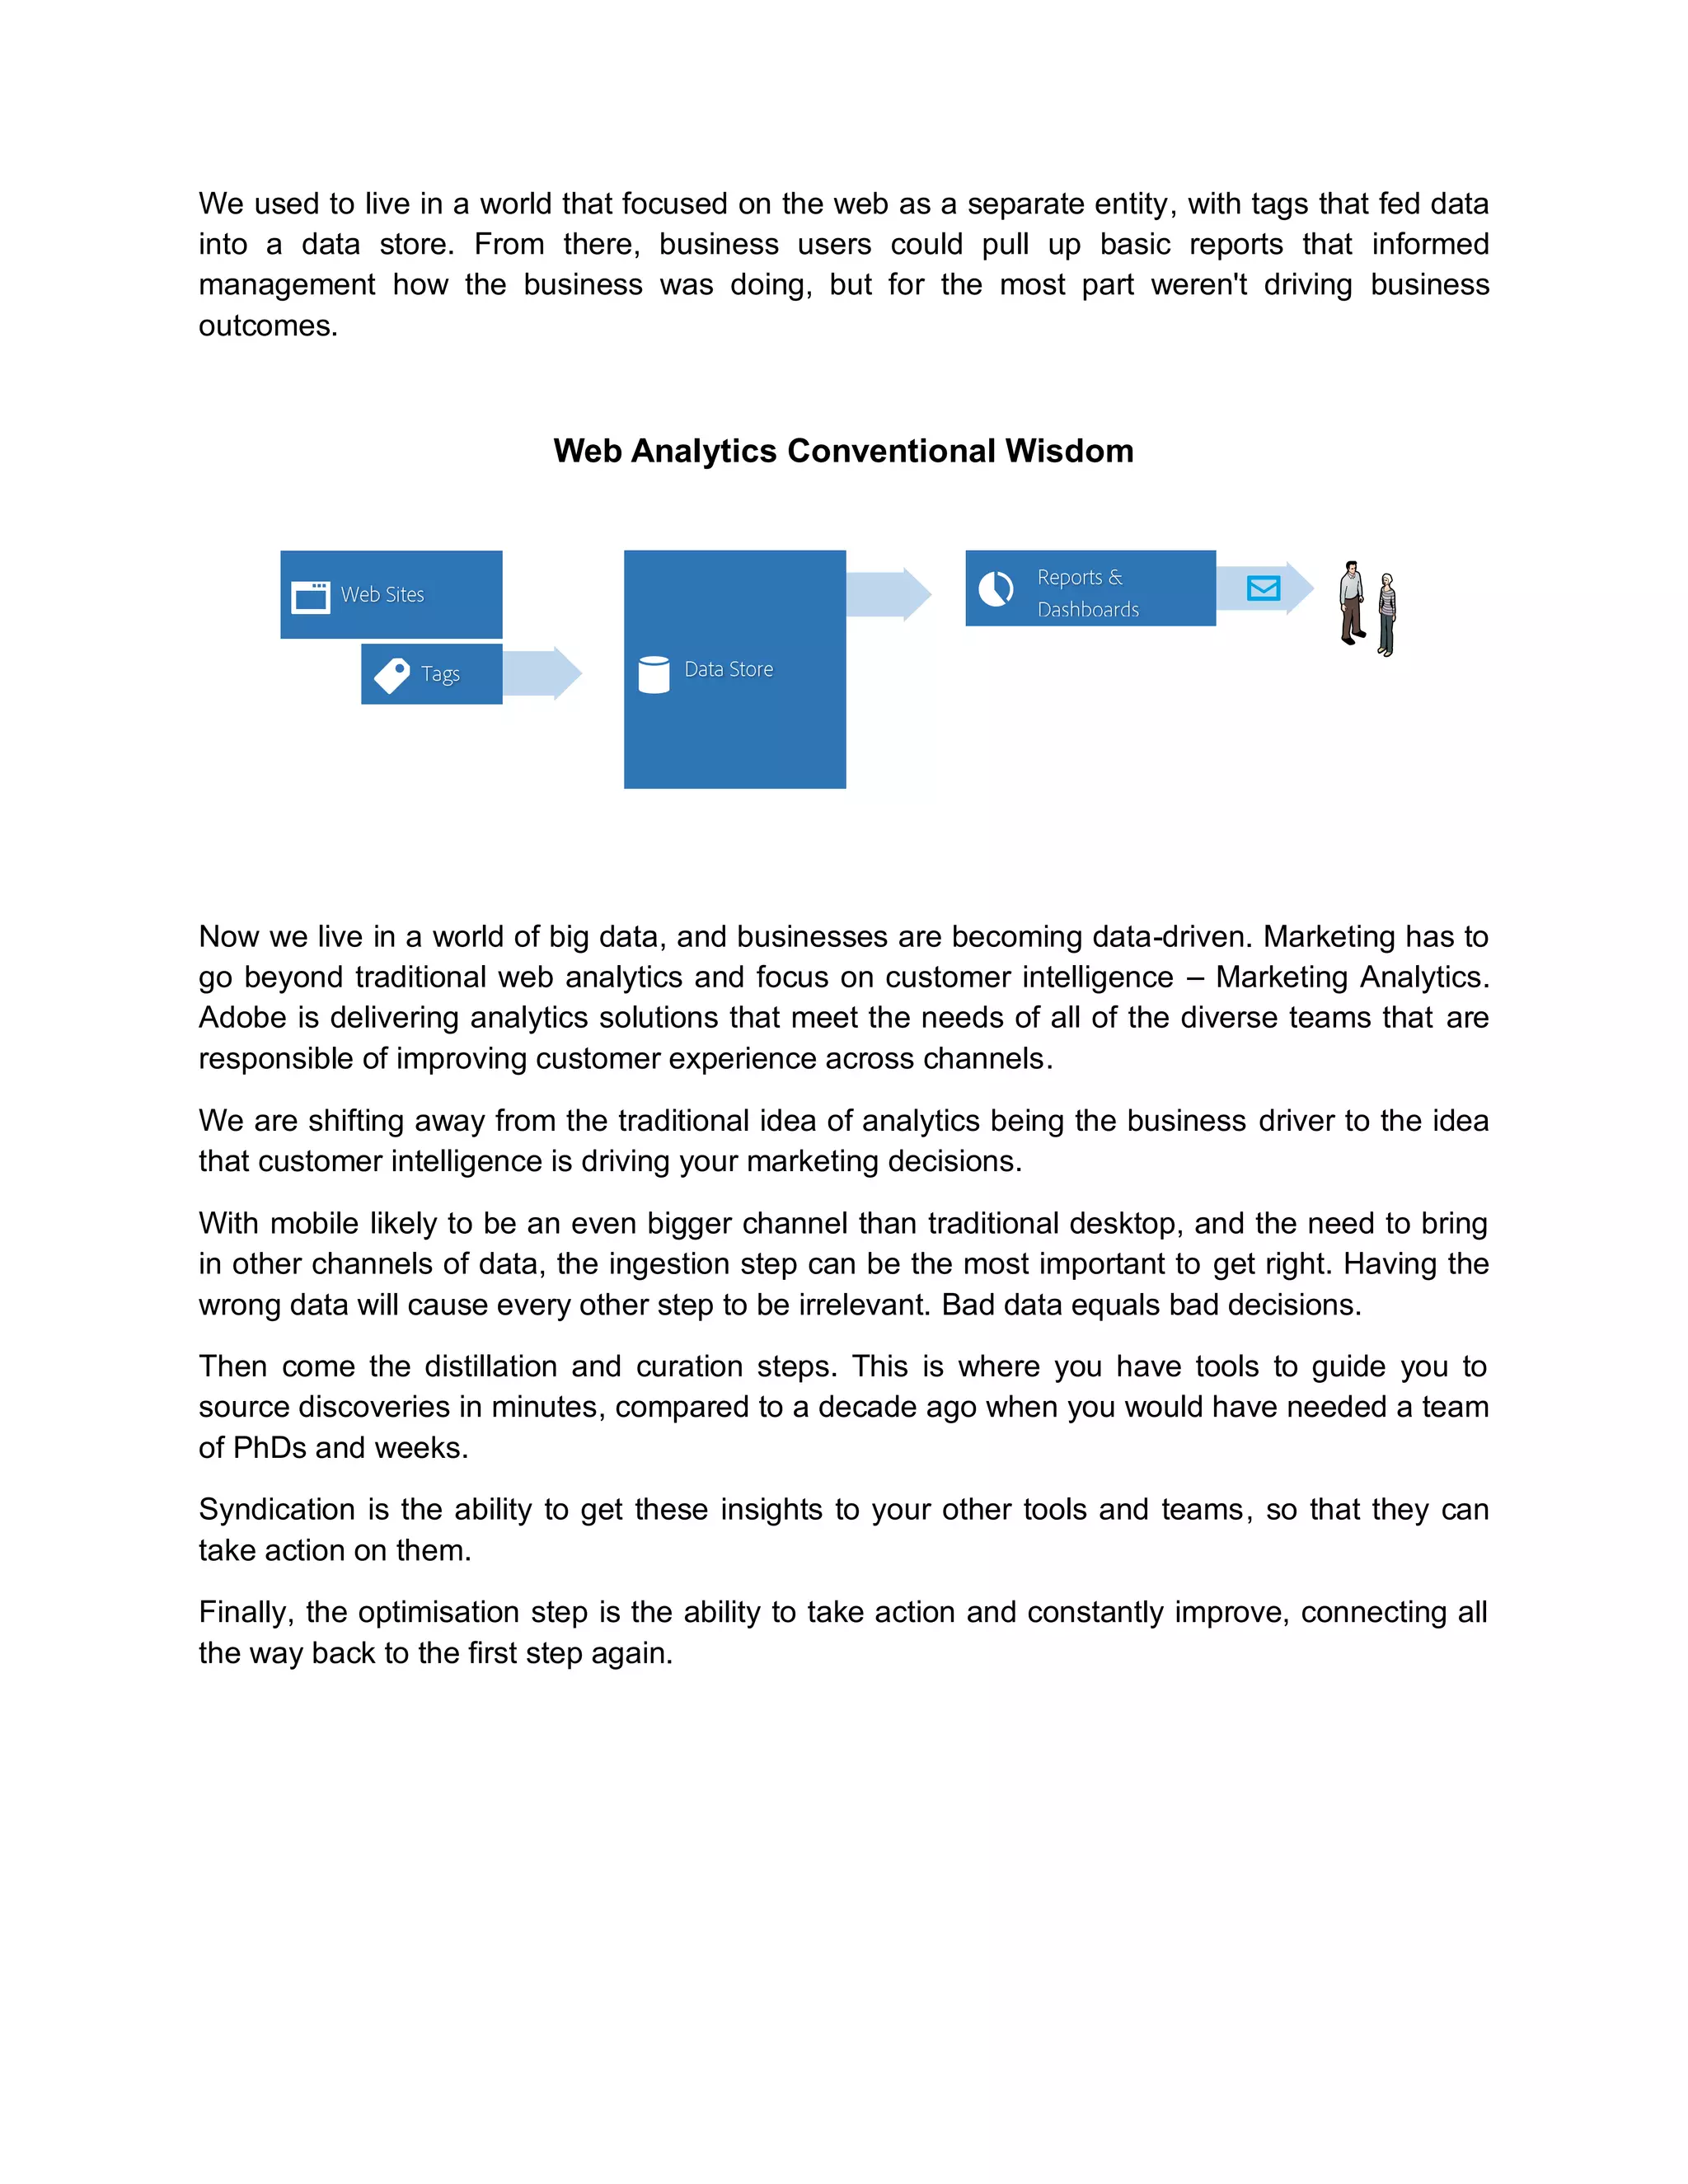
We used tolive in a world that focused on the web as a separate entity, with tags that fed data
into a data store. From there, business users could pull up basic reports that informed
management how the business was doing, but for the most part weren't driving business
outcomes.
Web Analytics Conventional Wisdom
Now we live in a world of big data, and businesses are becoming data-driven. Marketing has to
go beyond traditional web analytics and focus on customer intelligence – Marketing Analytics.
Adobe is delivering analytics solutions that meet the needs of all of the diverse teams that are
responsible of improving customer experience across channels.
We are shifting away from the traditional idea of analytics being the business driver to the idea
that customer intelligence is driving your marketing decisions.
With mobile likely to be an even bigger channel than traditional desktop, and the need to bring
in other channels of data, the ingestion step can be the most important to get right. Having the
wrong data will cause every other step to be irrelevant. Bad data equals bad decisions.
Then come the distillation and curation steps. This is where you have tools to guide you to
source discoveries in minutes, compared to a decade ago when you would have needed a team
of PhDs and weeks.
Syndication is the ability to get these insights to your other tools and teams, so that they can
take action on them.
Finally, the optimisation step is the ability to take action and constantly improve, connecting all
the way back to the first step again.
21.
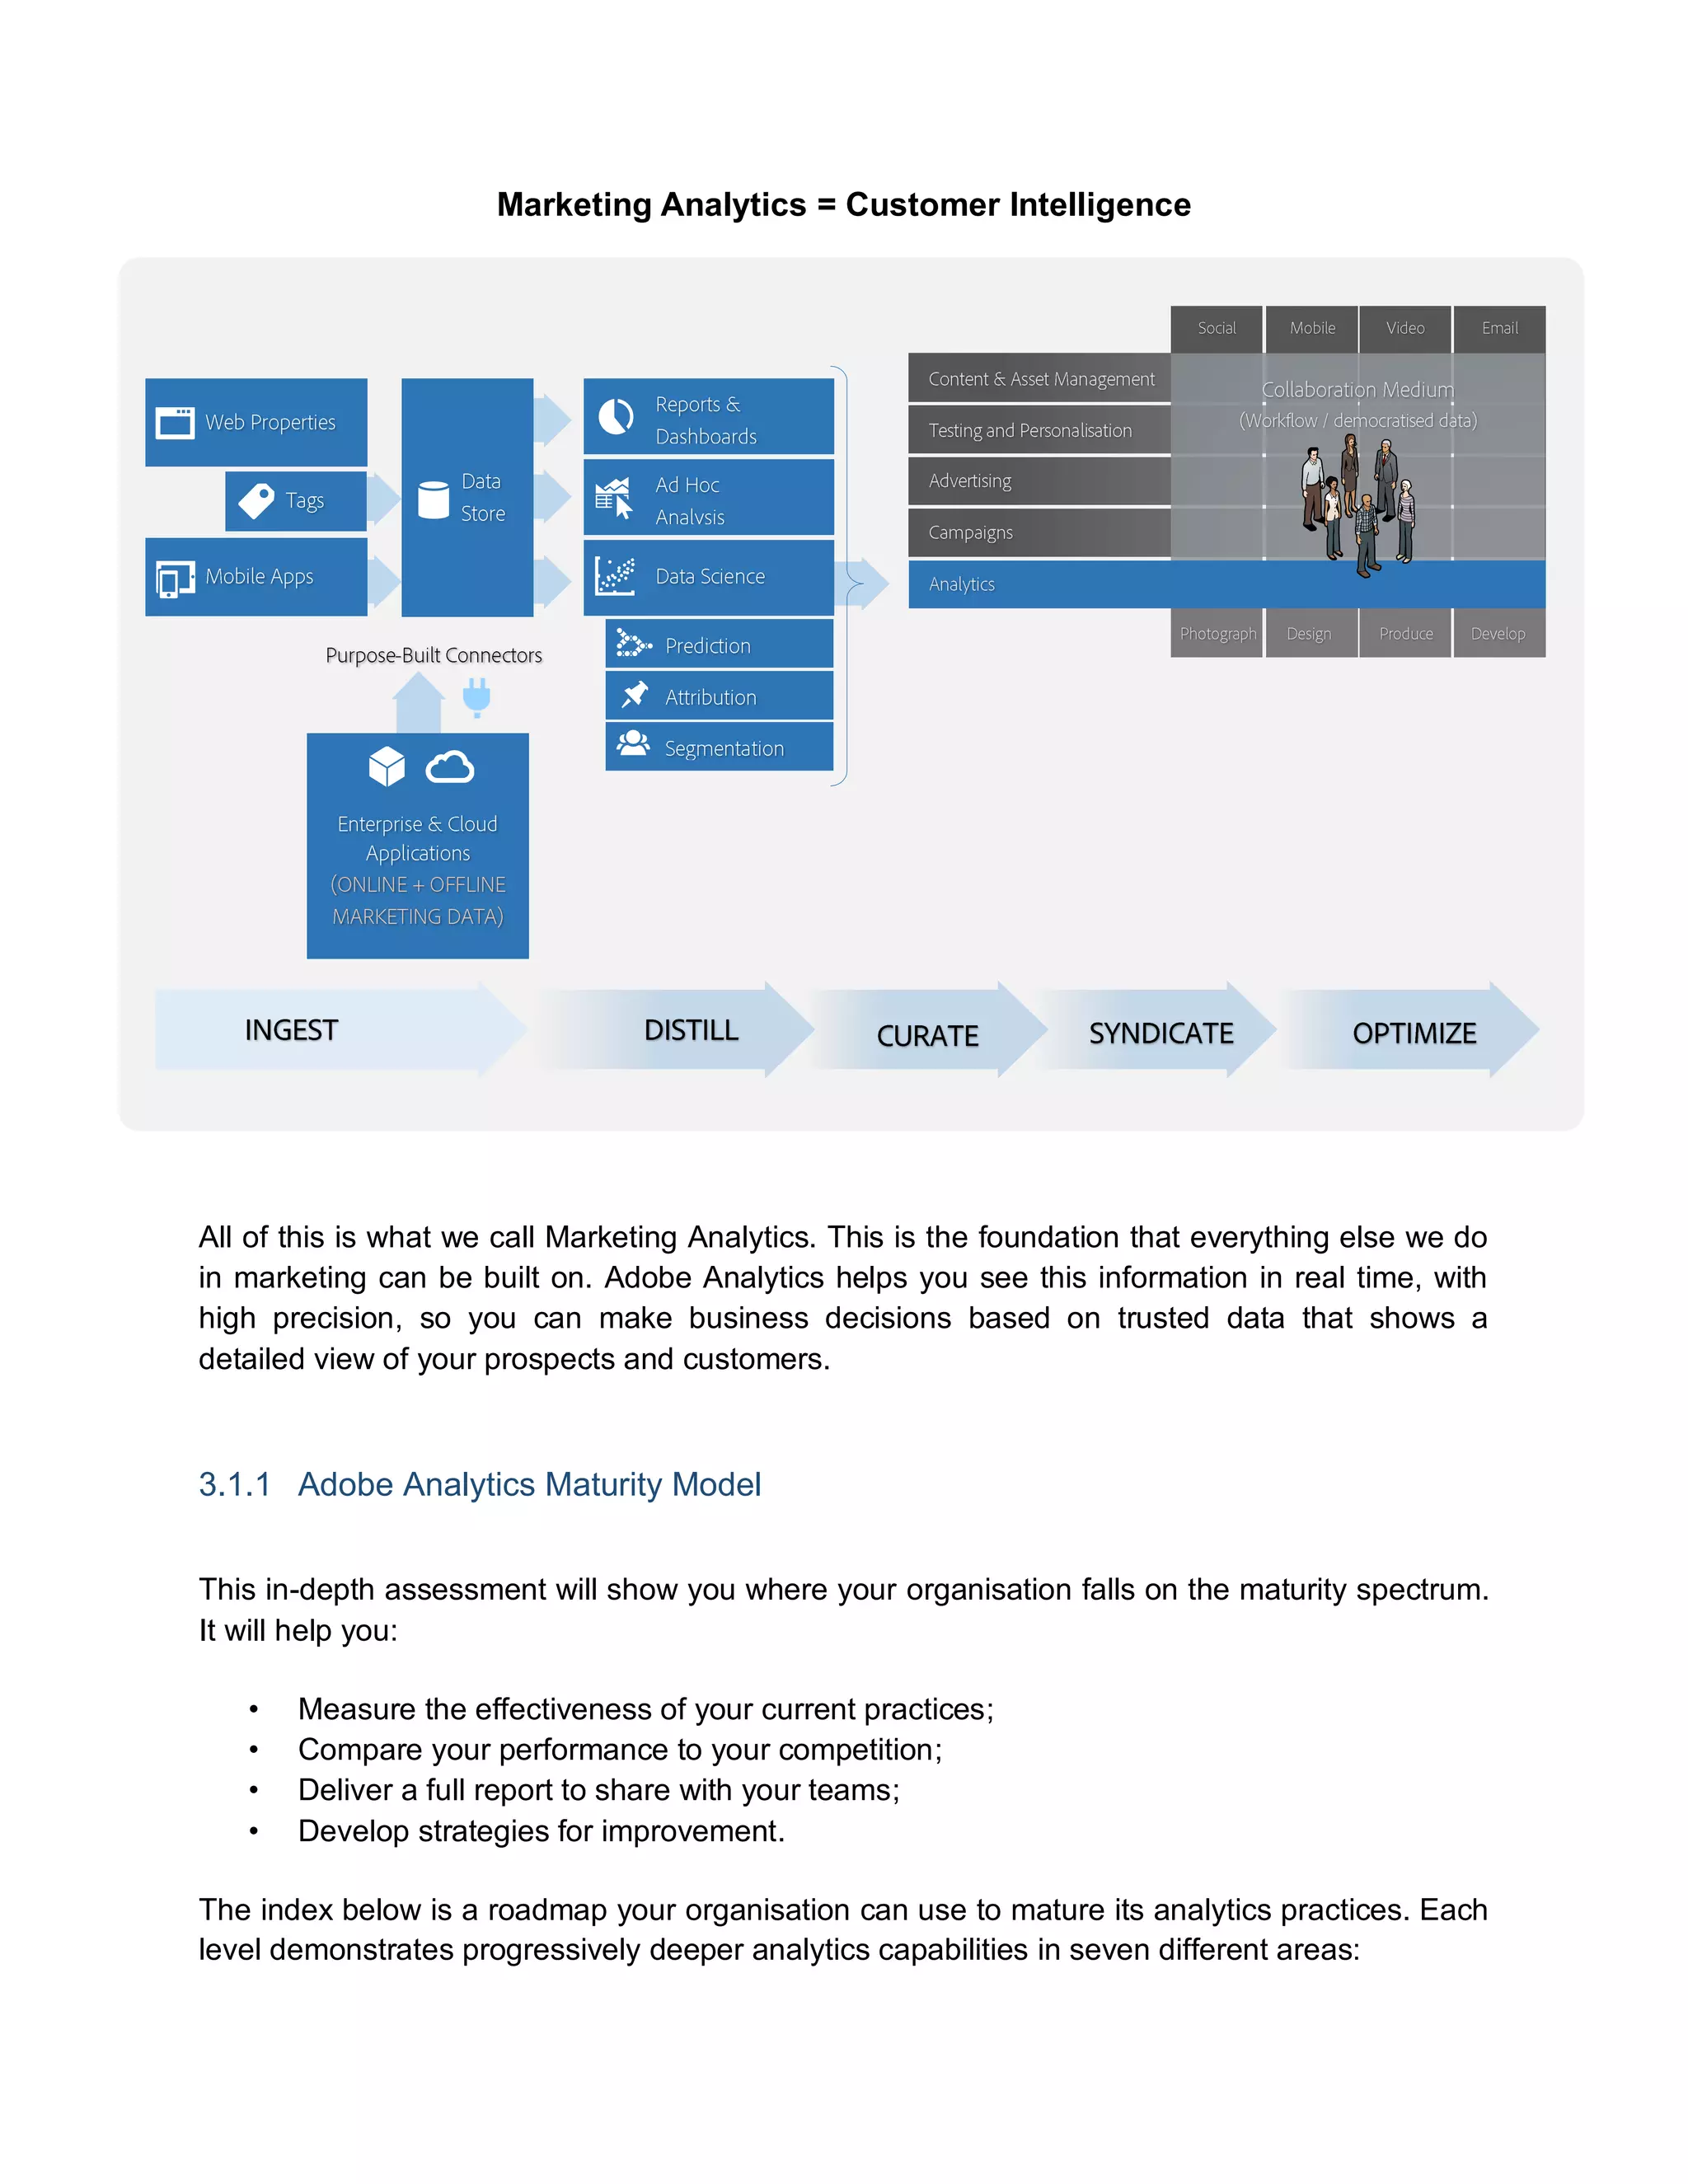
Marketing Analytics =Customer Intelligence
All of this is what we call Marketing Analytics. This is the foundation that everything else we do
in marketing can be built on. Adobe Analytics helps you see this information in real time, with
high precision, so you can make business decisions based on trusted data that shows a
detailed view of your prospects and customers.
3.1.1 Adobe Analytics Maturity Model
This in-depth assessment will show you where your organisation falls on the maturity spectrum.
It will help you:
• Measure the effectiveness of your current practices;
• Compare your performance to your competition;
• Deliver a full report to share with your teams;
• Develop strategies for improvement.
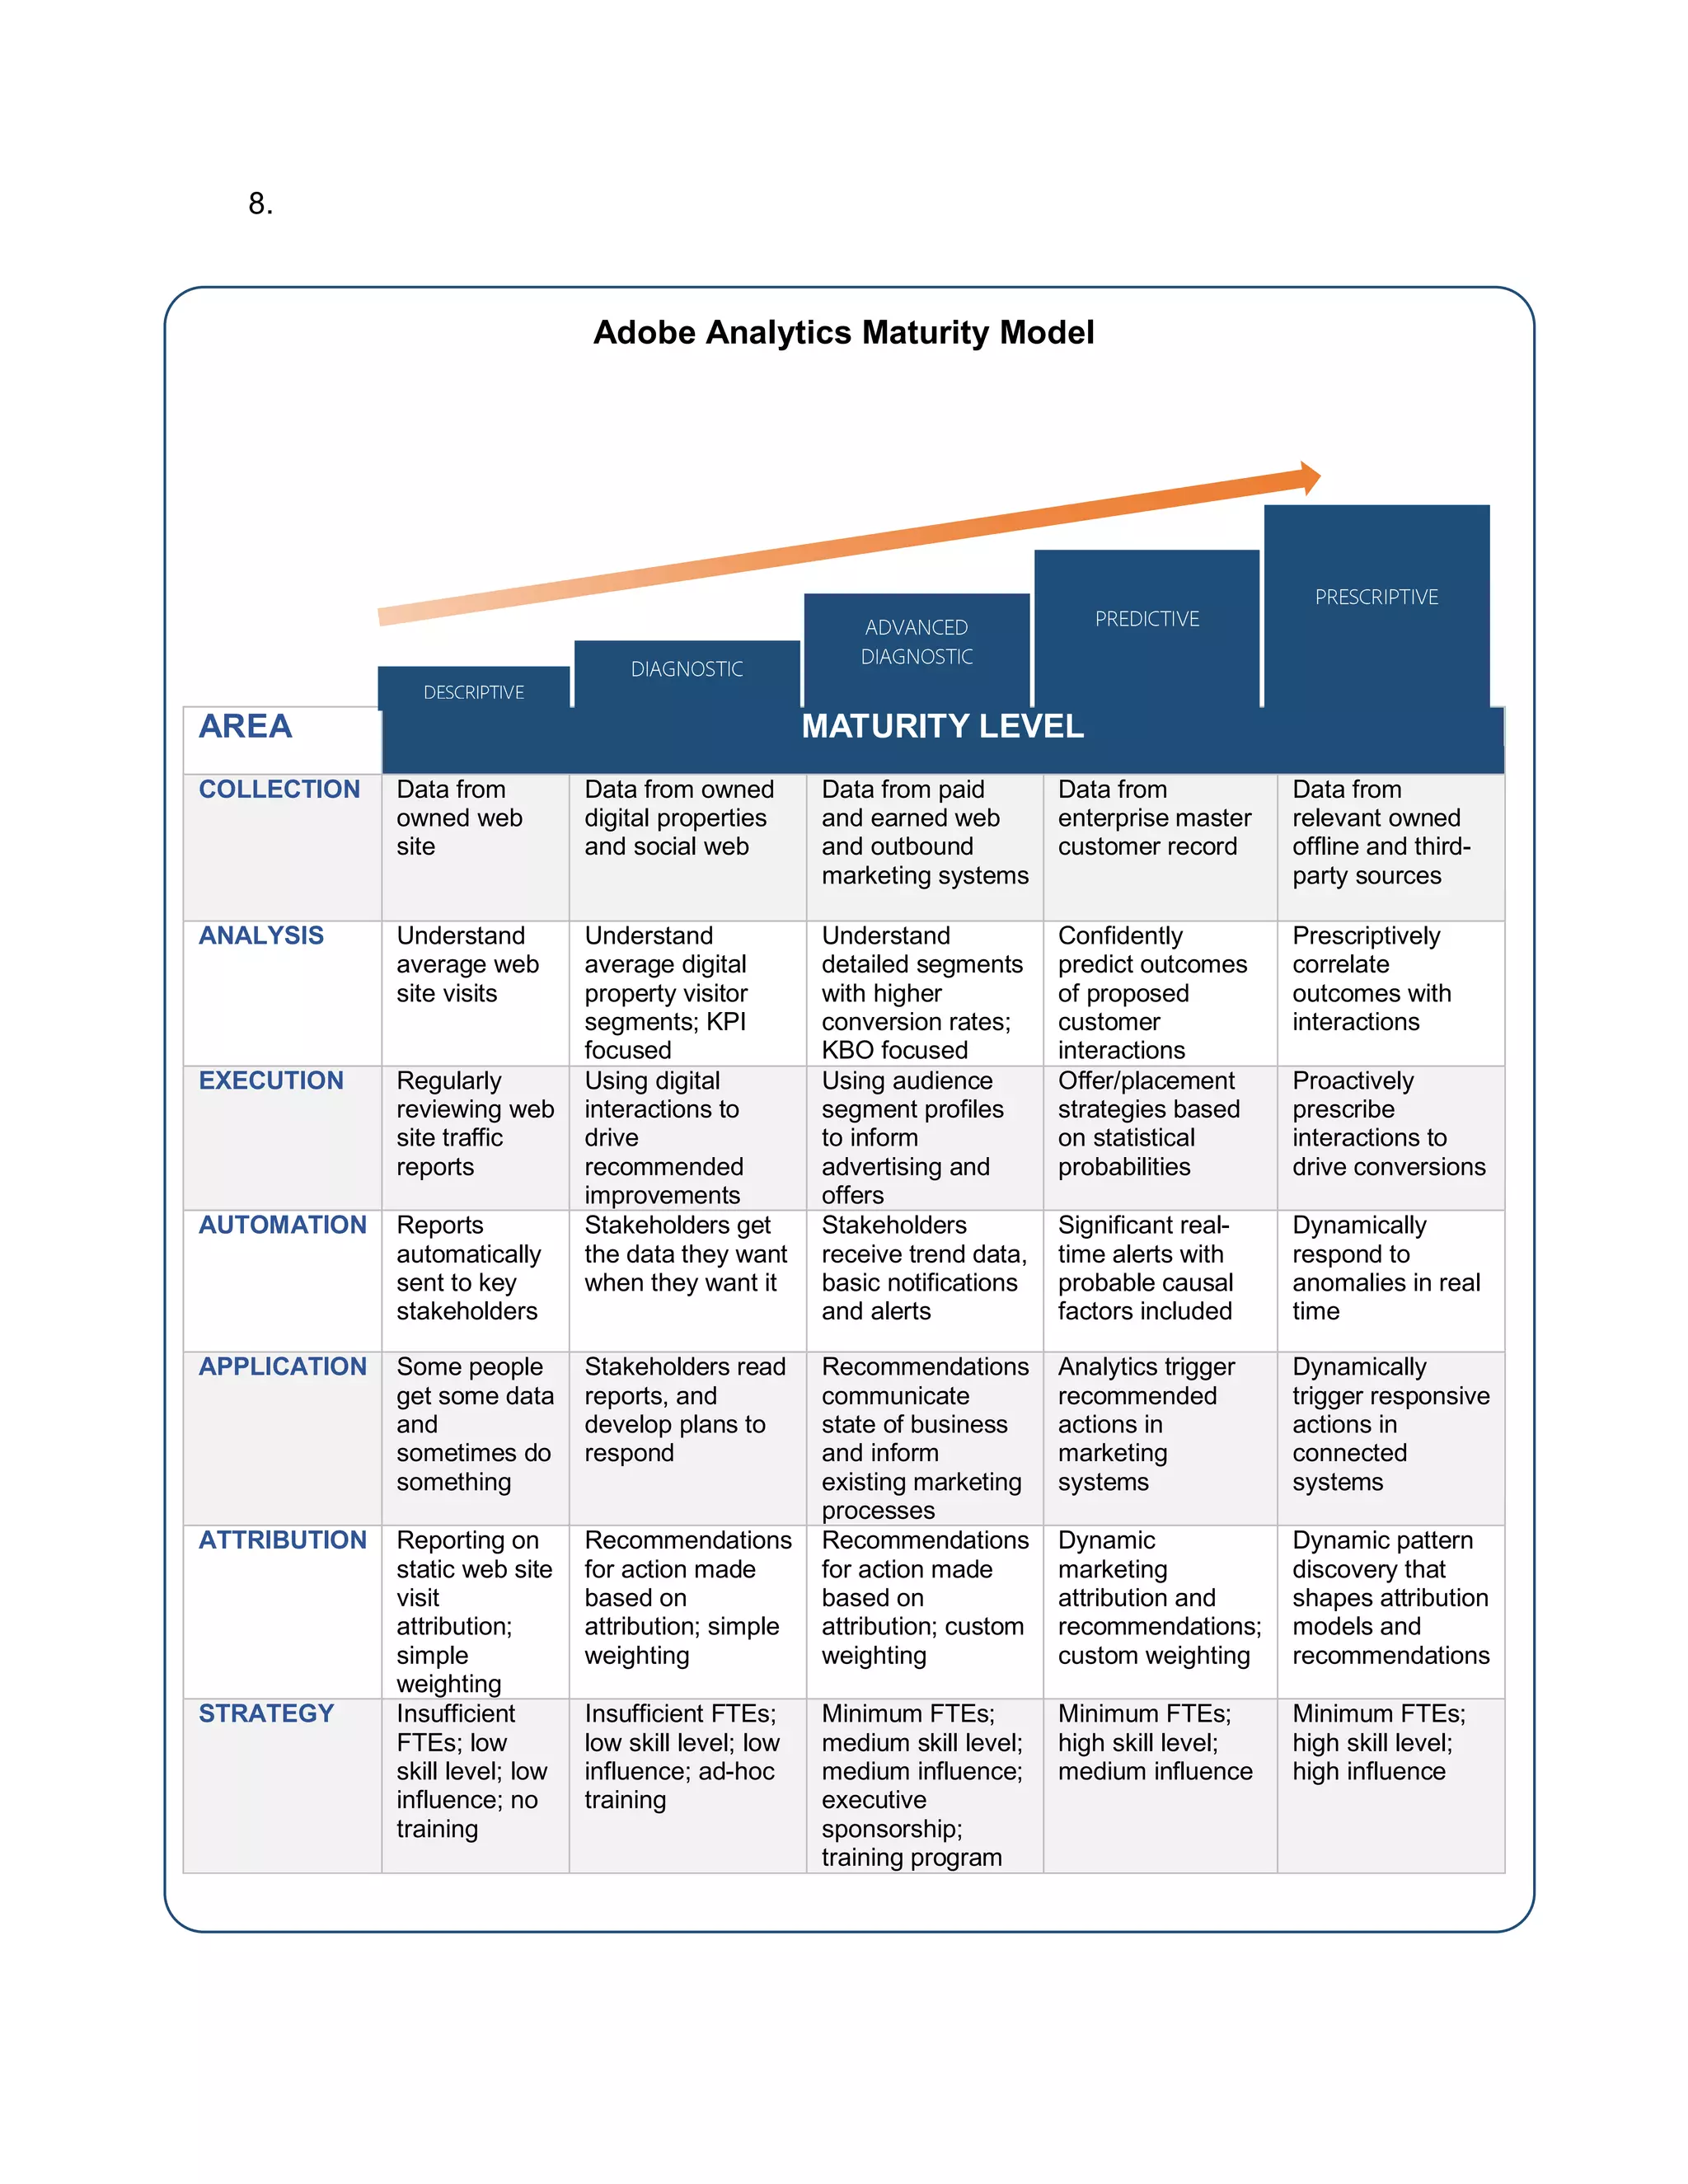
The index below is a roadmap your organisation can use to mature its analytics practices. Each
level demonstrates progressively deeper analytics capabilities in seven different areas:
22.
1. Collection refersto data gathered from various sources specifically for the purpose of
performing analytics.
2. Analysis refers to the degree to which an organisation can gain actionable insights with
its current capabilities.
3. Execution refers to the manner in which an organisation takes action based on
analytics.
4. Automation describes the level of human interaction that is required for data to be
disseminated, understood, and acted upon.
5. Application describes how an organisation tactically responds to analytics findings.
6. Attribution describes an organisation’s ability to assign or ascribe credit accurately to
the factors that contribute to any given marketing result.
7. Strategy describes the combined level of talent, culture, executive sponsorship,
technological capabilities, processes, and credibility of the organisation’s analytics
practice (the collective result of people, process, and technology an organisation invests
in analytics).
23.
8.
Adobe Analytics MaturityModel
AREA MATURITY LEVEL
COLLECTION Data from
owned web
site
Data from owned
digital properties
and social web
Data from paid
and earned web
and outbound
marketing systems
Data from
enterprise master
customer record
Data from
relevant owned
offline and third-
party sources
ANALYSIS Understand
average web
site visits
Understand
average digital
property visitor
segments; KPI
focused
Understand
detailed segments
with higher
conversion rates;
KBO focused
Confidently
predict outcomes
of proposed
customer
interactions
Prescriptively
correlate
outcomes with
interactions
EXECUTION Regularly
reviewing web
site traffic
reports
Using digital
interactions to
drive
recommended
improvements
Using audience
segment profiles
to inform
advertising and
offers
Offer/placement
strategies based
on statistical
probabilities
Proactively
prescribe
interactions to
drive conversions
AUTOMATION Reports
automatically
sent to key
stakeholders
Stakeholders get
the data they want
when they want it
Stakeholders
receive trend data,
basic notifications
and alerts
Significant real-
time alerts with
probable causal
factors included
Dynamically
respond to
anomalies in real
time
APPLICATION Some people
get some data
and
sometimes do
something
Stakeholders read
reports, and
develop plans to
respond
Recommendations
communicate
state of business
and inform
existing marketing
processes
Analytics trigger
recommended
actions in
marketing
systems
Dynamically
trigger responsive
actions in
connected
systems
ATTRIBUTION Reporting on
static web site
visit
attribution;
simple
weighting
Recommendations
for action made
based on
attribution; simple
weighting
Recommendations
for action made
based on
attribution; custom
weighting
Dynamic
marketing
attribution and
recommendations;
custom weighting
Dynamic pattern
discovery that
shapes attribution
models and
recommendations
STRATEGY Insufficient
FTEs; low
skill level; low
influence; no
training
Insufficient FTEs;
low skill level; low
influence; ad-hoc
training
Minimum FTEs;
medium skill level;
medium influence;
executive
sponsorship;
training program
Minimum FTEs;
high skill level;
medium influence
Minimum FTEs;
high skill level;
high influence
24.
Mature analytics meanssmarter business decisions. Analytics
is all about understanding the customer journey. The more
advanced your analytics maturity, the greater your ability to
transform customer data into actionable insights that
strategically drive marketing performance.
“Companies with greater digital capabilities were
able to convert sales at a rate 2.5 times greater
than companies at the lower level did.”
McKinsey & Co. March 2015
You can go here to take the assessment.
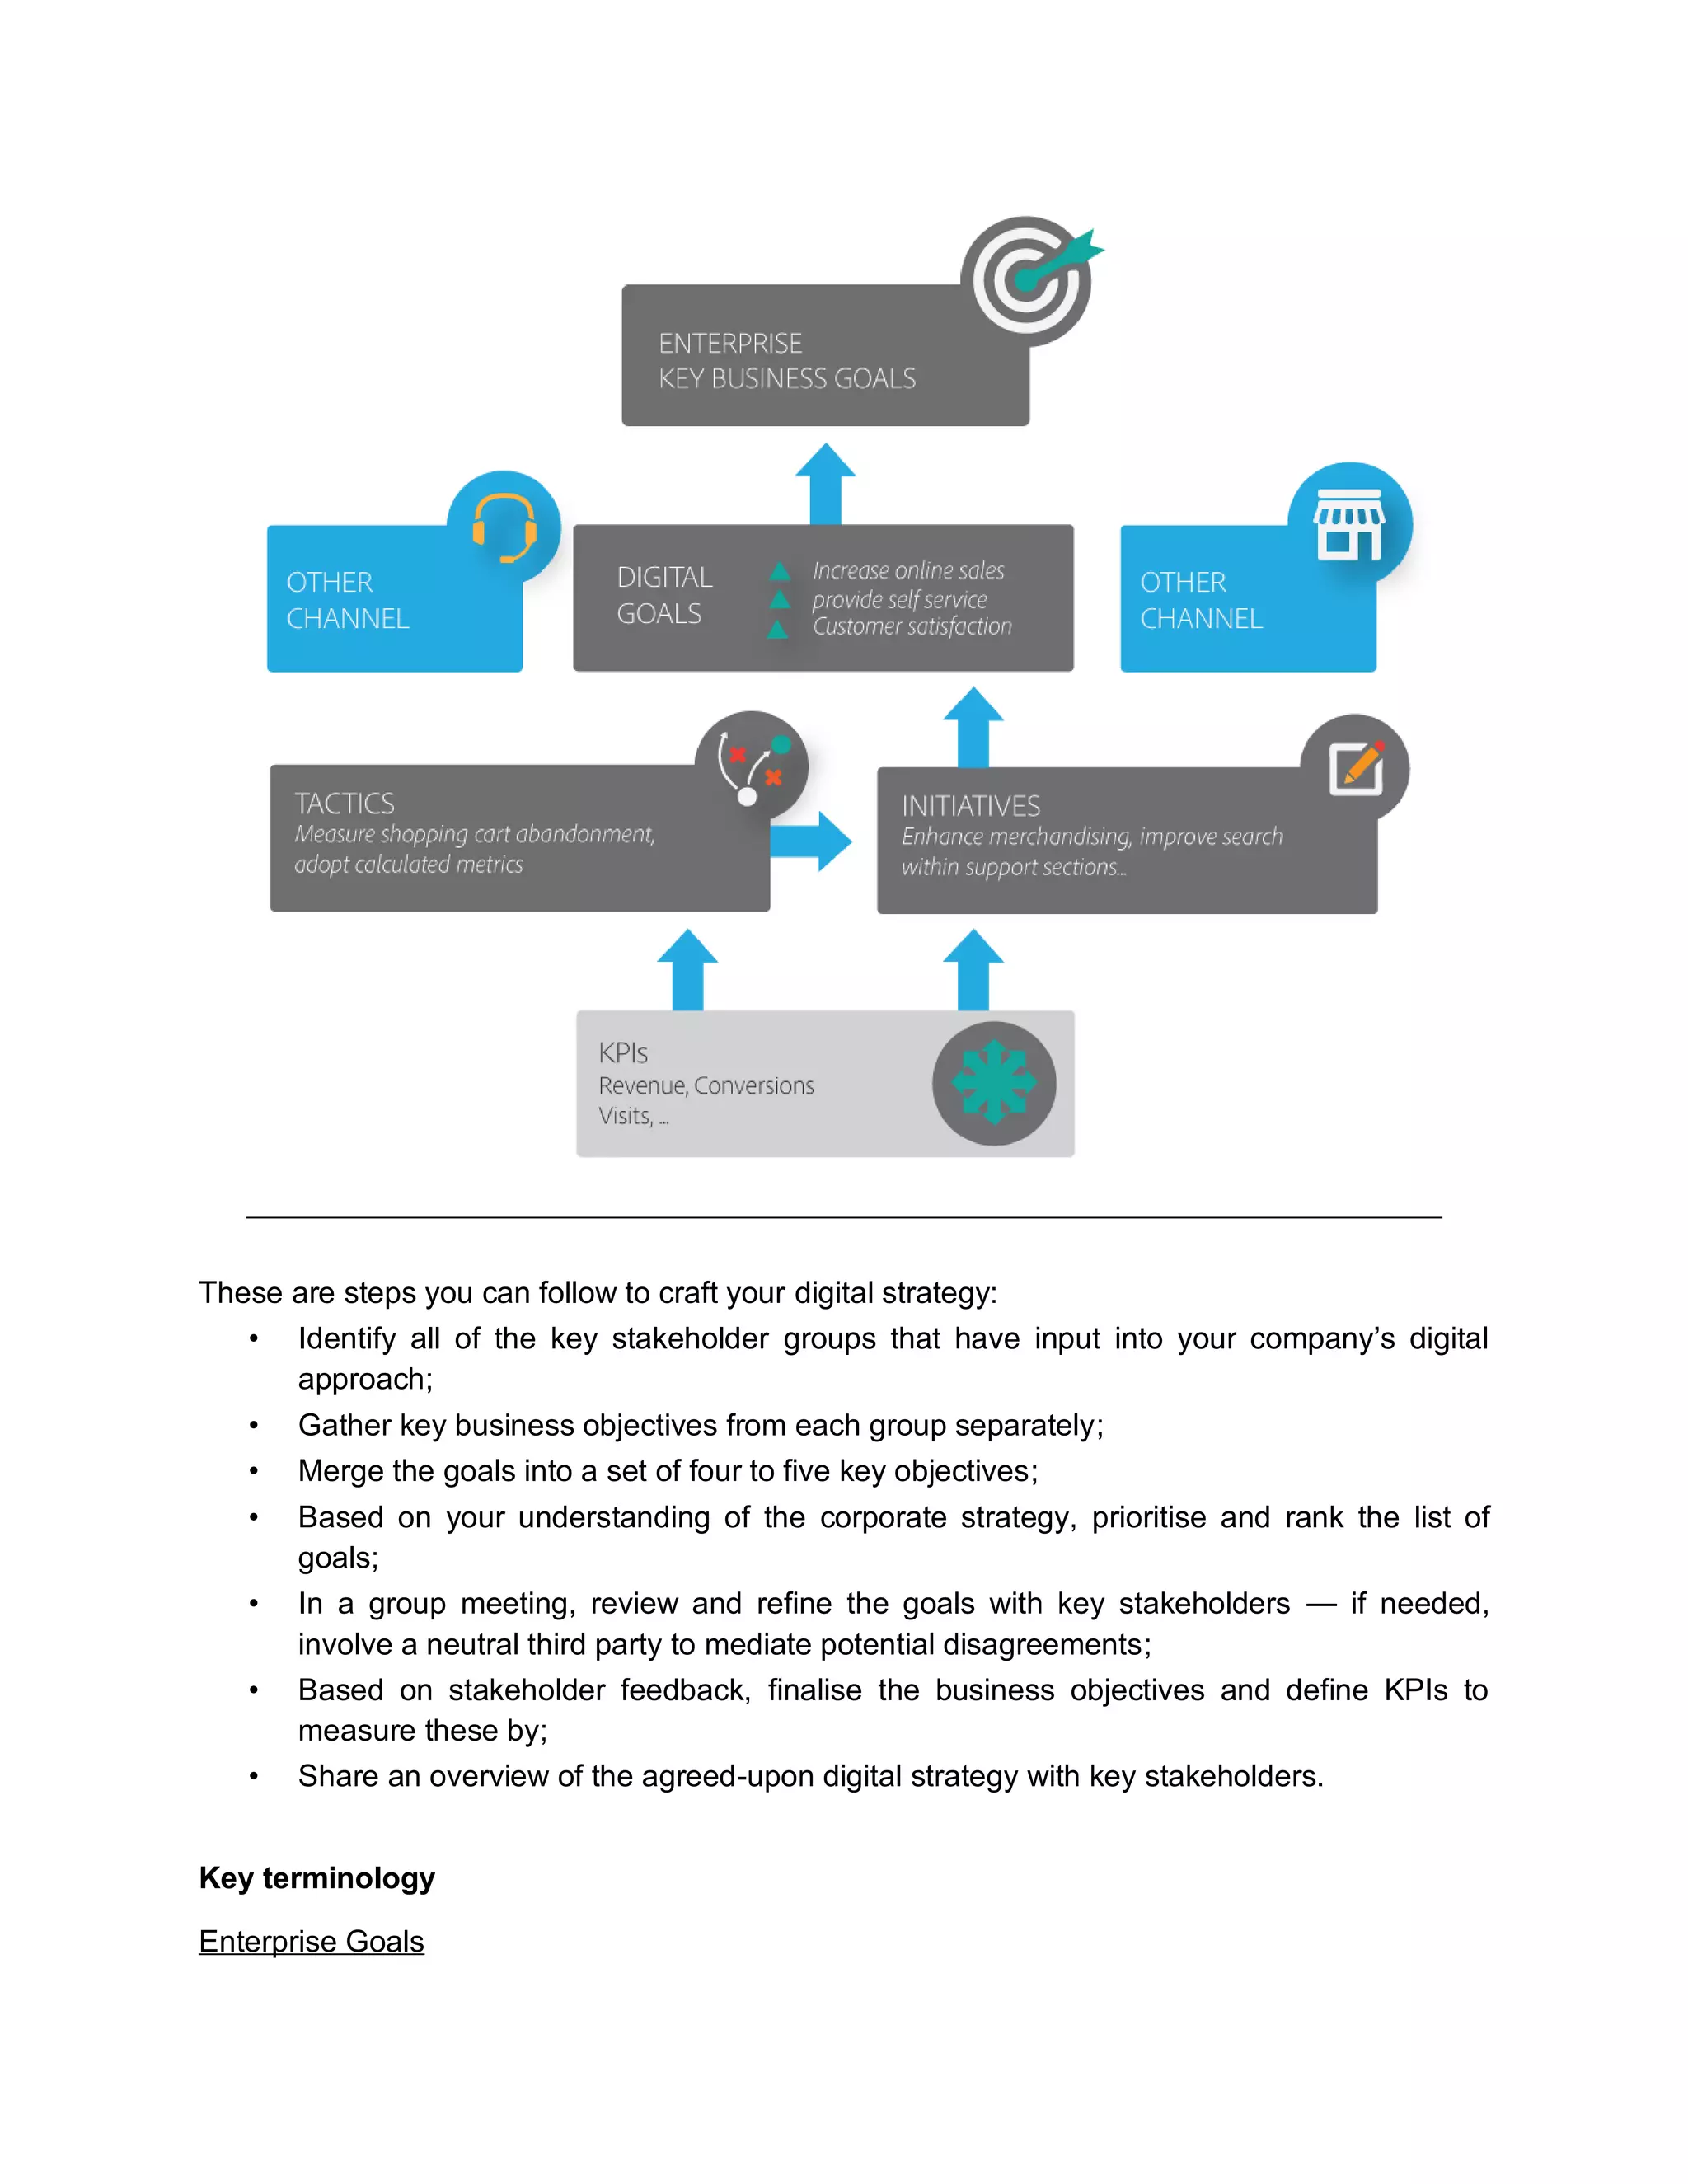
3.2 Digital Strategy
One of the biggest digital challenges organisations face is being able to define what they are
trying to achieve through digital channels. In many cases, corporate web sites aren’t owned by a
single person or business unit, leading to a mix of different or — even worse — competing
interests and purposes. This causes a mixture of counterproductive results.
A clear digital strategy enables your digital team to align its activities to the key priorities of your
business and succeed as an integral part of your organisation. A key point to consider is that
your digital strategy should always be aligned to the overall business goals of the organisation.
A Suggested Digital Strategy Framework
Put a reminder in your
diary to perform this
measurement
quarterly to track your
progress
25.
These are stepsyou can follow to craft your digital strategy:
• Identify all of the key stakeholder groups that have input into your company’s digital
approach;
• Gather key business objectives from each group separately;
• Merge the goals into a set of four to five key objectives;
• Based on your understanding of the corporate strategy, prioritise and rank the list of
goals;
• In a group meeting, review and refine the goals with key stakeholders — if needed,
involve a neutral third party to mediate potential disagreements;
• Based on stakeholder feedback, finalise the business objectives and define KPIs to
measure these by;
• Share an overview of the agreed-upon digital strategy with key stakeholders.
Key terminology
Enterprise Goals
26.
• Strategic businessgoals and objectives
• Aligned across the business at an enterprise level
• Tied to increased revenue (or decreased costs)
• Can include medium- to long-term vision of the company
Examples: Increase revenue (by five per cent), expand product line (new line of business),
improve customer satisfaction (by five per cent)
Digital Goals
• Strategic business goals and objectives for your digital channel
• Identify how the digital channel will contribute to achieving the Enterprise Goals
• There can be more than one Digital Goal for each Enterprise Goal
Examples: Increase online sales (by five per cent), increase online audience (by ten per cent),
increase online customer satisfaction (by five per cent).
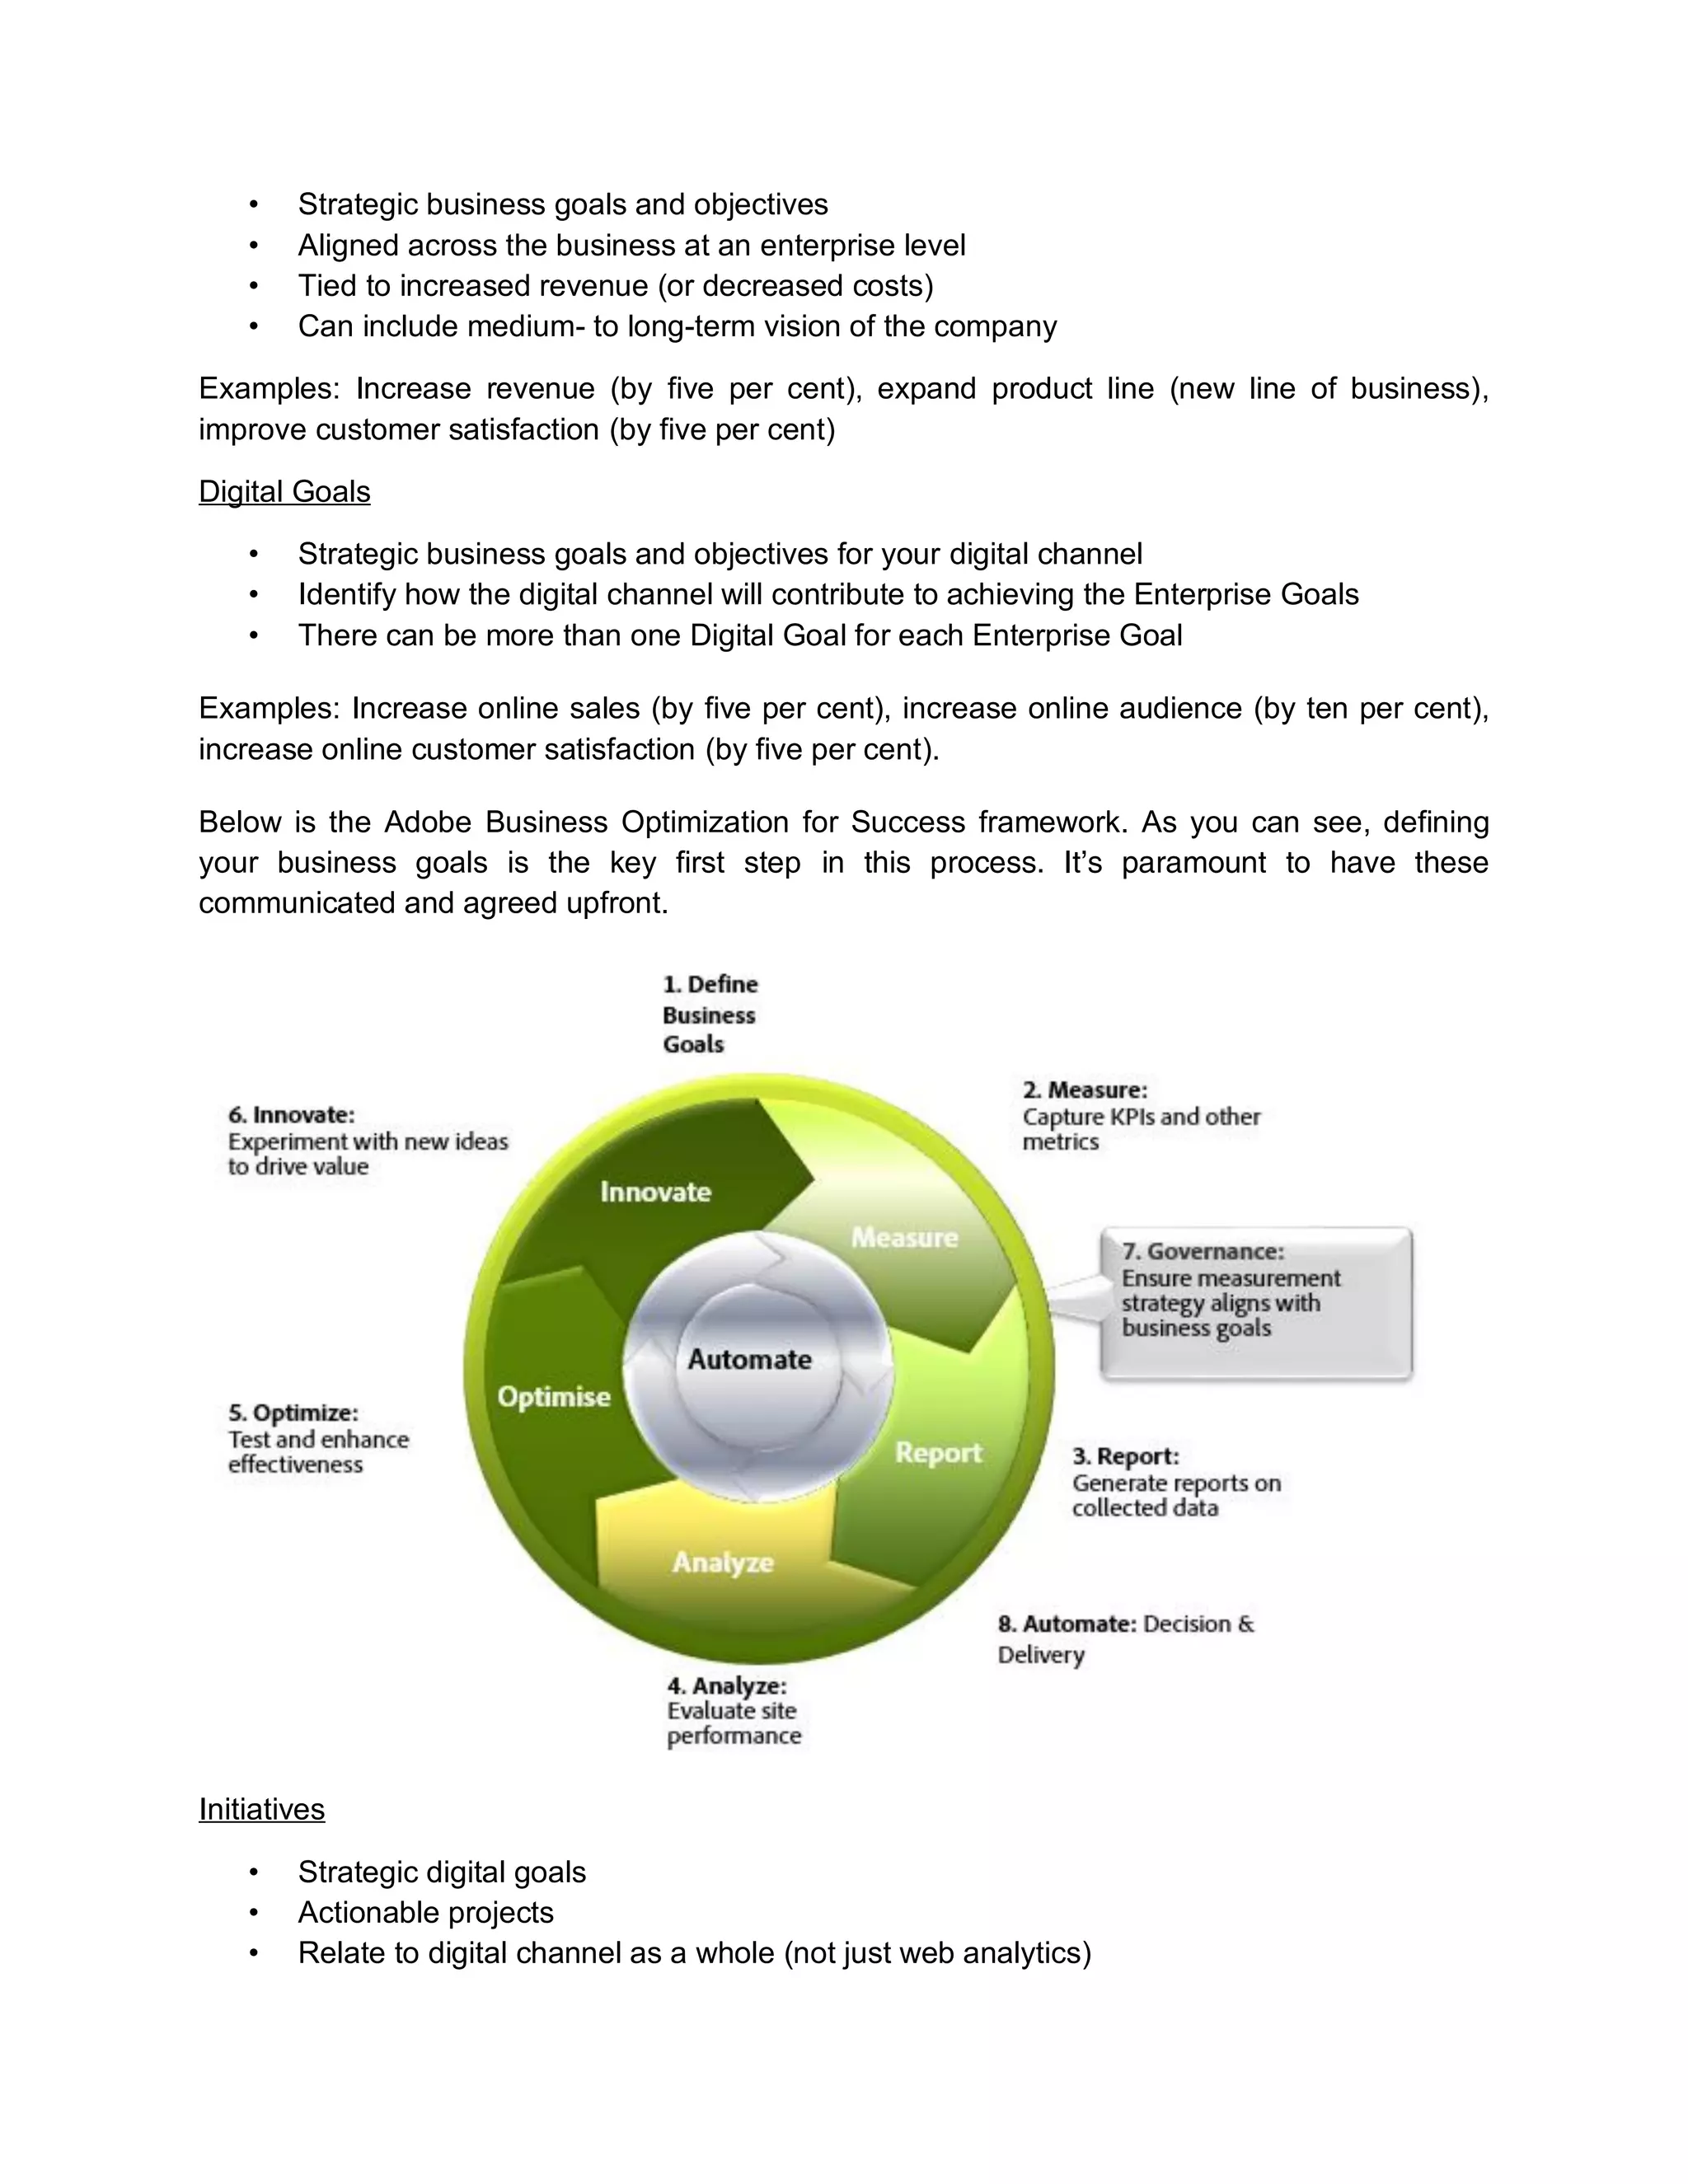
Below is the Adobe Business Optimization for Success framework. As you can see, defining
your business goals is the key first step in this process. It’s paramount to have these
communicated and agreed upfront.
Initiatives
• Strategic digital goals
• Actionable projects
• Relate to digital channel as a whole (not just web analytics)
27.
Examples: Reduce shoppingcart abandonment, increase mobile content, increase new visitors.
Tactics
• Specific actionable online business requirements
• Gaps in achieving online initiatives and goals
• Achievable end goal
Examples: Measure shopping cart abandonment, measure application form abandonment,
report mobile usage
Key Performance Indicator (KPI)
Key metric to evaluate business success of digital activities
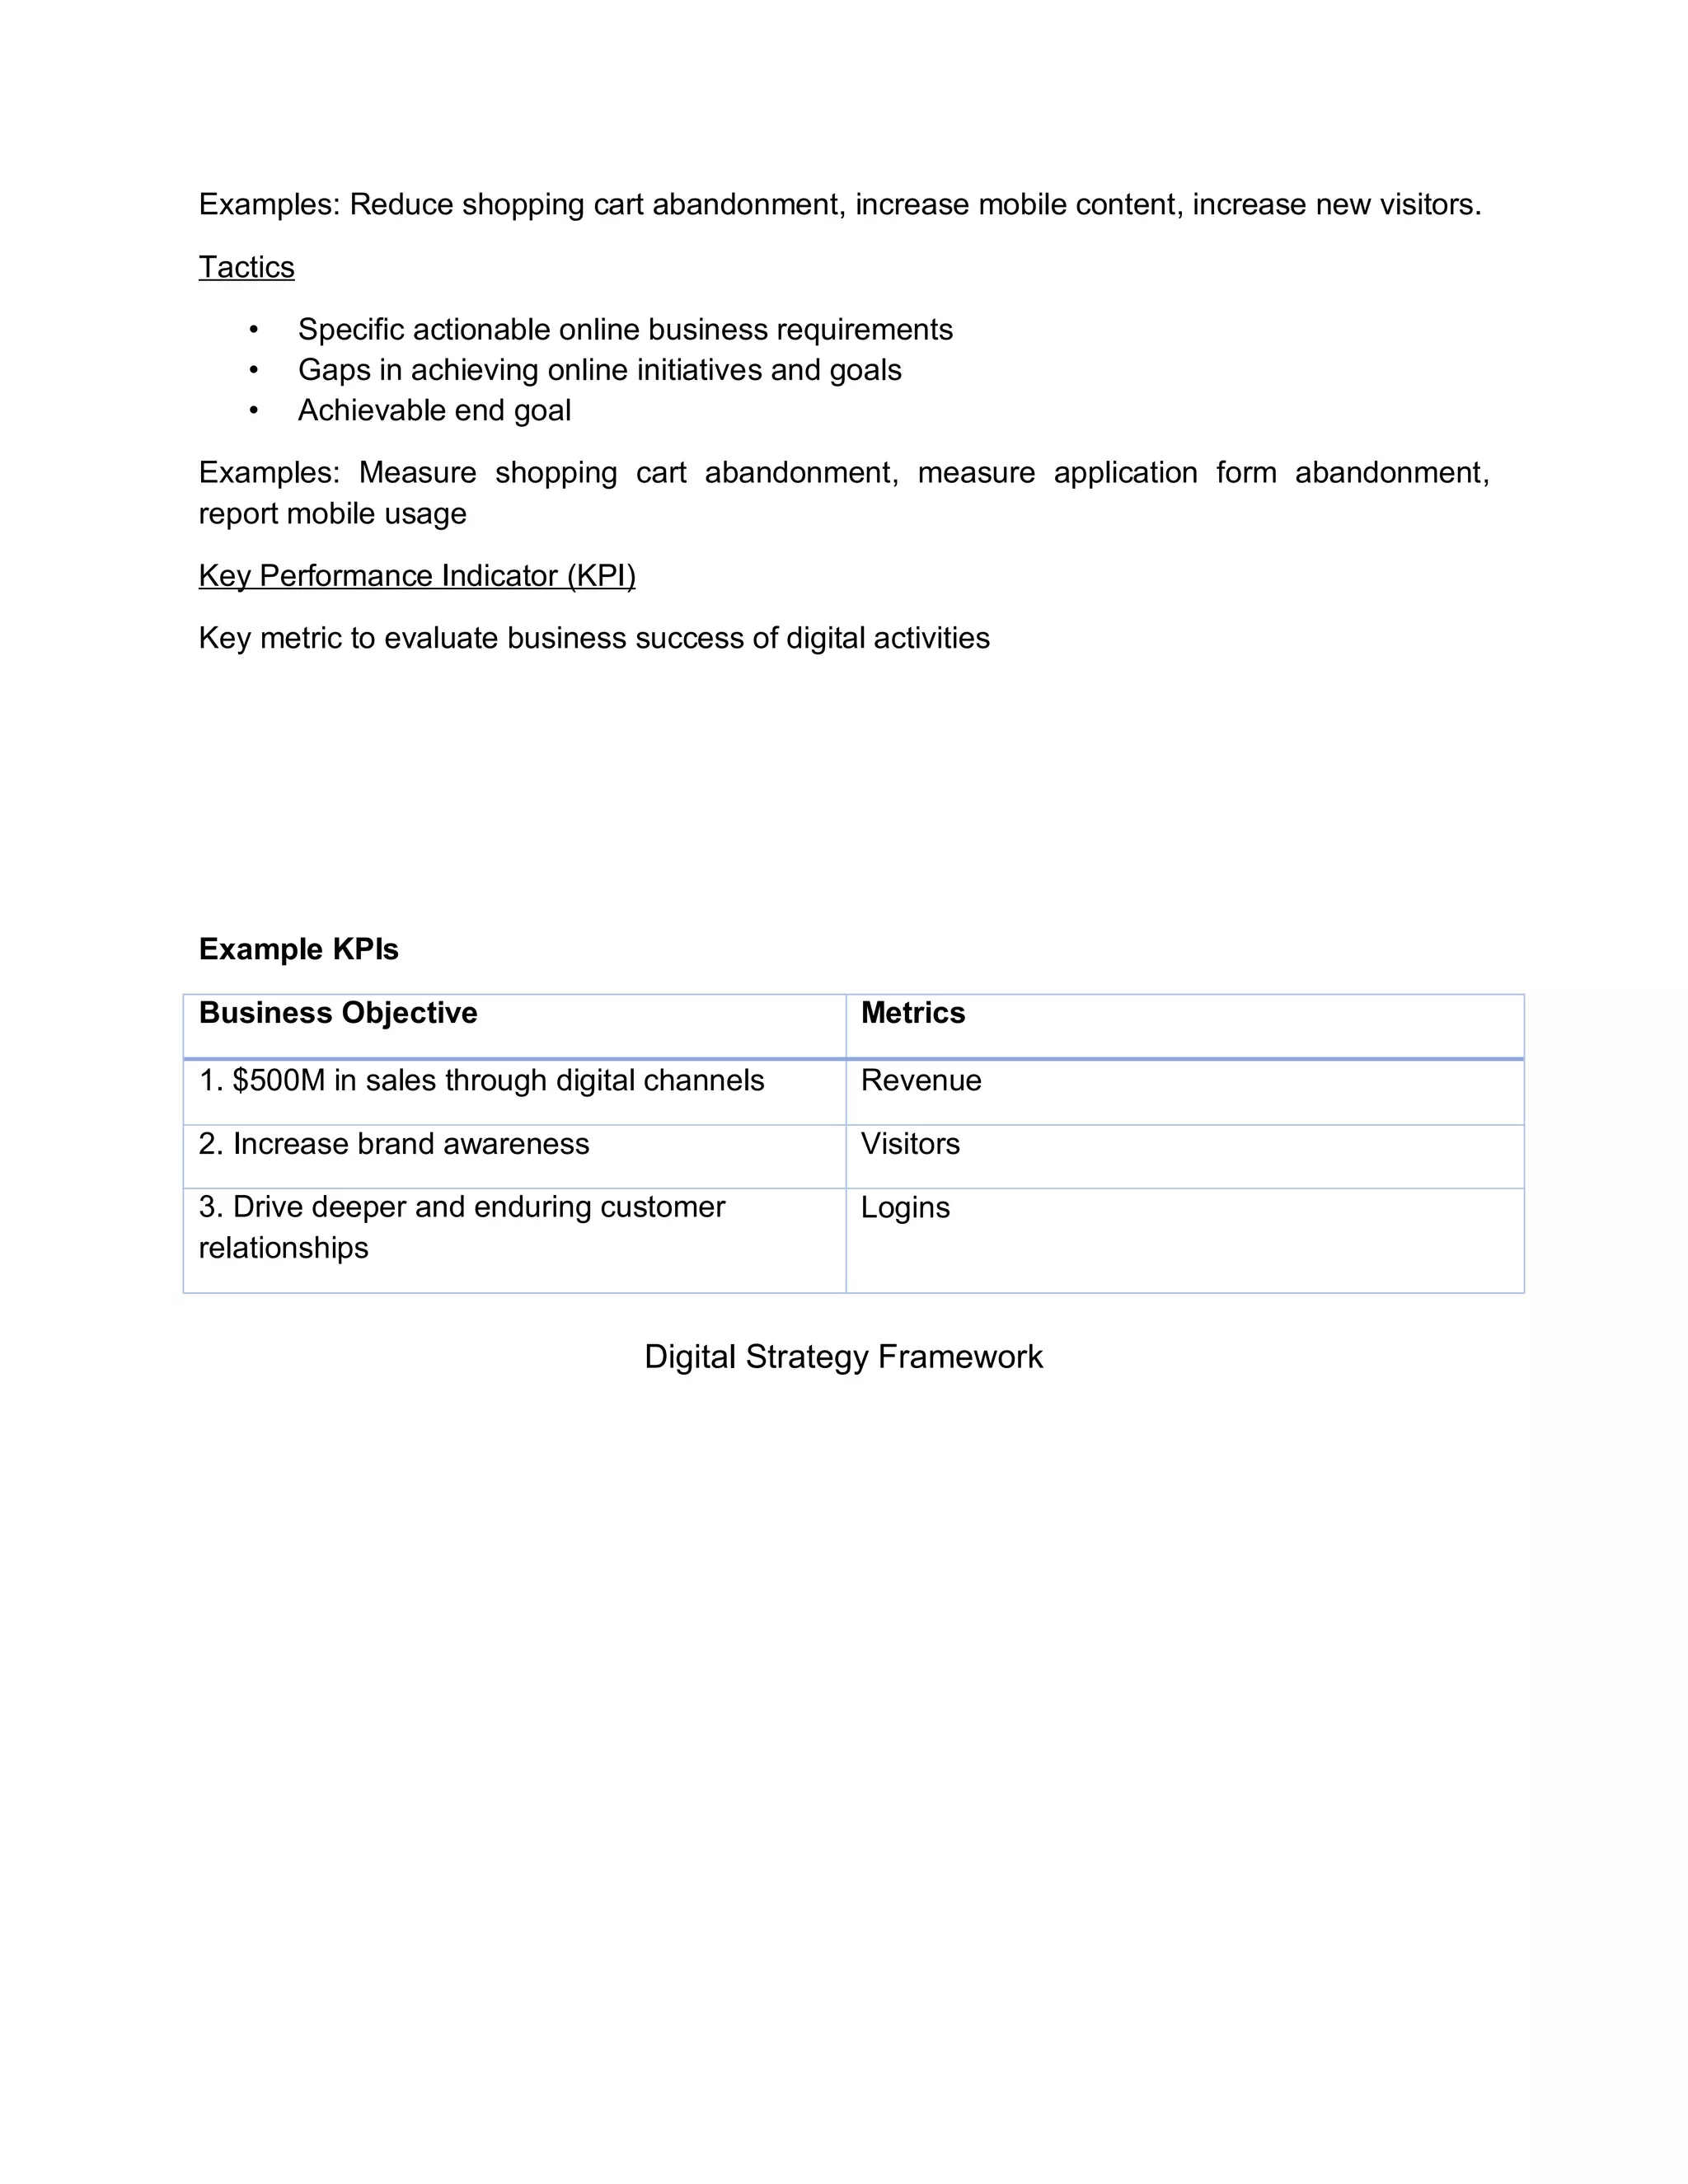
Example KPIs
Business Objective Metrics
1. $500M in sales through digital channels Revenue
2. Increase brand awareness Visitors
3. Drive deeper and enduring customer
relationships
Logins
Digital Strategy Framework
28.
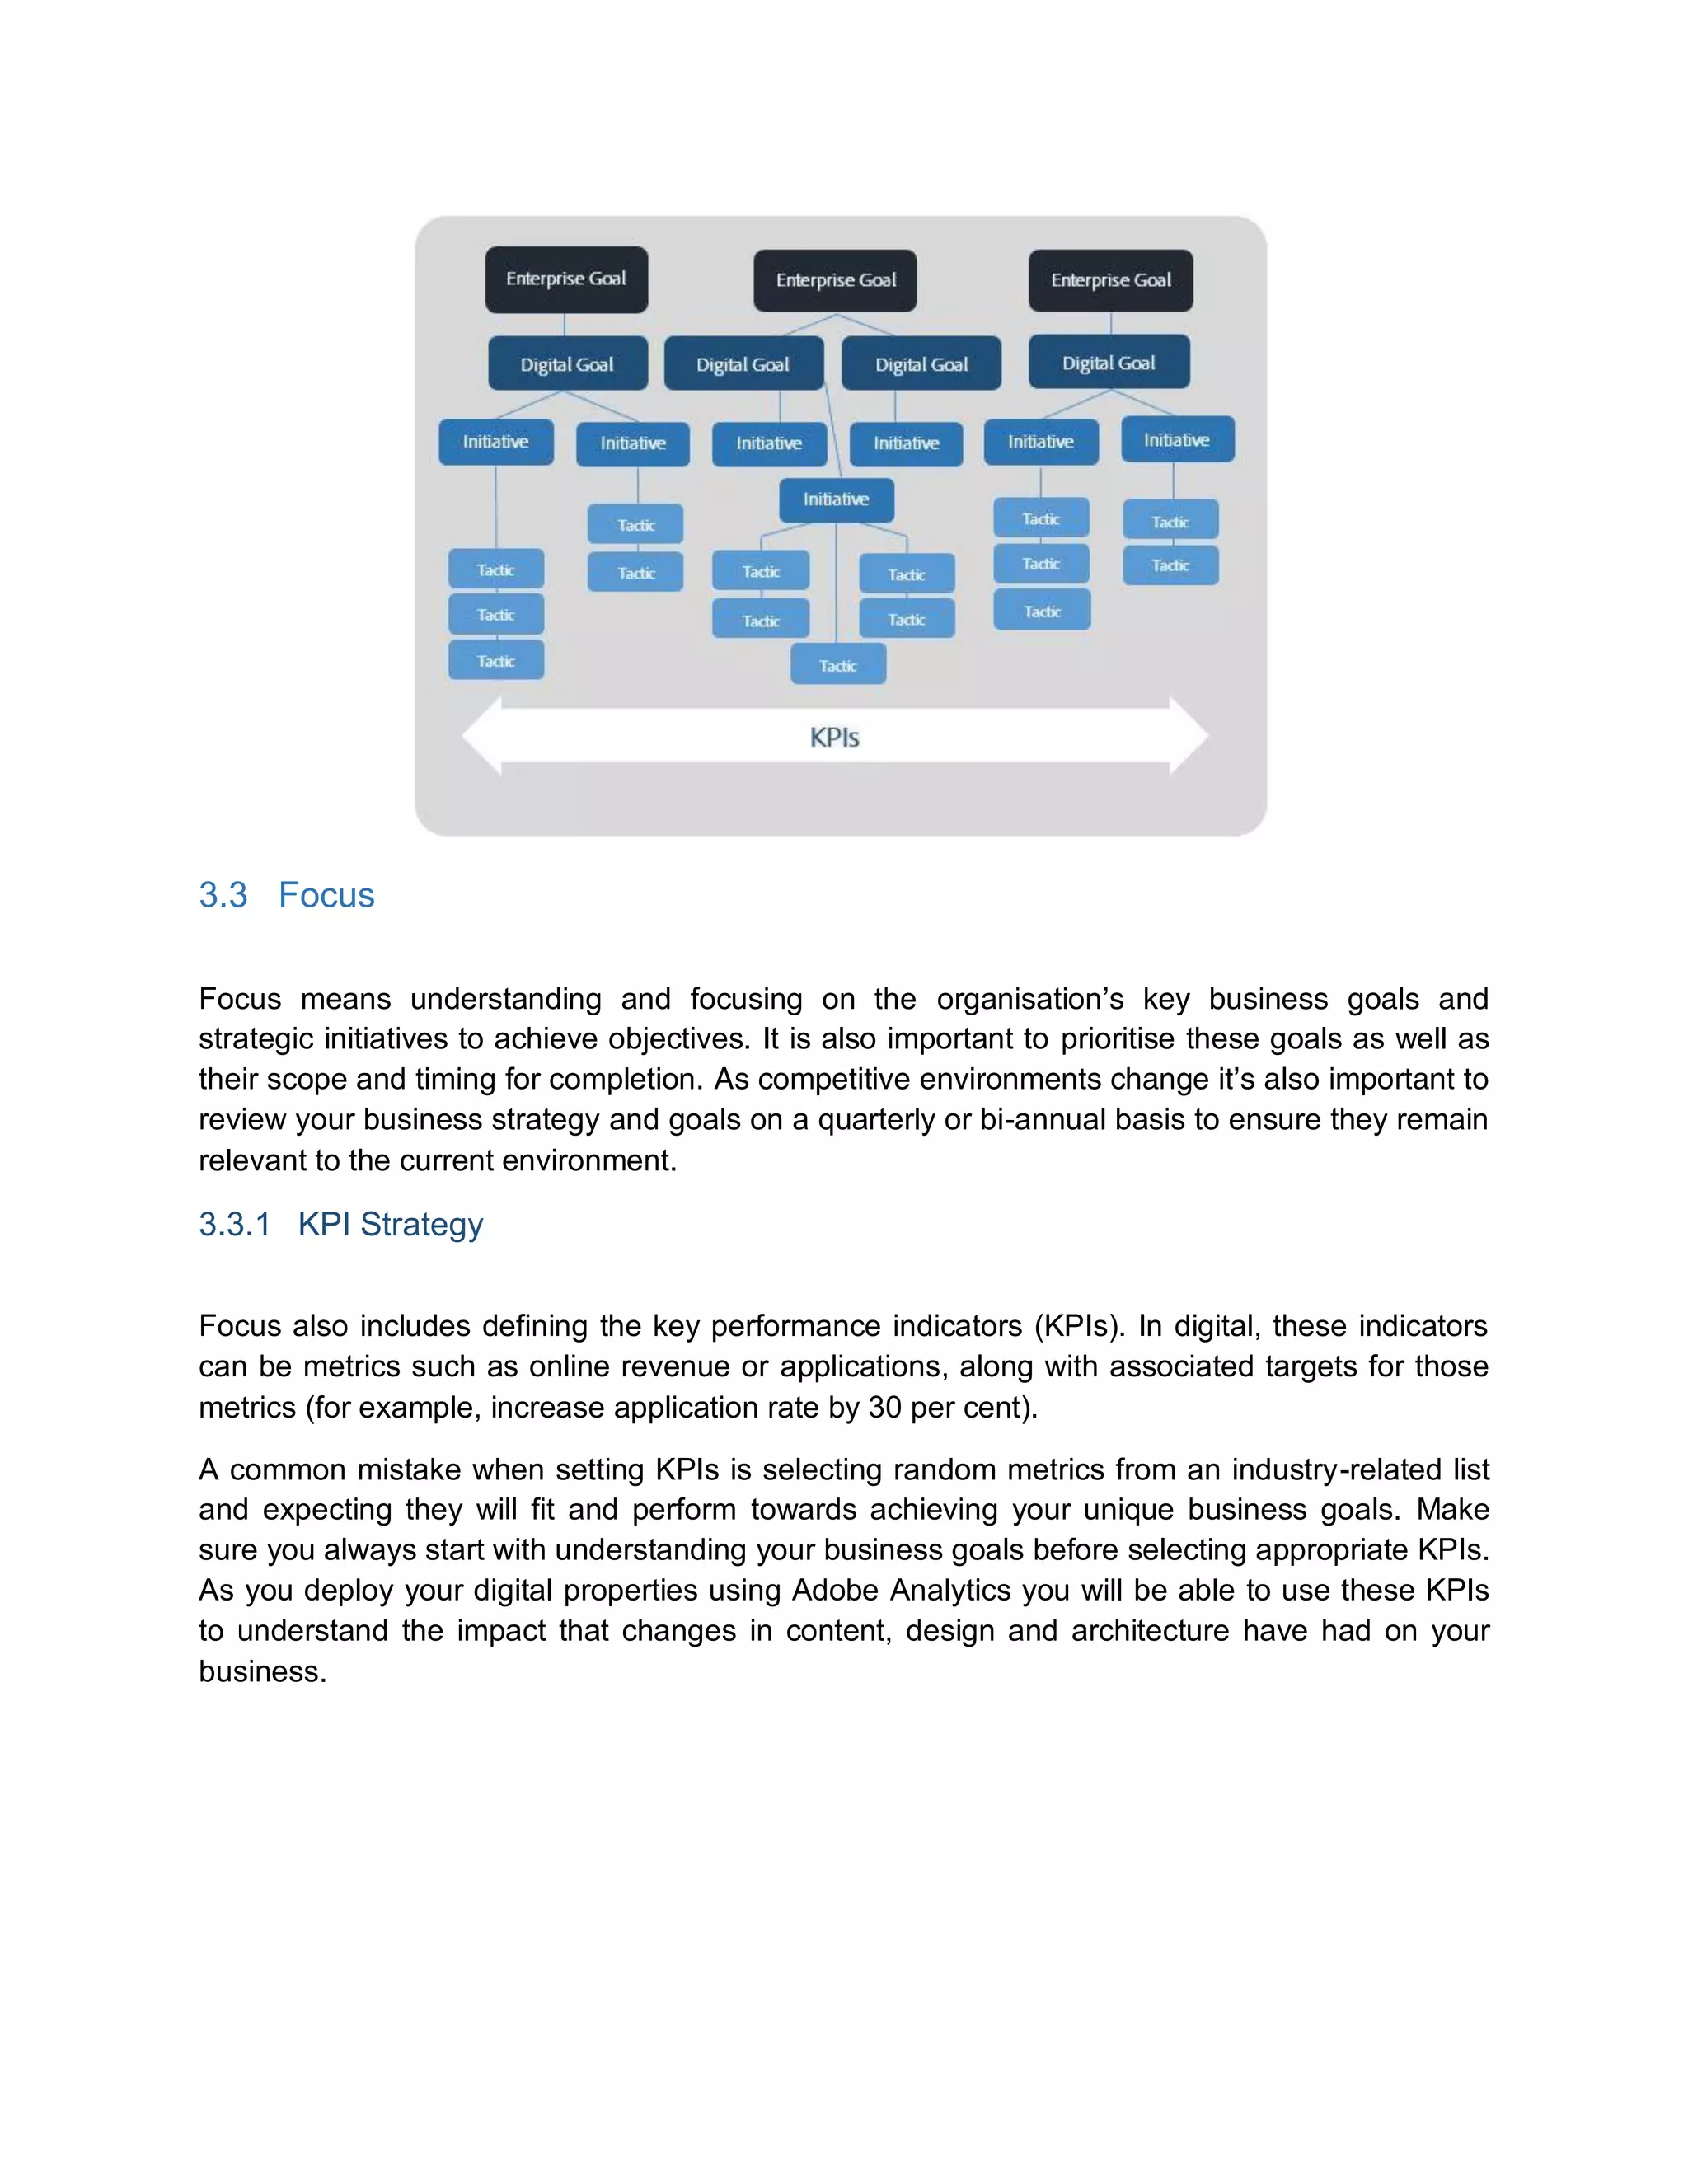
3.3 Focus
Focus meansunderstanding and focusing on the organisation’s key business goals and
strategic initiatives to achieve objectives. It is also important to prioritise these goals as well as
their scope and timing for completion. As competitive environments change it’s also important to
review your business strategy and goals on a quarterly or bi-annual basis to ensure they remain
relevant to the current environment.
3.3.1 KPI Strategy
Focus also includes defining the key performance indicators (KPIs). In digital, these indicators
can be metrics such as online revenue or applications, along with associated targets for those
metrics (for example, increase application rate by 30 per cent).
A common mistake when setting KPIs is selecting random metrics from an industry-related list
and expecting they will fit and perform towards achieving your unique business goals. Make
sure you always start with understanding your business goals before selecting appropriate KPIs.
As you deploy your digital properties using Adobe Analytics you will be able to use these KPIs
to understand the impact that changes in content, design and architecture have had on your
business.
29.
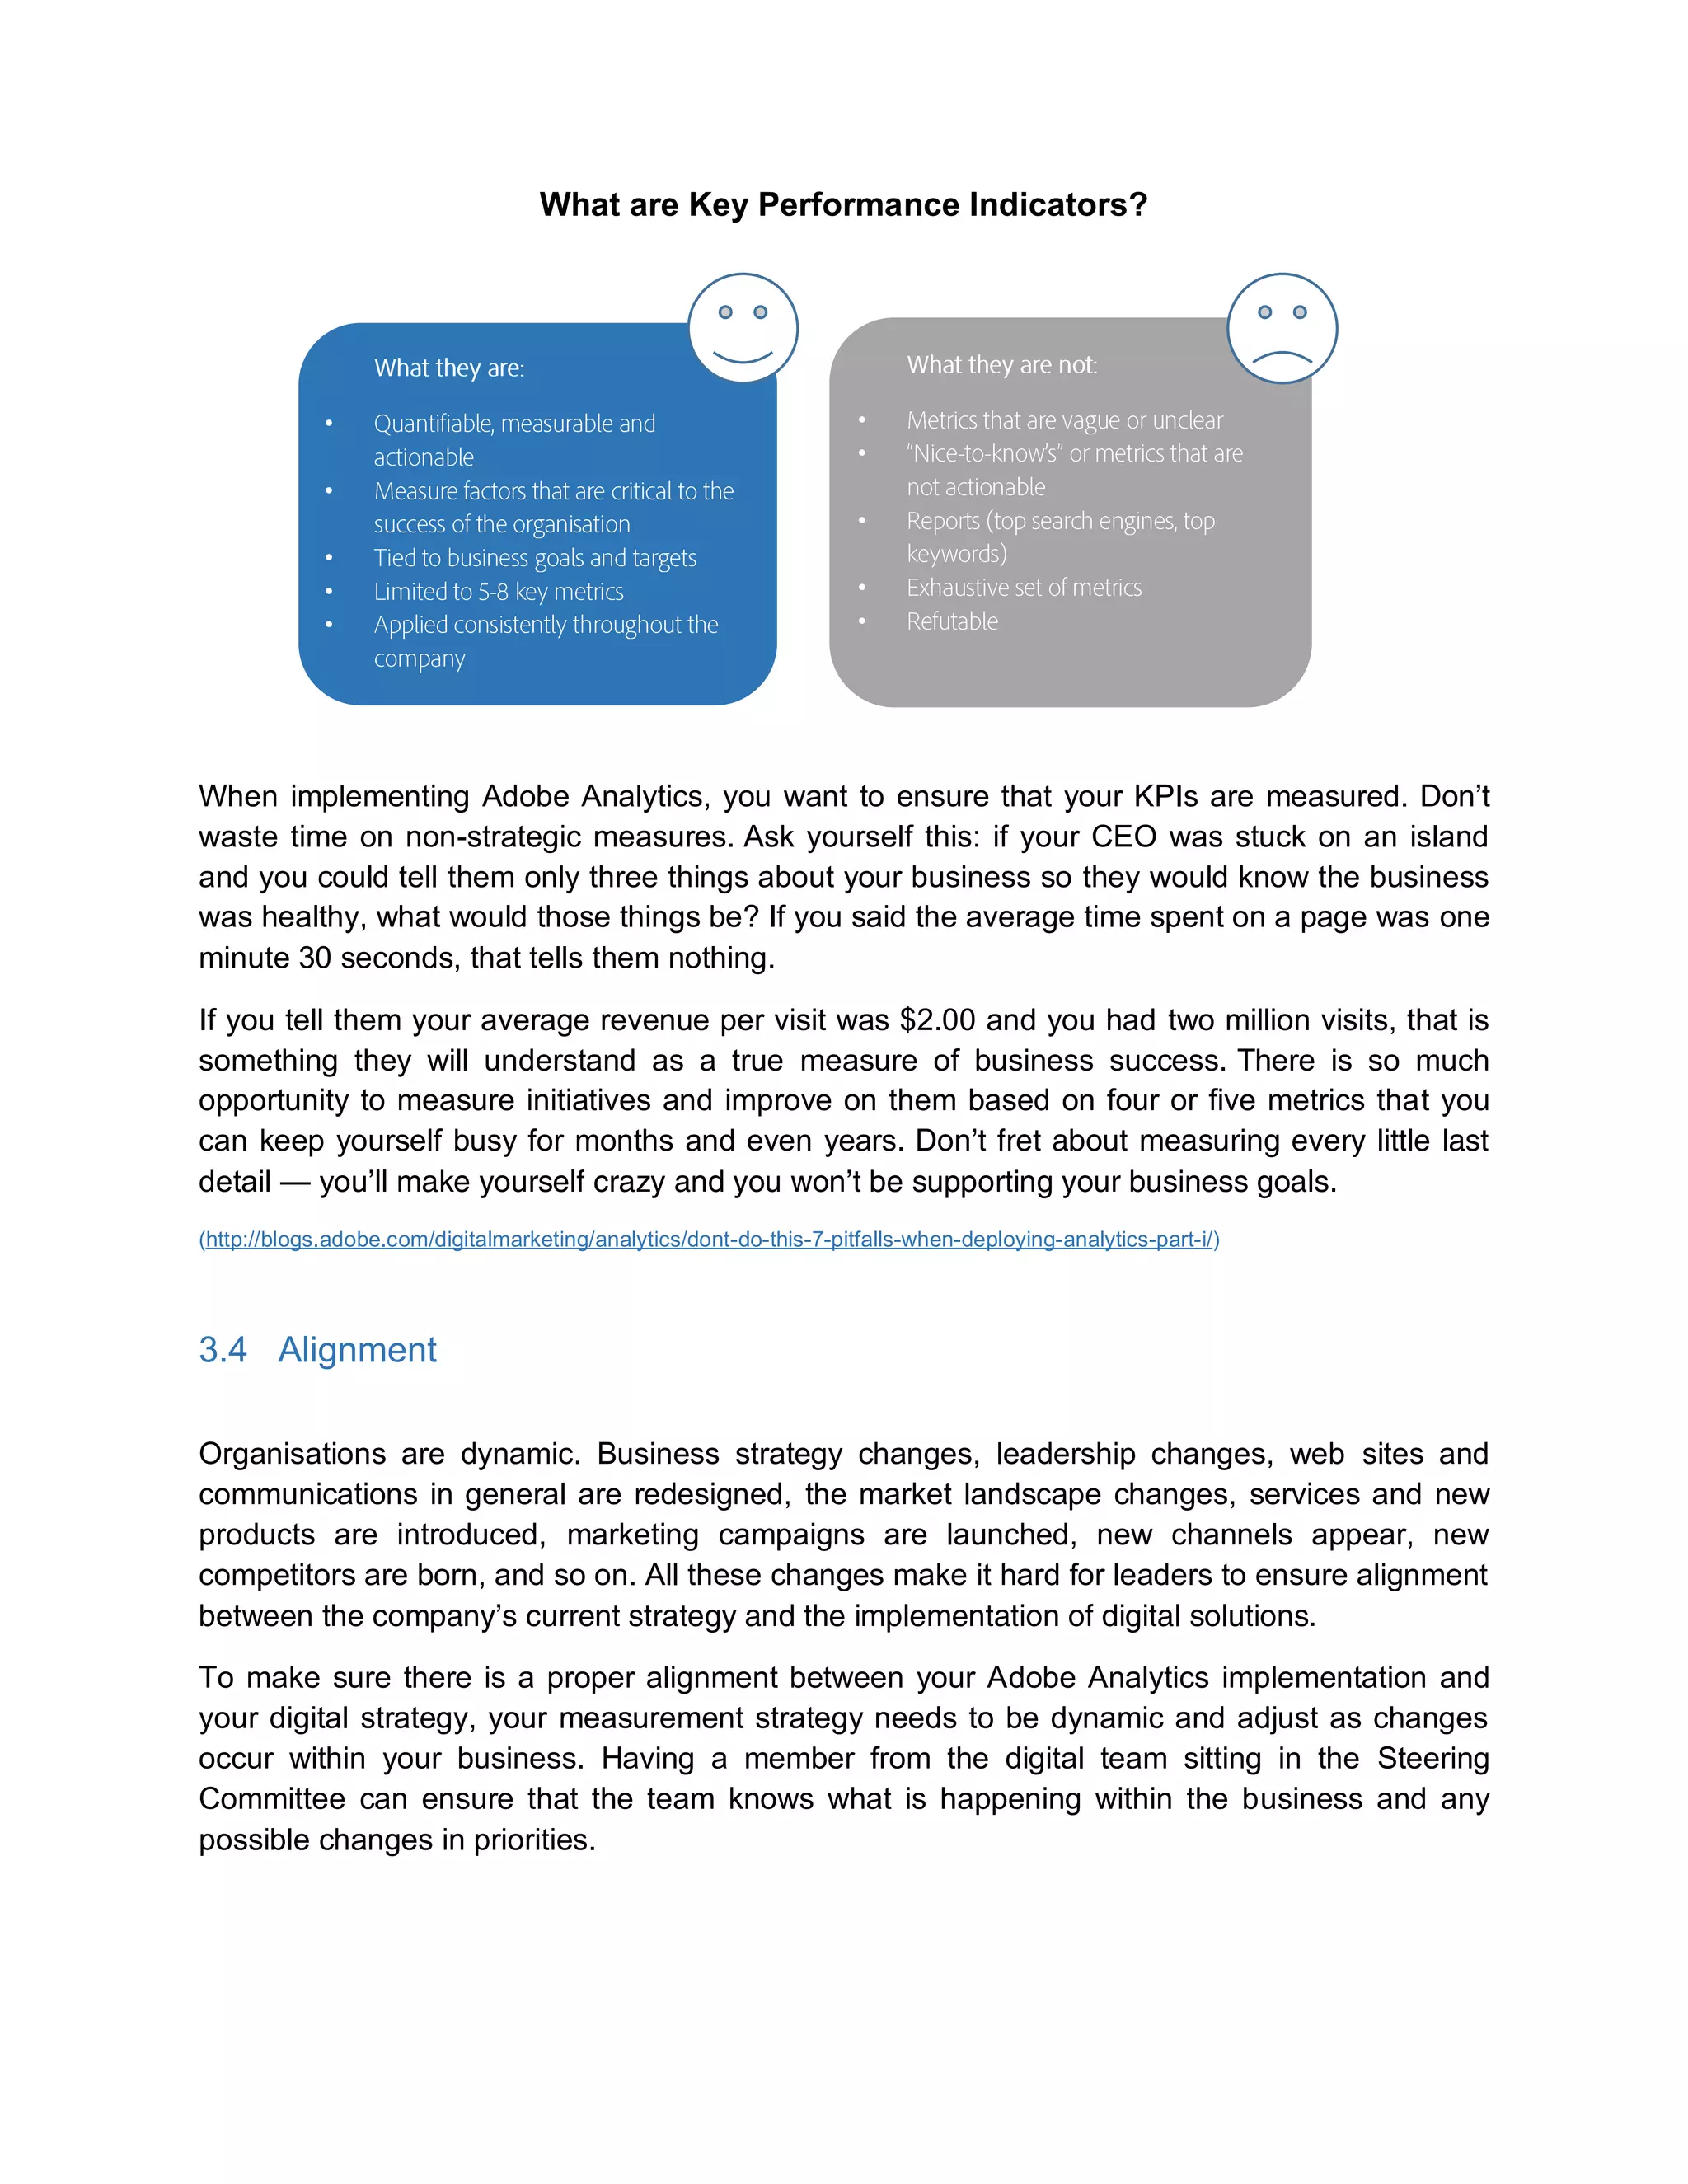
What are KeyPerformance Indicators?
When implementing Adobe Analytics, you want to ensure that your KPIs are measured. Don’t
waste time on non-strategic measures. Ask yourself this: if your CEO was stuck on an island
and you could tell them only three things about your business so they would know the business
was healthy, what would those things be? If you said the average time spent on a page was one
minute 30 seconds, that tells them nothing.
If you tell them your average revenue per visit was $2.00 and you had two million visits, that is
something they will understand as a true measure of business success. There is so much
opportunity to measure initiatives and improve on them based on four or five metrics that you
can keep yourself busy for months and even years. Don’t fret about measuring every little last
detail — you’ll make yourself crazy and you won’t be supporting your business goals.
(http://blogs.adobe.com/digitalmarketing/analytics/dont-do-this-7-pitfalls-when-deploying-analytics-part-i/)
3.4 Alignment
Organisations are dynamic. Business strategy changes, leadership changes, web sites and
communications in general are redesigned, the market landscape changes, services and new
products are introduced, marketing campaigns are launched, new channels appear, new
competitors are born, and so on. All these changes make it hard for leaders to ensure alignment
between the company’s current strategy and the implementation of digital solutions.
To make sure there is a proper alignment between your Adobe Analytics implementation and
your digital strategy, your measurement strategy needs to be dynamic and adjust as changes
occur within your business. Having a member from the digital team sitting in the Steering
Committee can ensure that the team knows what is happening within the business and any
possible changes in priorities.
•
•
•
•
•
•
•
•
•
•
30.
3.4.1 Measurement Strategy
Adigital measurement strategy is a clear, cohesive strategy for measuring online business
performance against business objectives. It encapsulates the organisation’s current online
business objectives and strategy, KPIs, and other unique reporting requirements.
Why do we need a measurement strategy?
• Gain a clearer understanding of your company’s online business performance. Without
well-defined KPIs, you’re not going to understand business performance and take
appropriate action.
• Achieve greater buy-in and adoption by involving key executives and stakeholders in
the requirements-gathering phase.
• Align your organisation around shared measurement objectives that are tied to key
business goals. Having everyone focused on what’s most important to the business is
extremely valuable.
• Avoid costly missteps that may require re-implementation and delay “time-to-value”.
Measure twice, cut once.
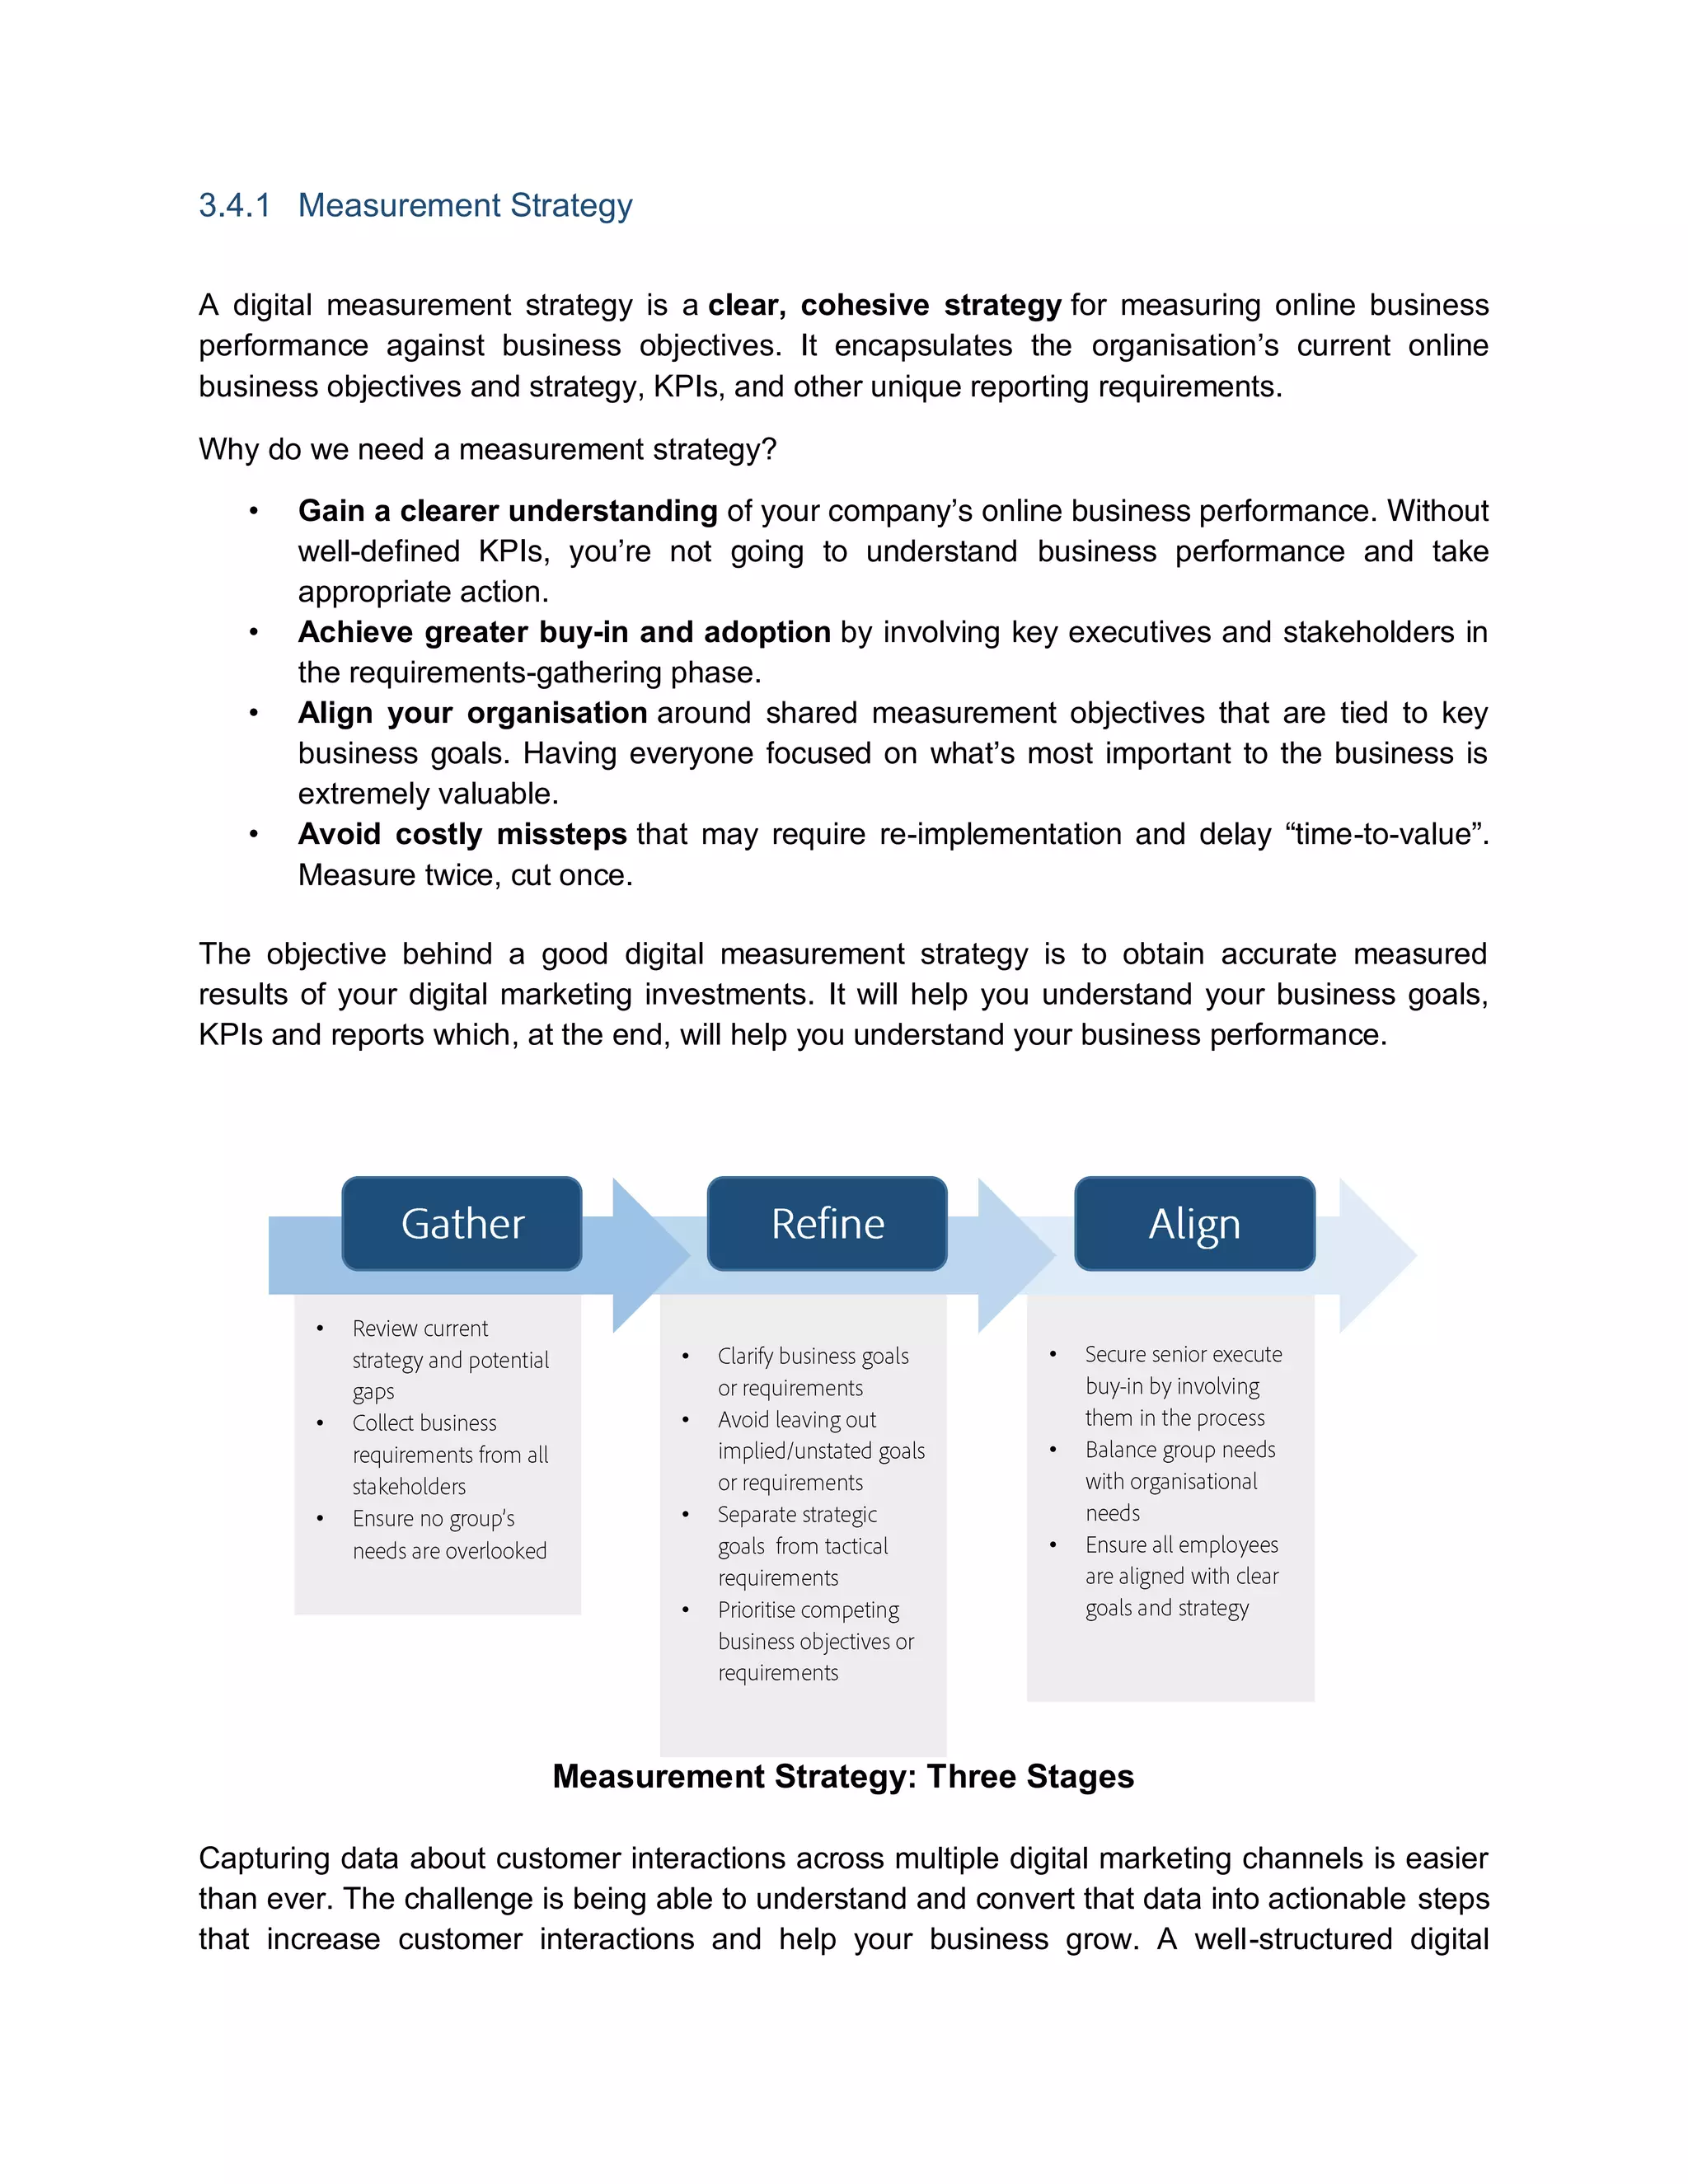
The objective behind a good digital measurement strategy is to obtain accurate measured
results of your digital marketing investments. It will help you understand your business goals,
KPIs and reports which, at the end, will help you understand your business performance.
Measurement Strategy: Three Stages
Capturing data about customer interactions across multiple digital marketing channels is easier
than ever. The challenge is being able to understand and convert that data into actionable steps
that increase customer interactions and help your business grow. A well-structured digital
•
•
•
•
•
•
•
•
•
•
31.
measurement strategy willhelp you plan, organise and coordinate all the necessary elements
needed to manage the big volumes of data being produced, as well as making sure this data is
put to work throughout your organisation.
3.5 Innovation
Once your organisation is successfully collecting the right data on a reliable and consistent
basis, you are in a good position to innovate. This can be accomplished by using this data to
gain competitive advantage. Your organisation will be able to explore new applications and
ways to extract even greater value from your digital data. Your company may even be able to
transform data into unanticipated revenue streams via new products or value-added services for
your customers or partner networks. The opportunities are limitless once the foundational
pieces are in place.
4 People
4.1 Expertise
Expertise refers to the different skills required by your organisation’s digital and technical staff,
business users, and senior executives. Not every group will need the same skills, but an overall
understanding of how a digital strategy and Adobe Analytics will help the organisation is
fundamental.
Investing in training is a key activity when implementing new technologies. Make sure you have
training programs — not only for onboarding new staff, but also for current employees so they
can continue growing their expertise over time.
Adobe offers a wide range of courses that can help you with your Adobe Analytics
implementation, using the solution and driving insights and actions. These courses are available
in multiple formats and are to suit your needs — at one of our regional training centres, online
as virtual learning, or on-site at your company. To see all Adobe Analytics courses go to Adobe
Analytics Course Catalogue.
4.2 Structure
A well designed organisational structure will give you and your staff clear guidelines about how
the organisation is put together, who they have to report and delegate to, and how information
flows across different levels. Defining an organisational structure — including roles and
responsibilities — before starting with your Adobe Analytics implementation will also ensure the
project runs efficiently.
32.
4.2.1 Structure Types
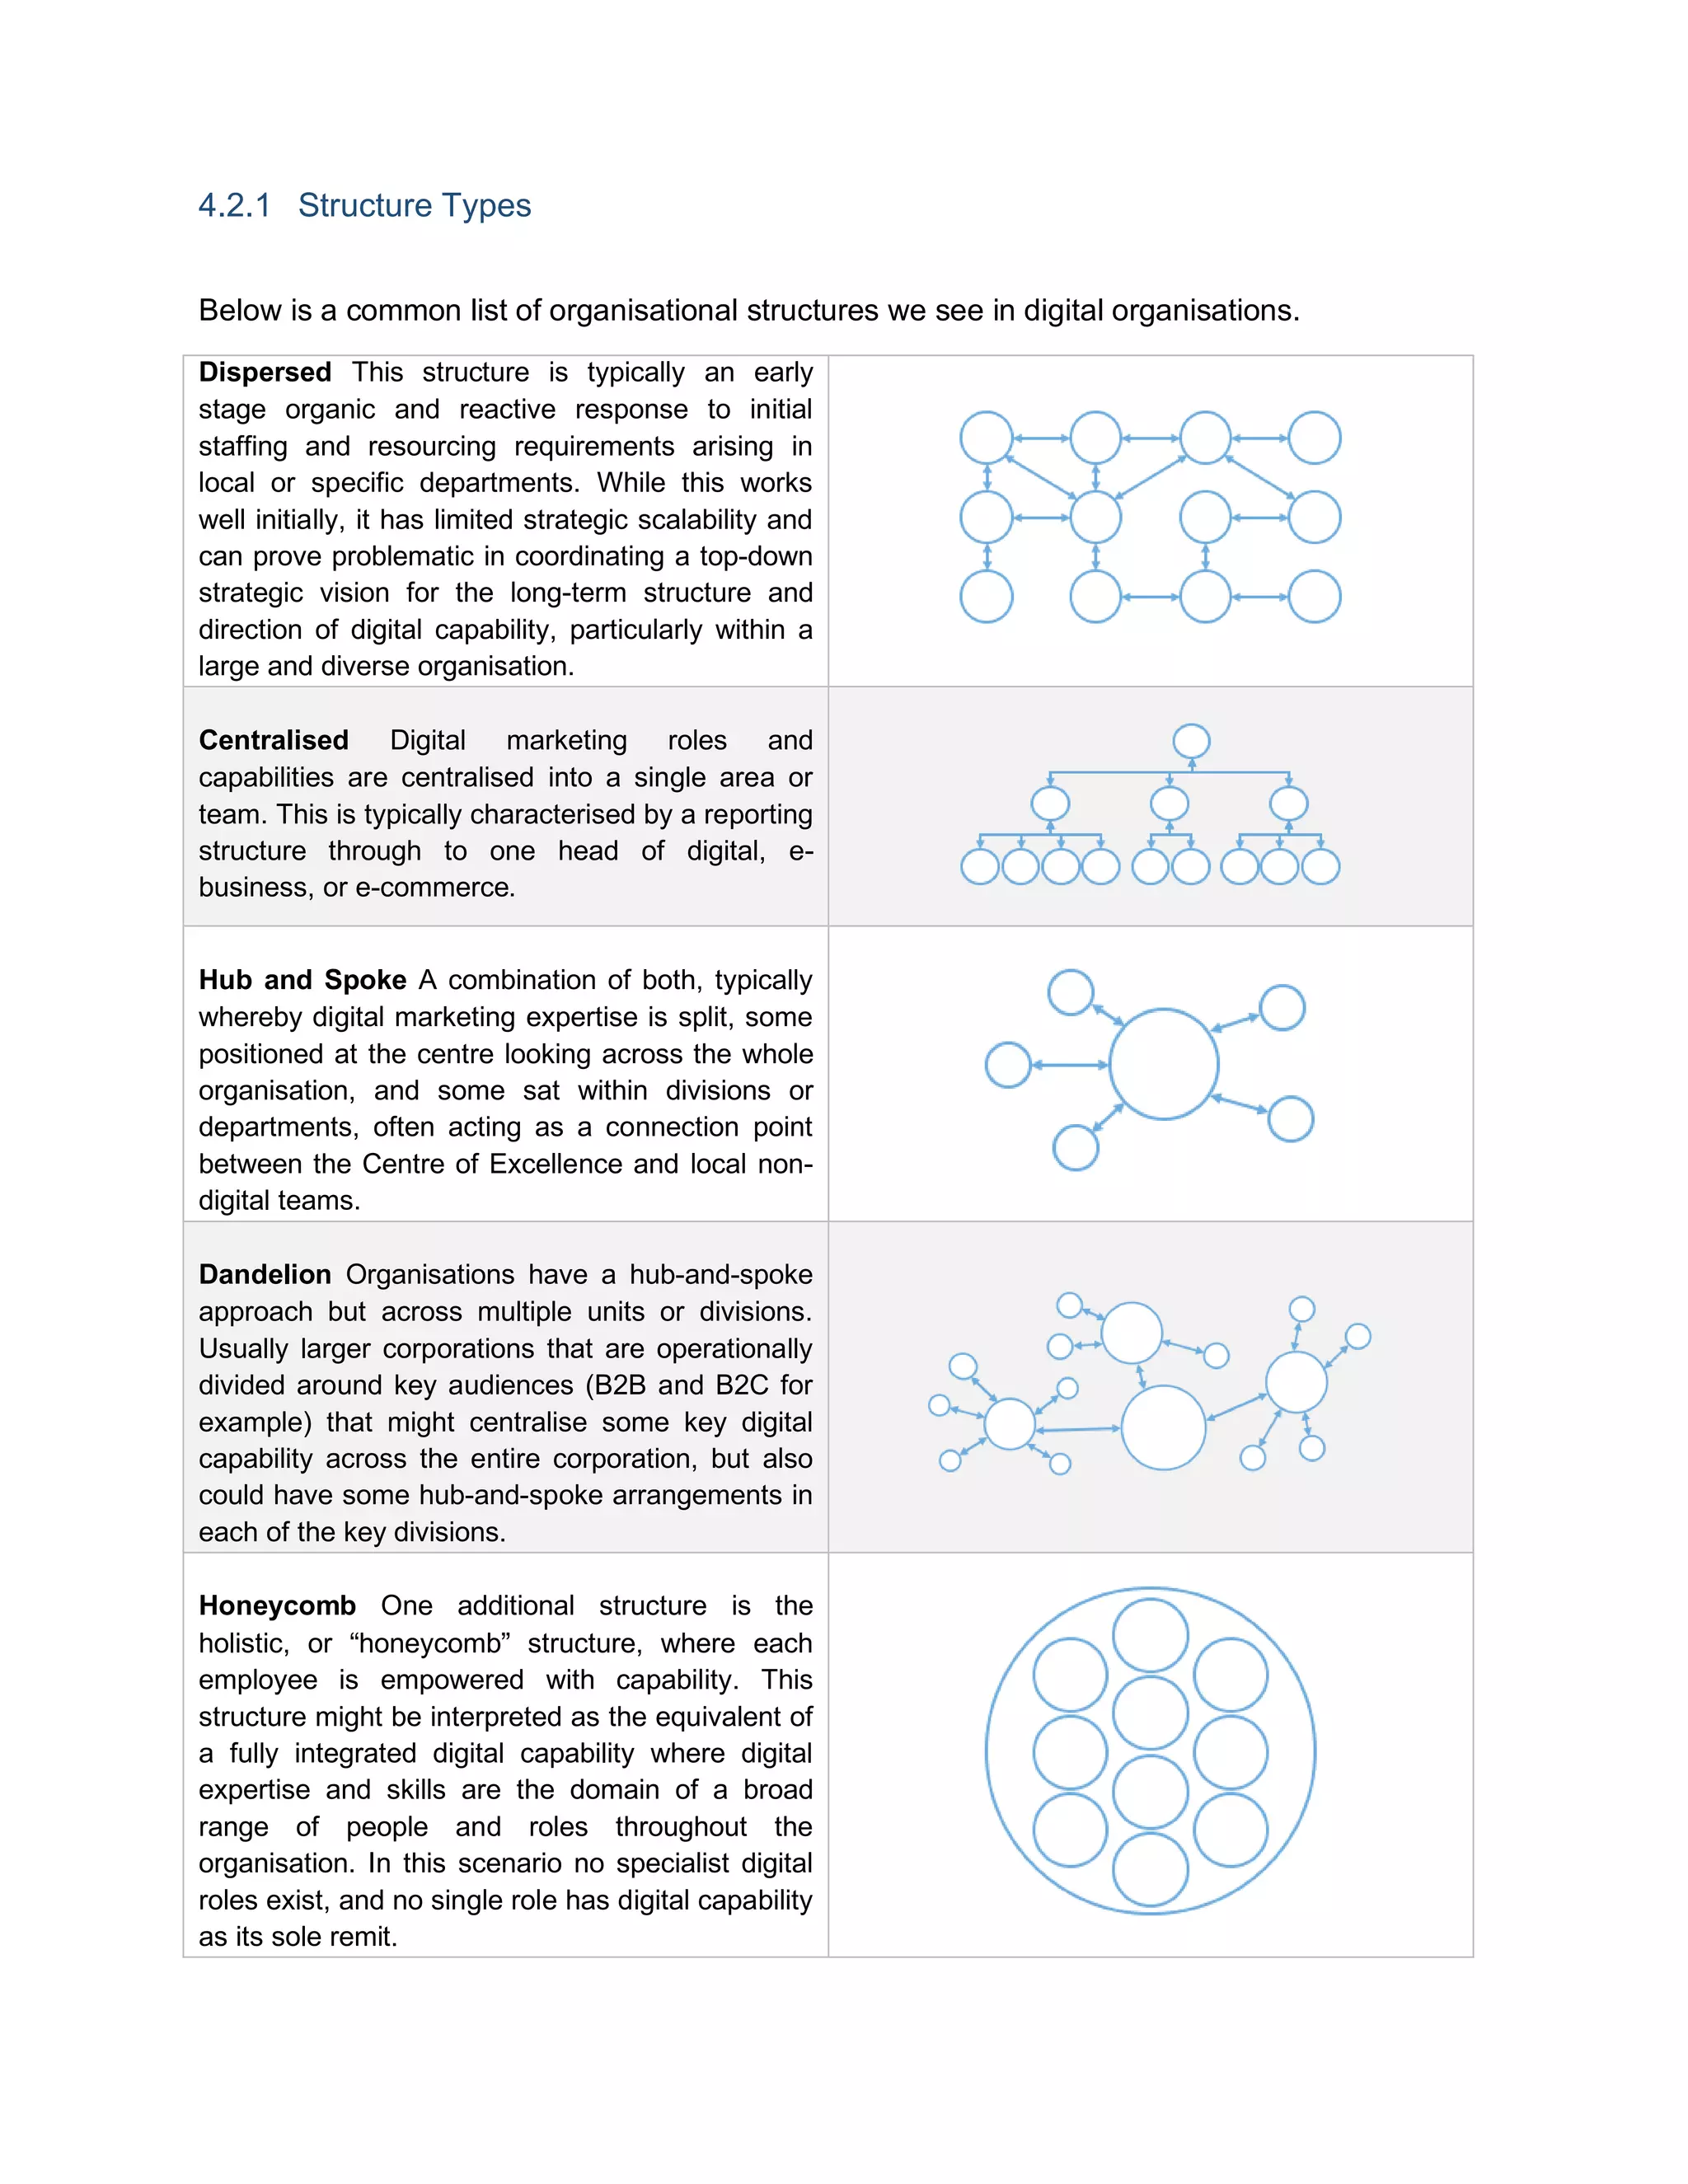
Belowis a common list of organisational structures we see in digital organisations.
Dispersed This structure is typically an early
stage organic and reactive response to initial
staffing and resourcing requirements arising in
local or specific departments. While this works
well initially, it has limited strategic scalability and
can prove problematic in coordinating a top-down
strategic vision for the long-term structure and
direction of digital capability, particularly within a
large and diverse organisation.
Centralised Digital marketing roles and
capabilities are centralised into a single area or
team. This is typically characterised by a reporting
structure through to one head of digital, e-
business, or e-commerce.
Hub and Spoke A combination of both, typically
whereby digital marketing expertise is split, some
positioned at the centre looking across the whole
organisation, and some sat within divisions or
departments, often acting as a connection point
between the Centre of Excellence and local non-
digital teams.
Dandelion Organisations have a hub-and-spoke
approach but across multiple units or divisions.
Usually larger corporations that are operationally
divided around key audiences (B2B and B2C for
example) that might centralise some key digital
capability across the entire corporation, but also
could have some hub-and-spoke arrangements in
each of the key divisions.
Honeycomb One additional structure is the
holistic, or “honeycomb” structure, where each
employee is empowered with capability. This
structure might be interpreted as the equivalent of
a fully integrated digital capability where digital
expertise and skills are the domain of a broad
range of people and roles throughout the
organisation. In this scenario no specialist digital
roles exist, and no single role has digital capability
as its sole remit.
33.
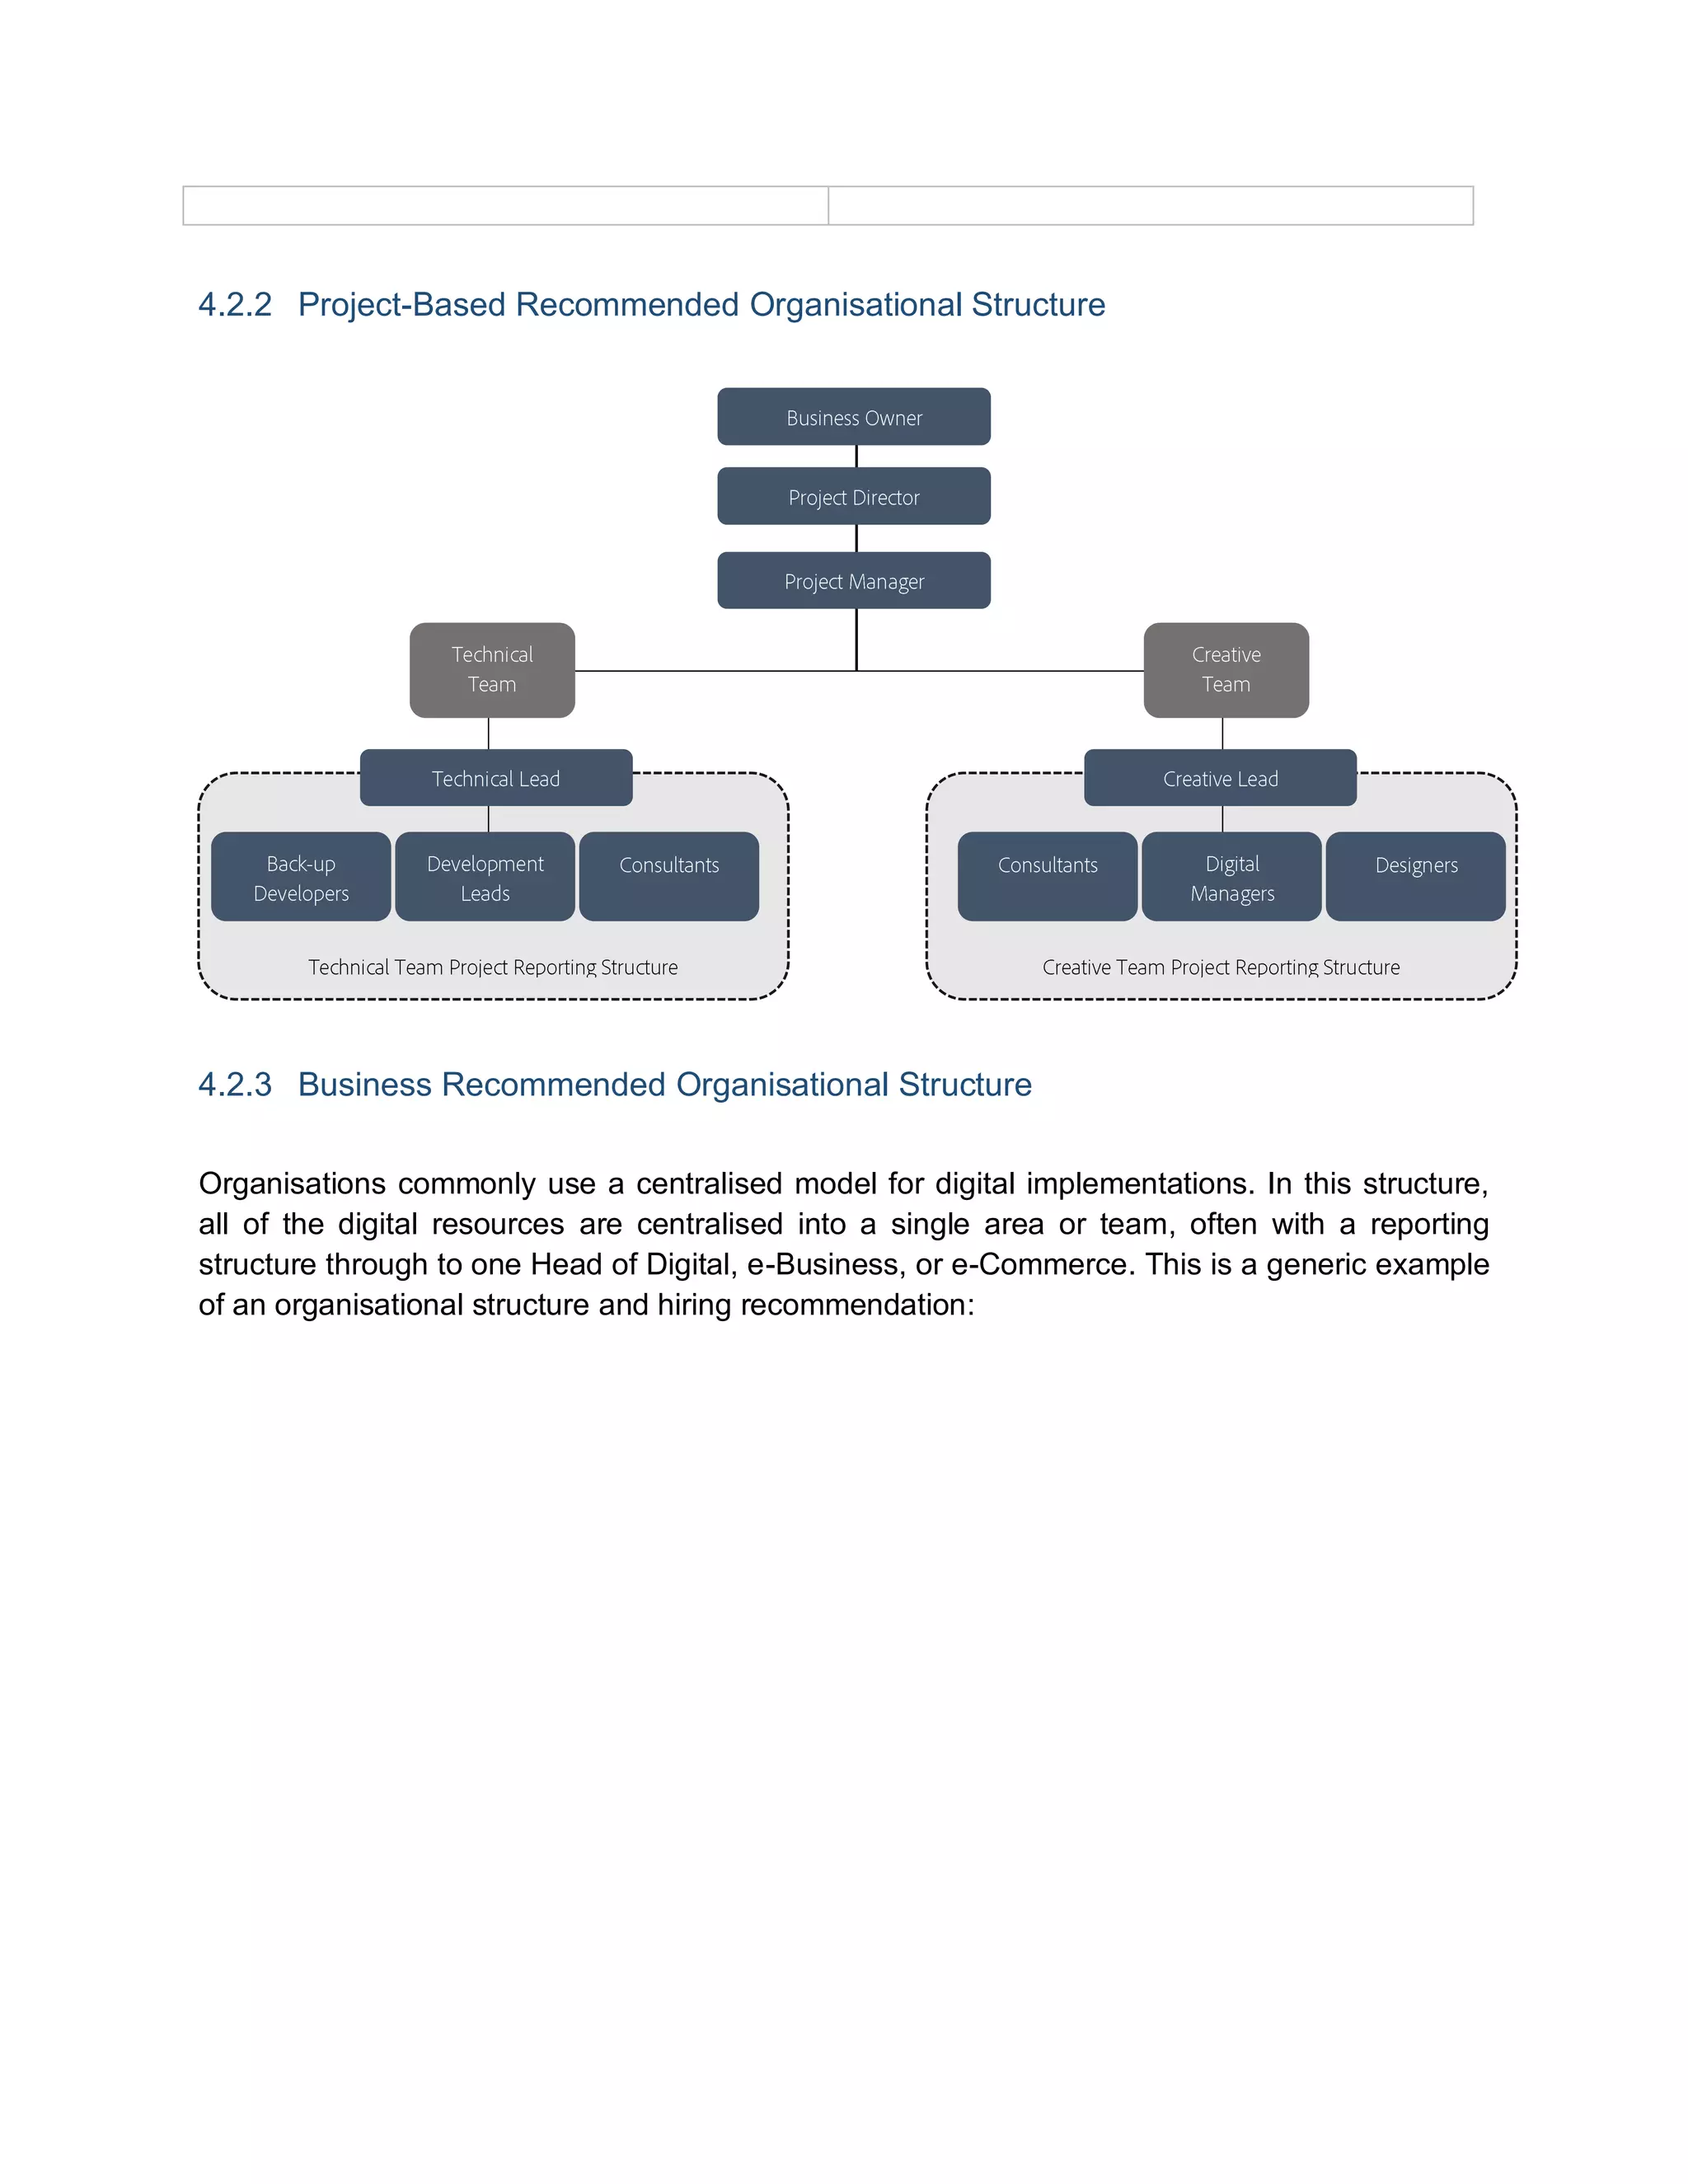
4.2.2 Project-Based RecommendedOrganisational Structure
4.2.3 Business Recommended Organisational Structure
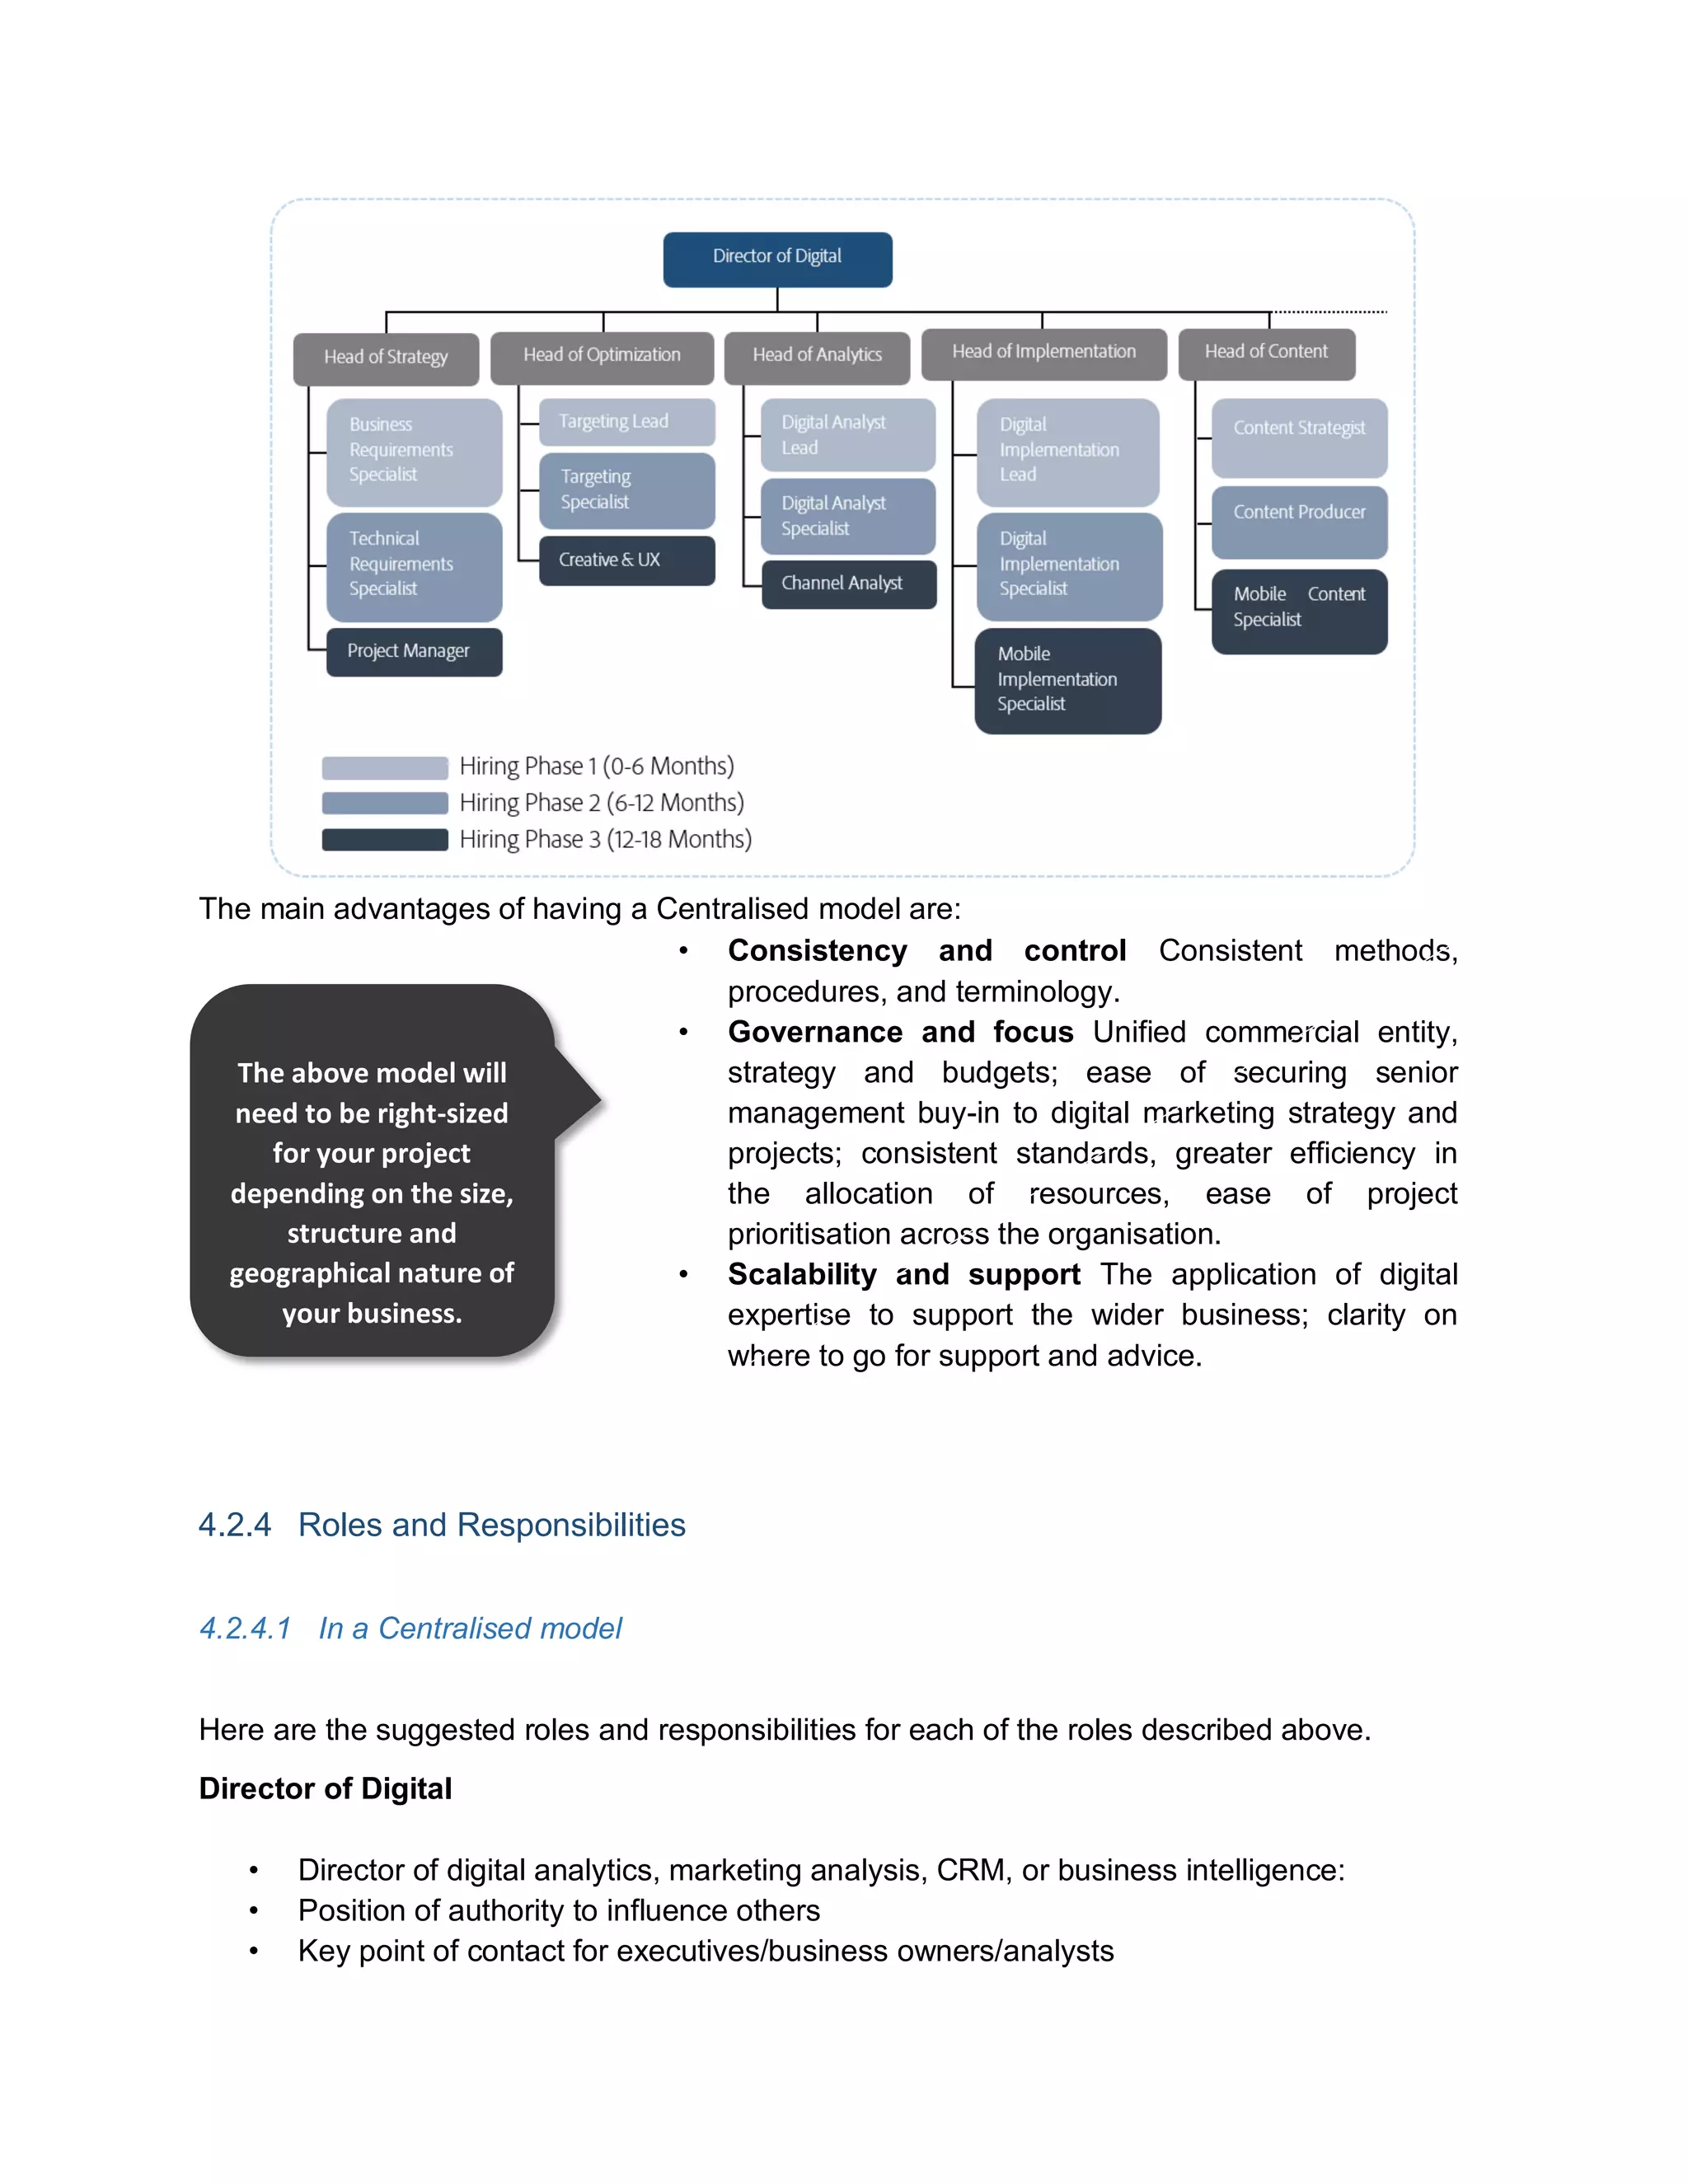
Organisations commonly use a centralised model for digital implementations. In this structure,
all of the digital resources are centralised into a single area or team, often with a reporting
structure through to one Head of Digital, e-Business, or e-Commerce. This is a generic example
of an organisational structure and hiring recommendation:
34.
The main advantagesof having a Centralised model are:
• Consistency and control Consistent methods,
procedures, and terminology.
• Governance and focus Unified commercial entity,
strategy and budgets; ease of securing senior
management buy-in to digital marketing strategy and
projects; consistent standards, greater efficiency in
the allocation of resources, ease of project
prioritisation across the organisation.
• Scalability and support The application of digital
expertise to support the wider business; clarity on
where to go for support and advice.
4.2.4 Roles and Responsibilities
4.2.4.1 In a Centralised model
Here are the suggested roles and responsibilities for each of the roles described above.
Director of Digital
• Director of digital analytics, marketing analysis, CRM, or business intelligence:
• Position of authority to influence others
• Key point of contact for executives/business owners/analysts
The above model will
need to be right-sized
for your project
depending on the size,
structure and
geographical nature of
your business.
35.
• Focuses oncorporate-level issues, but maintains visibility into regional or business unit
issues
• Works closely with executive sponsor to drive value from analytics across organisation
• Drives cultural change and product adoption within organisation via user education and
other interactions
• Manages core team and commercial relationship with analytics vendors
Head of Strategy
• Drives and owns the digital strategy roadmap
• Coordinates the on-going strategy workshops with stakeholders
• Ensures the business is continually focused and aligned with business objectives
• Determines priority of new implementation projects
• Drives the digital Steering Committee, not just a “web analytics” Steering Committee
• Manages the business analysts and project management resources
Head of Optimisation
• Owns the testing roadmap
• Drives the personalisation targeting strategy
• Works collaboratively with the senior analytics team on supporting analytics optimisation
actions through testing
• Manages the testing resources
• Manages ongoing relationship with testing product vendors
• Coordinates with the Head of Implementation on testing implementation needs
Head of Analytics
• Focused on overall digital performance — web analytics being the barometer of that
performance
• Runs regular meetings (weekly or monthly) with stakeholders on digital channel
performance
• Establishes enterprise-wide standards
• Manages ongoing relationships with analytics vendors
Head of Implementation
• Owns the analytics solutions design architecture
• Key point of contact for technical aspects of web analytics for one or more business
units
• Works collaboratively with core team on enhancements
• Manages the implementation resources
• Manages ongoing relationships with internal integration teams
Business Requirements Specialist
36.
• Defines prioritisedprojects
• Runs workshops to gather business analytics implementation reporting requirements
• Develops the business requirements document for each project
• Gathers business sign-off
• Works collaboratively with core team on requirements-gathering enhancements and
documenting the process
• Acts as Project Manager unless the Project Manager is outsourced
Targeting Lead
• Drives the testing roadmap
• Owns the key and complex testing campaign initiatives
• Key point of contact for testing technical aspects
• Owns the testing, deployment and QA process, and manages ongoing data accuracy
• Mentors the testing specialists
Digital Analyst Lead
• Focused on measuring business unit’s key performance indicators (KPIs) and optimising
business unit online
• Owns the analytical reporting requests log
• Single point of contact for end users within business unit and understands end users’
changing needs
• Validates data collection for business unit
• Meets with business unit reporting owners and core team on a regular basis (monthly)
• Informs core team of business unit activity and champions its needs to the core team
• Coordinates QA efforts and manages ongoing data accuracy
Digital Implementation Lead
• Drives the testing roadmap
• Owns the key and complex implementing initiatives
• Key point of contact for technical aspects
• Owns the testing, deployment and QA process
• Mentors the implementation resources
• Maintains library of implementation documentation and shares knowledge within the
organisation
• Active participant in the deployment enhancement process
Content Strategist
• Drives the content strategy
37.
• Owns thecontent delivery roadmap
• Manages the content delivery team
Technical Requirements Specialist
• Defines prioritised projects
• Runs workshops to gather technical requirements and identify risks
• Develops the technical documents and deployment plan for each project
• Gathers sign-off
• Works collaboratively with core team on requirements gathering enhancements and
documenting the process
Targeting Specialist
• Owns the testing and targeting campaign initiatives
• Gathers the individual campaign objectives and requirements
• Coordinates implementation campaign needs with the Targeting Lead
• Key point of contact for individual campaigns
• Delivers the individual campaign reporting and analytical insight
Digital Analyst Specialist
• Gathers analysis requirements from the business
• Delivers reporting requirements analysis, insight and actions
• Presents analysis back to the report owner
Digital Implementation Specialist
• Drives individual implementation projects
• Coordinates with internal and external development resources on implementation
requirements
• Creates the individual project tech specification documents
• Provides assistance on deployment and testing
• May be assigned to a specific business unit
Content Producer
• Maintains communication among cross-functional teams
• Own the process for creating, enforcing and managing the content production plan
• Collaborates with all departments to define and manage goals, scope, specific
deliverables and scheduling needs
• Aggregates and distills input from all areas of the organisation and develops the best
approach for incorporating feedback into project executions
• Contributes to strategic thinking around content models that adapt, scale and expand
over time and distribution platforms
38.
Project Manager
• Outsourcedinitially and then established as a full-time employee
• Responsible for costing, estimating and planning projects
• Prepares project initiation documentation.
• Responsible for ensuring best value is obtained for the project including supplier base,
use of internal and external resources
• Maintains and completes Key Performance Indicators
• Writes detailed and summarised project progress reports.
• Identifies, costs and processes any contract variations
• Tracks activities against the detailed project plans
Creative and UX Designer
• Conceptualises and creates design content for all campaign testing and targeting
experiences
• Tests concepts, perform task and user analysis, and assists with user acceptance
testing
• Develops prototypes that succinctly illustrate hierarchy and navigation
• Strategises and drives interactive product development from site map to launch
• Creates compelling online consumer experiences that drive business results
• Possesses knowledge of prototyping and wireframe creation tools
Channel Analyst
• Specialises in a particular channel: SEO, SEM, Display, Social, Affiliate, etc.
• Understands online strategy and how this breaks down into multi-channel web marketing
elements
• Possesses expert knowledge of key analytics tools and the ability to set up advanced
tracking/reporting mechanisms and capture key metrics
• Monitors and analyses web related data across the board, and analyses key metrics
• Understands how different elements of web strategy relate to, and complement, each
other (organic SEO, social media PPC) and creates metrics to monitor/measure this
• Maintains real-time, daily and weekly campaign performance reporting and presents key
data and conclusions to management
Mobile Implementation Analyst
• Drives individual implementation projects around mobile
• Coordinates with internal and external development resources on implementation
requirements
• Creates the individual project technical specification documents
• Provides assistance on deployment and testing
39.
• May beassigned to a specific business unit
Mobile Content Specialist
• Maintains communication among cross-functional teams
• Owns the process for creating, enforcing and managing the content production plan for
mobile
• Collaborates with all departments to define and manage goals, scope, specific
deliverables and scheduling needs
• Aggregates and distills input from all areas of the organisation to develop the best
approach for incorporating feedback into project executions
• Contributes to strategic thinking around content models that adapt, scale and expand
over time and distribution platforms
4.2.4.2 Key Teams and Roles
Business Users: Product Owners and Input Providers
• Provide overall business strategy and goals for products
• Develop key messaging and customer segmentation strategy for online sales
• Not involved in day to day management of the web site
Marketing: Brand Awareness and Site Management
• Develop strategy for product marketing across all channels including Adobe.com
• Drive day-to-day site marketing (content changes, testing) activities
• Provide market research and analytic support for site management
• Partner with Sales to deliver online revenue
Sales: Online Revenue and e-Commerce Business Strategy
• Own strategy and execution for all e-commerce related aspects of the site
• Develop growth plans and deliver to business objectives
• Partner with Marketing on delivering online revenue
IT: Implementation and Delivery
• Provide support to site strategies and objectives
• Develop technical strategy to deliver business vision
• Partner with Marketing Product Owners to enhance platform framework with new
templates/components and capabilities.
40.
4.3 Resources
You willneed to decide on the right balance and allocation of internal staff and external
consultants. This will be determined by your organisation’s previous experience with digital
implementations — less-experienced organisations may require more help from consultants.
Internally speaking, your organisation will need to implement a talent strategy to determine how
best to hire and retain digital and analytic talent.
“Having the right talent and sufficient resources on your digital team is
crucial to your long-term, data-driven success.” Brent Dykes - Adobe
4.3.1 Resource Model
To get the most out of Adobe Analytics, and to deliver a better digital experience to your
customers, you need to get the most out of your implementation. Investing in external resources
will help you optimise your investment, mitigate project risk and identify new opportunities.
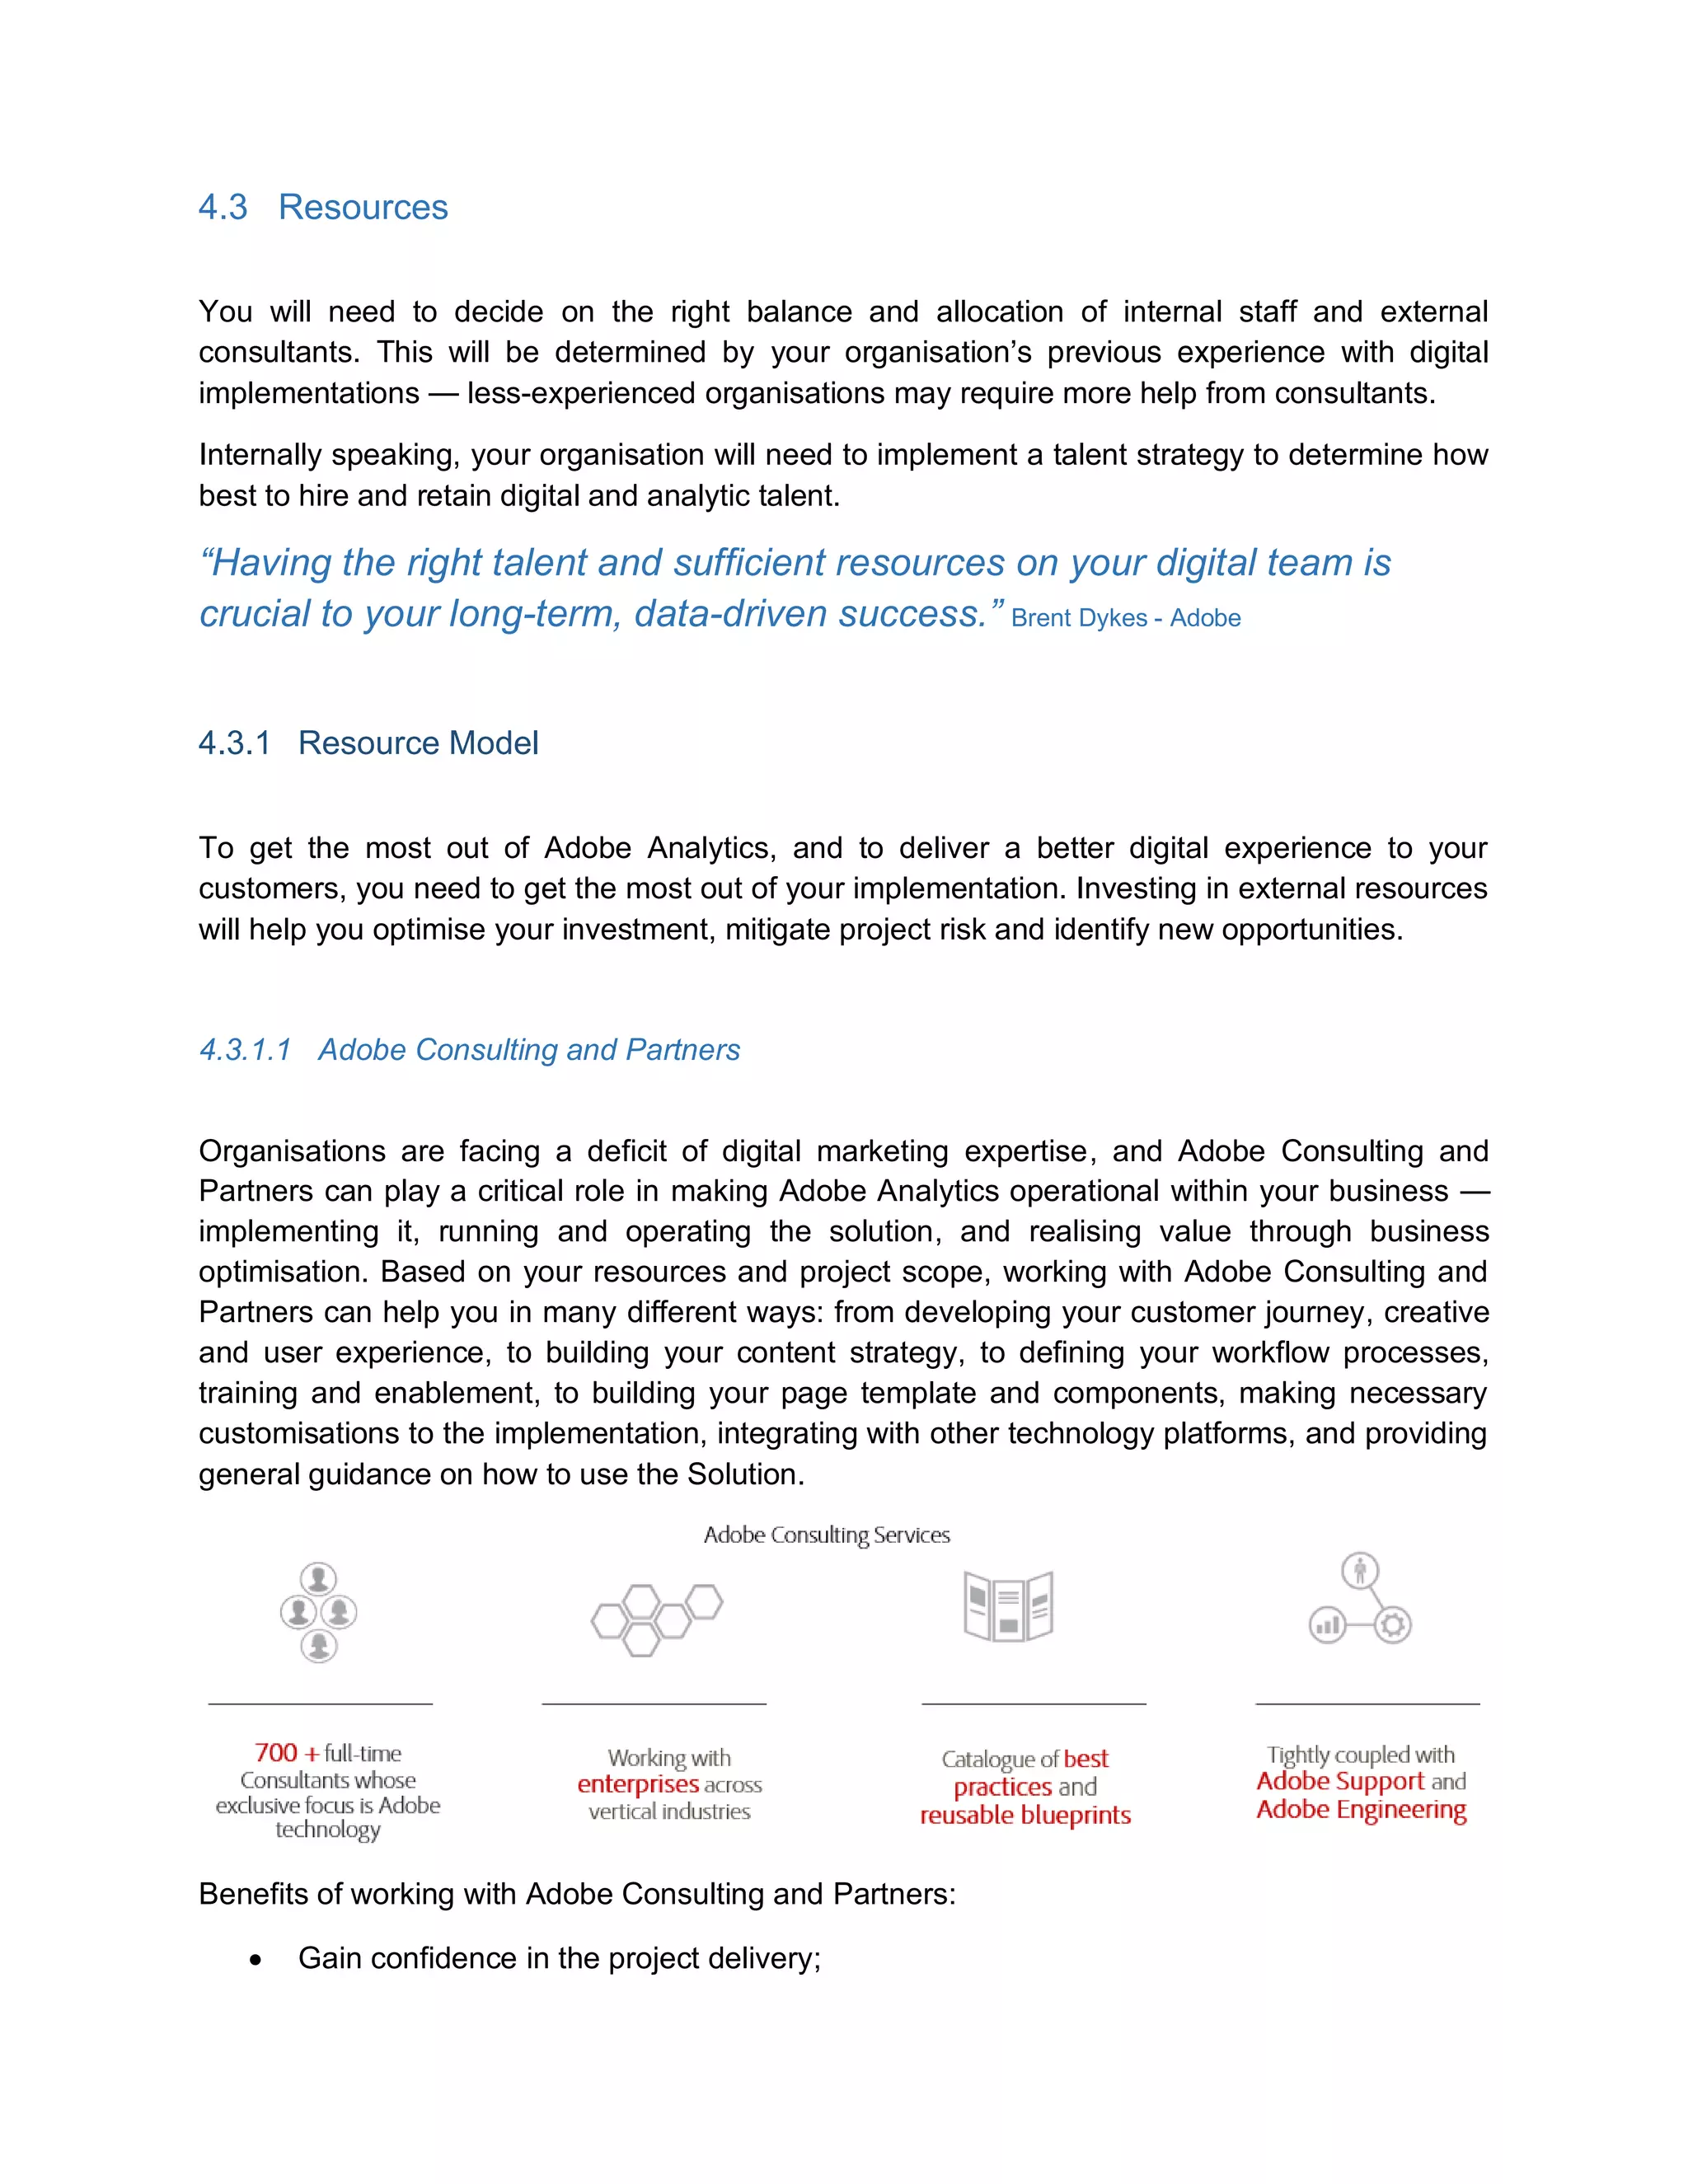
4.3.1.1 Adobe Consulting and Partners
Organisations are facing a deficit of digital marketing expertise, and Adobe Consulting and
Partners can play a critical role in making Adobe Analytics operational within your business —
implementing it, running and operating the solution, and realising value through business
optimisation. Based on your resources and project scope, working with Adobe Consulting and
Partners can help you in many different ways: from developing your customer journey, creative
and user experience, to building your content strategy, to defining your workflow processes,
training and enablement, to building your page template and components, making necessary
customisations to the implementation, integrating with other technology platforms, and providing
general guidance on how to use the Solution.
Benefits of working with Adobe Consulting and Partners:
Gain confidence in the project delivery;
41.
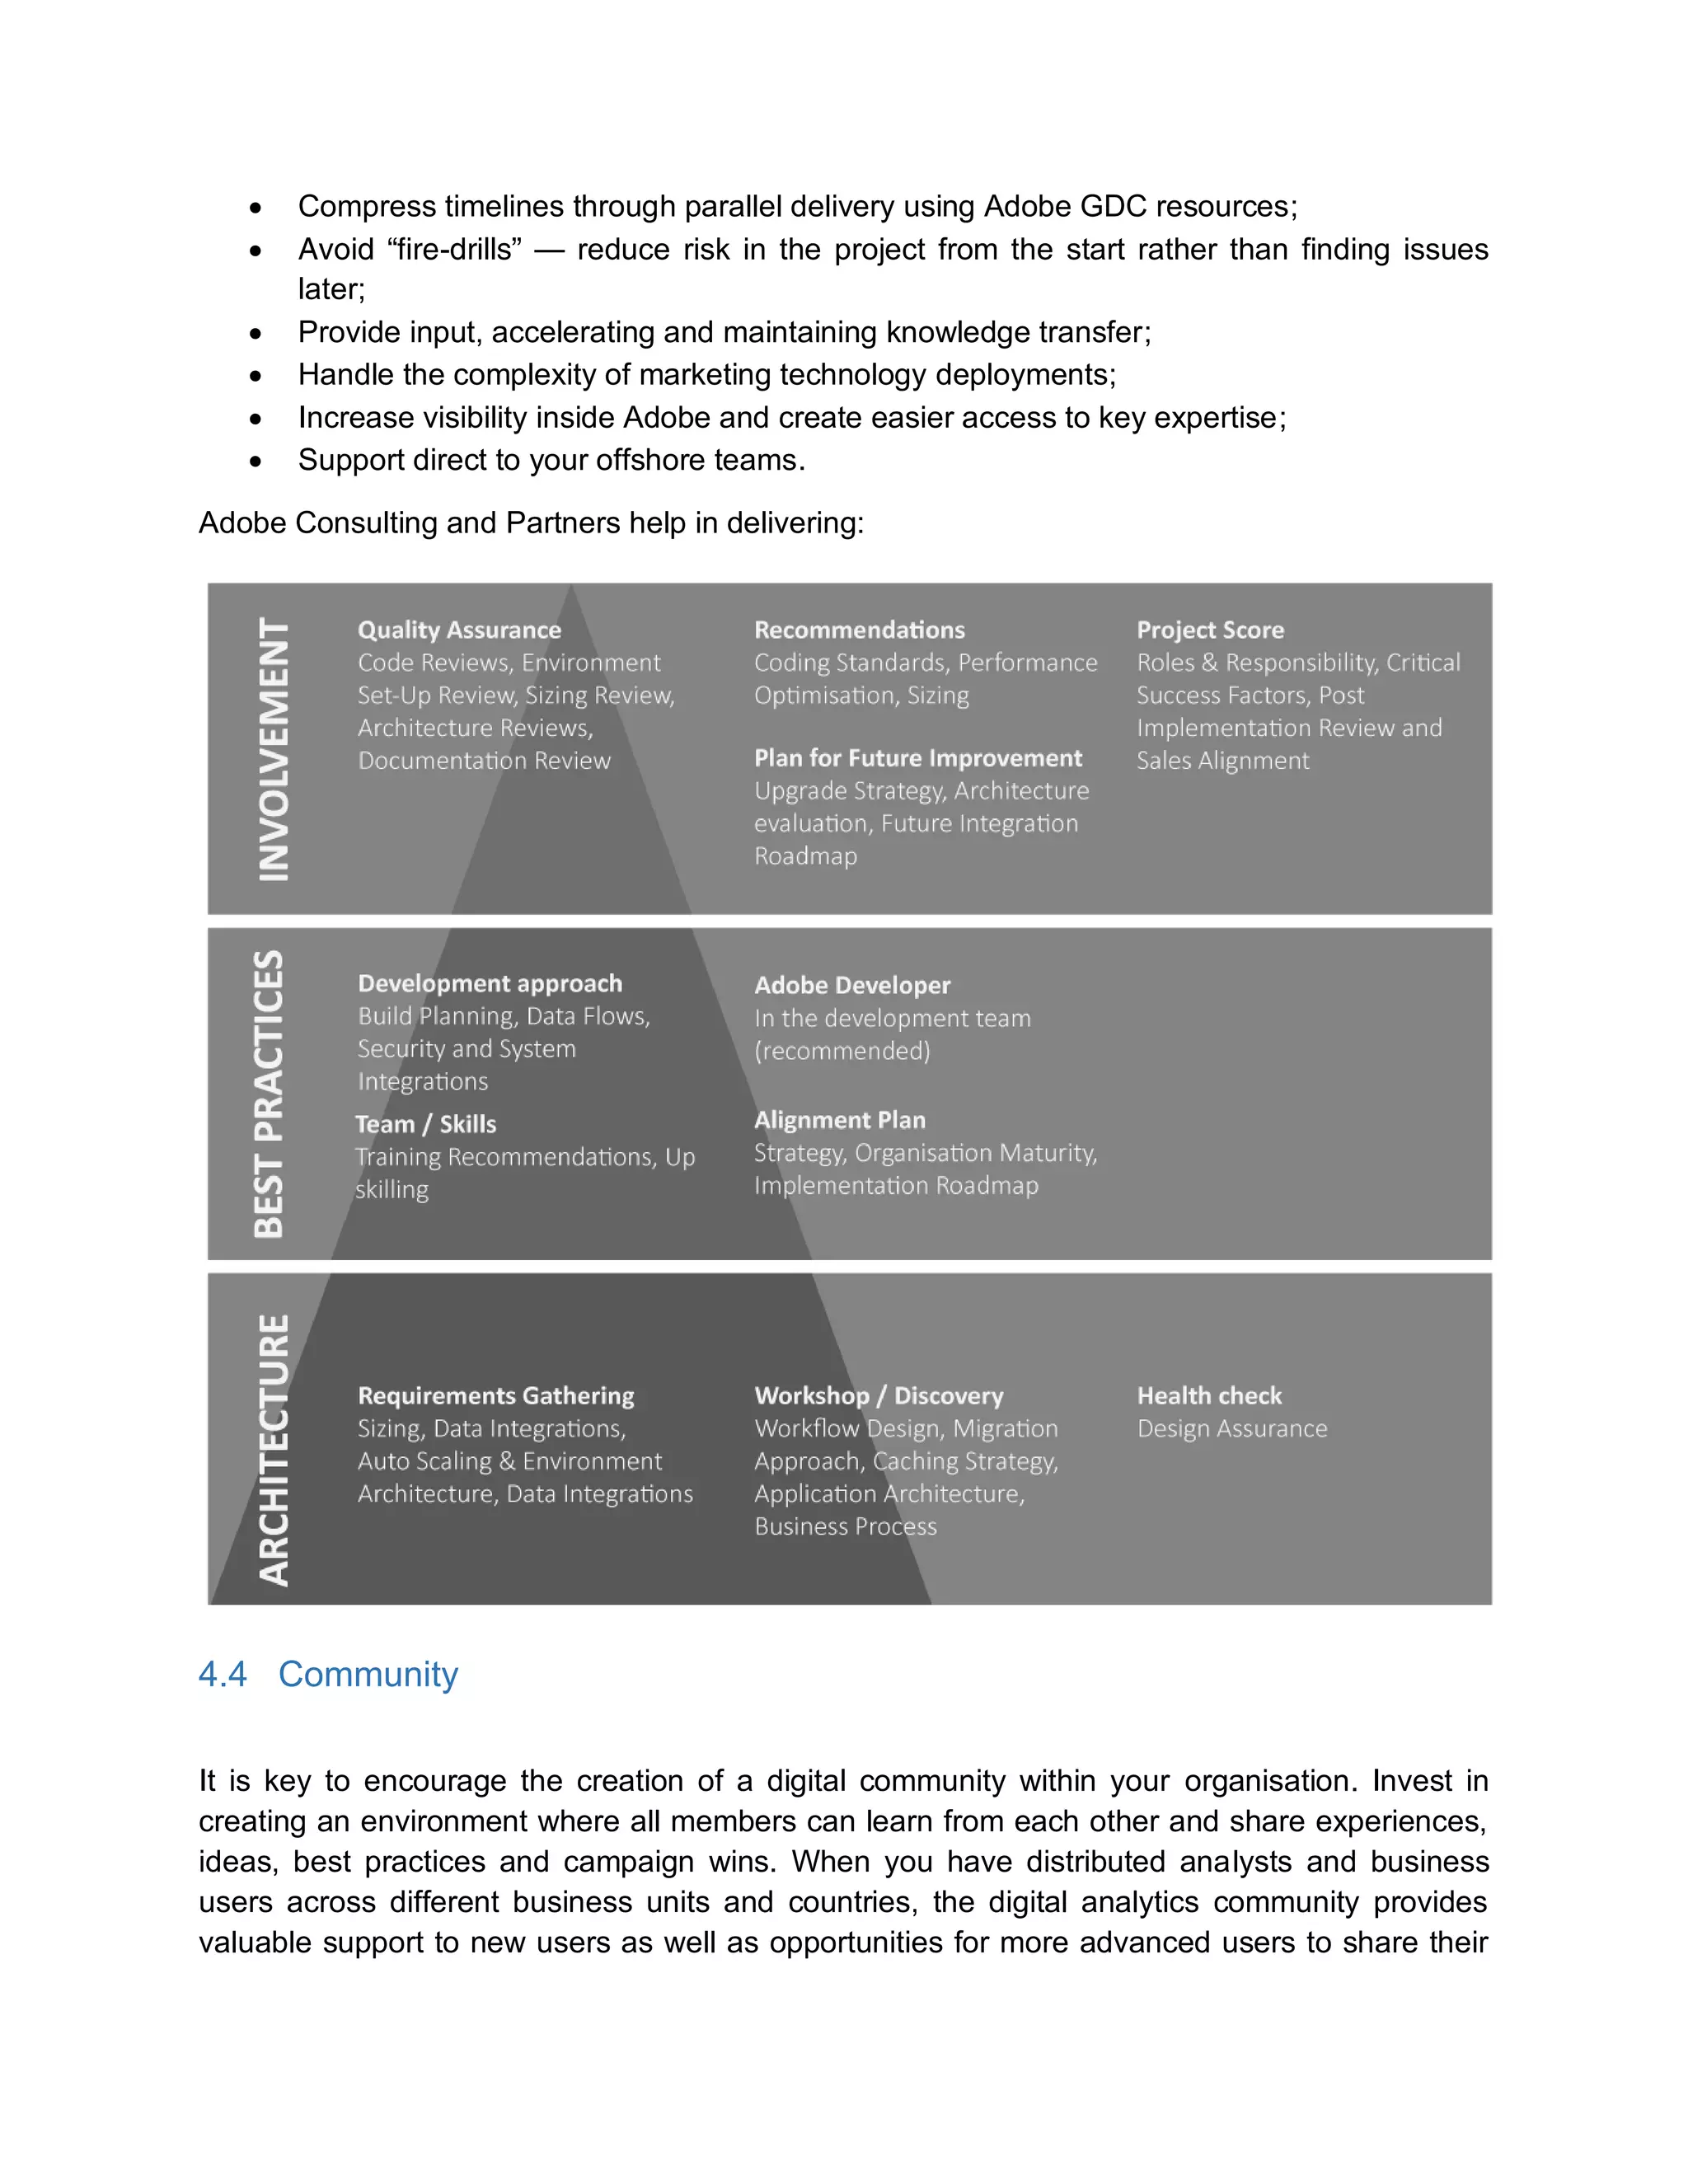
Compress timelinesthrough parallel delivery using Adobe GDC resources;
Avoid “fire-drills” — reduce risk in the project from the start rather than finding issues
later;
Provide input, accelerating and maintaining knowledge transfer;
Handle the complexity of marketing technology deployments;
Increase visibility inside Adobe and create easier access to key expertise;
Support direct to your offshore teams.
Adobe Consulting and Partners help in delivering:
4.4 Community
It is key to encourage the creation of a digital community within your organisation. Invest in
creating an environment where all members can learn from each other and share experiences,
ideas, best practices and campaign wins. When you have distributed analysts and business
users across different business units and countries, the digital analytics community provides
valuable support to new users as well as opportunities for more advanced users to share their
42.
collective knowledge. Thisis especially important in traditional businesses where upskilling
traditional skillsets with digital ones is vital — it can be a useful forum in which to educate the
traditionally minded people within your business. Community can be fostered in a number of
different ways, such as a simple email distribution list, internal wiki, corporate chat groups, and
workshops.
4.5 Culture
Some organisations may be more resistant than others to embracing change when it comes to
the adoption of new technologies and business processes. Despite the fact that your
organisation has invested in Adobe Analytics, some leaders and employees may still have
doubts about the benefits of the solution. Probably they don’t fully understand what analytics,
automation, content management, user experience and other components of digital bring to the
table. This is common in a business world that is still adapting and changing into digital.
Changing culture inside an organisation is a difficult but not impossible task. It usually starts by
having a clear vision of the future followed by strengthening change with management tools
such as role definitions and measurement and control systems. Don’t forget to involve key
stakeholders and share that vision of the future across the organisation. One of the main
reasons why organisations fear change is because they have little or no information at all about
where change is taking them.
4.5.1 Developing a Culture of Analytics and Testing
A company with a culture of analytics and testing does not pick a landing page based on which
one the CEO likes, or which one the designer thinks is the most attractive. Rather, it runs A/B
tests on different variants, using analytical tools and targeting tools to inform and prioritise the
experience.
Creating a culture of testing and optimisation in your company is all about sharing. Share wins,
success stories, strategies and your company’s digital vision across all corners of the business.
Make sure everyone in every direction inside your organisation, especially decision-makers and
executive leaders, understands and helps you push your digital initiatives — and have them
share test ideas. Sharing, including and integrating your business stakeholders guarantees
support down the road.
Incorporating analysis into the testing process has enabled our customers to adopt a data-
driven culture. Rather than teams trying to imagine what users want, they can use the data to
learn what features actually resonate with audiences. The use of testing also lowers risk by
exposing only part of an audience to a change rather than rolling it out across the web site and
hoping for positive results.
A good example is Restaurants.com. The results from early tests were compelling, with analysis
from Adobe Marketing Cloud clearly demonstrating how tests with Adobe tools positively
43.
impacted revenue acrossthe site. By testing the effectiveness of the add-to-cart module on the
restaurant details page, the company achieved a five per cent lift in conversion and an eight per
cent increase in revenue.
By integrating rich testing capabilities and advanced analytics available in Adobe Marketing
Cloud, Restaurant.com can now measure and evaluate customer preferences, as well as
optimise visitor experiences, to extract the most value from each interaction.
5 Process
In this section of the document, you will find the information you need to deploy and use Adobe
Analytics effectively. There are four main types of processes: deployment, usage, sustainability,
and change management.
5.1 Deployment and Implementation
5.1.1 Deployment process steps
1. The Adobe Consultant gathers report requirements and creates a reporting solution
architecture based on those requirements.
The data collection plan includes variable definitions, required VISTA rules and custom
JavaScript, data correlation, and all settings for each report suite. The client completes
the Implementation Questionnaire.
2. Technical resources on the client side implement the code, site-specific JavaScript, and
server-side variables.
3. The Adobe Consultant addresses technical issues during the implementation and assists
in devising solutions as required.
4. Technical resources on the client-side unit test the implementation.
Testers log in to Analytics and, verify all variables (page name, channel, server, events,
campaign, conversion variables, custom traffic variables, products, and all other
variables).
5. The client notifies Adobe that the implementation is complete.
The client provides a validation sample (data sample) to the Adobe Consultant to validate
data accuracy.
6. The client faxes (or signs online) an Implementation Acceptance and Agreement for the
appropriate site.
7. After the acceptance has been received, the Adobe Consultant enables the Adobe Best
Practices — Implementation Verification certification within the interface.
8. Optionally, the client can contract with Adobe for monitoring services for key pages of the
implemented site (generally, these are the primary templates, home page, and critical
entry pages).
44.
This monitoring softwareis described in a separate document, but tracks pages by
loading and executing the page, then comparing the image request to a baseline stored in
a database. If any differences are detected, the software notifies specified Adobe (AM/IE)
and client personnel via email.
5.1.2 Typical Deployment Scenarios for Adobe Analytics
There are several ways to implement code on your site. The most recommended method to
implement Adobe Analytics is using Adobe Dynamic Tag Management (DTM).
All methods use similar logic to gather data — by installing a snippet of JavaScript code that
sends an image request to Adobe's data collection servers. Adobe strongly
recommends using Adobe Dynamic Tag Manager (DTM) to implement your site. Using DTM
allows users to easily update code versions and rules without relying on a development or
engineering team to change web files
5.1.2.1 Dynamic Tag Management
All Adobe Marketing Cloud customers have free access to Dynamic Tag Management (DTM),
which is the standard for deploying JavaScript and HTML page tags for all solutions to your web
site.
You can deploy Adobe Analytics using DTM by creating the Adobe Analytics tool and
configuring the page code either automatically or manually. The automatic method is
recommended for most users.
Tag Management — a Foundation of the Digital Marketing Ecosystem
45.
Benefits of usingDTM:
• Quicker tag implementation Adding and updating tags is faster and more efficient with
Adobe DTM. Marketers can quickly deploy and optimise tags without being bound by IT
release cycles.
• Greater overall efficiency DTM saves marketers substantial amounts of time previously
spent managing analytics and media tags. DTM provides an interface for marketers to
deploy the marketing tags they need onto the pages they desire through the interface
when they are required.
• Centralised tool management With traditional tagging, marketers have to create
separate rules for each tag. In the DTM tool, marketers can trigger many tags and
technologies simultaneously.
• Improved control and security Marketers retain control of developing and deploying
tag strategies. As data is collected, it is available across all digital marketing services.
Meanwhile, the permission-based workflow gives IT teams peace of mind knowing that
the site won’t be compromised.
• Reduced costs Adobe DTM does all the work, which means less reliance on expensive
IT resources for tag management.
For a step-by-step explanation on how to deploy Adobe Analytics using DTM, go to DTM
Analytics Deployment, where you will also find information on how to add a new Analytics Tool
or edit an existing one.
5.1.2.2 Mobile Deployment
46.
You can alsocollect analytics from mobile devices. This includes mobile sites and native and
hybrid mobile applications.
Native libraries are provided for iOS, Android, Windows Phone 8, BlackBerry, Symbian, and
others.
• iOS SDK 4.x for Marketing Cloud Solutions
• Android SDK 4.x for Marketing Cloud Solutions
• Windows 8.1 Universal App Store
• BlackBerry 10 SDK 4.x for Marketing Cloud Solutions
When configuring your app in Adobe Mobile services, you can download a customised package
that includes a pre-populated version of the configuration file.
• iOS instructions
• Android instructions
5.1.2.3 Video Deployment
Adobe Analytics provides support for tracking video and ad metrics, including total
views/impressions, time spent, and completion rates. Native support is provided for measuring
the most popular video formats on the web, including Flash, with other web and mobile libraries
coming soon.
What is “Video Heartbeat”?
Video heartbeat is a new data collection service provided by Adobe that collects and aggregates
video metrics. During video playback, frequent “heartbeat” calls are sent to this service to
measure time played. These heartbeat calls are sent every ten seconds, which results in
granular video engagement metrics and more accurate video fallout reports.
When a video or video ad is played, a single server call is sent to your Analytics data collection
server with the video/ad name, player name, channel, and any additional custom variables that
you want to track for that video/ad. During playback, “heartbeats” are sent at regular intervals to
the heartbeat data collection service to track time played. After the video/ad is completed and/or
abandoned, the heartbeat service calculates time-spent metrics and then sends the data to
Analytics.
Before implementing the new video heartbeat solution described in this document, you must
contact your Adobe Customer Success Manager and/or sales rep to get new stream pricing
(migrating from server call model to stream-based model).
47.
5.1.2.4 Global ReportSuite and Individual Report Suite
Global report suites provide the ability to see total data across two or more report suites. Unlike
rollups, global report suites act very similar to individual report suites in that they report data
based on what is collected. Global report suites are frequently implemented by clients because
of the value they provide reporting.
Properties of global report suites
• Global report suites use secondary server calls (the
individual report suite use primary server calls). Contact your
Adobe Customer Success Manager to see if your contract
accommodates these.
• Implementing code required for a global report suite may
take a significant amount of time depending on your
organisation's rollout process, as it requires editing each
s_code.js file in all individual report suites that will be included.
• A global report suite treats all data collected as if it were from a single large site. This
means pathing and conversion can be tracked across report suites (brands, regions or
business units).
• If a user touches more than one report suite in the same visit, each individual report
suite will consider that user separate visits; the global report suite will see it as a single
visit.
• Data is only collected from the time it was implemented forward.
5.1.3 Implementation Acceptance
The following items help to ensure a successful implementation:
• A best practices document, which is client-facing and explains the process in detail;
• The validation document that the customer uses to unit test the implementation;
• An Implementation Acceptance and Agreement form for the client to sign;
• A monitoring application that continuously validates the tags;
• Utilities and/or tools for comparison of page views and/or orders — those
comparisons can get fairly difficult;
• A method or process to obtain the debug log for a given day quickly, by report suite
ID.
5.1.4 Project Management
5.1.4.1 Setting up the Project Management Office
Use global report
suites when you want
to report at both a
brand/regional level
and a company level.
48.
A Project ManagementOffice (PMO) is a department that determines, maintains and sets the
processes and standards related to project management inside an organisation. When
implementing Adobe Analytics, the main responsibly of a PMO is to make sure the project is
executed to the frameworks, processes and templates as prescribed by the organisation.
Some things to consider when building your PMO include:
• Availability of resources inside your organisation;
• Existing project management standards, processes and methodologies;
• Current roles and responsibilities;
• The politics and culture of your organisation;
• Project size, volume and requirements;
• Any existing project management problems.
5.1.4.1.1 Typical Critical Success Factors and Risks
Success factors
• Strong sponsorship at all levels
• Organisational commitment and investment (team stability and availability)
• Well-defined and communicated success criteria for the program
• Well-defined and communicated budget and KPIs to measure to
• Well-defined and communicated change management and communication plans
(people, process and product);
• Incorporation of best practices;
• Commitment to on-going training.
Risk factors
• Project scoping not correctly defined;
• Lack of business users’ involvement and commitment;
• No vision (or only limited to the project itself);
• Too many specifics which can lead to
o Maintenance and/or deployment issues
o User-adoption problems
5.1.5 Project Delivery Phases
Note: These estimations are meant to provide a guide and are indicative of a standard low-
complexity Adobe Analytics project. These estimates should not be applied for every
implementation, as integration and complexity can affect duration and effort.
5.1.6 Communication
5.1.6.1 CommunicationPlan
A detailed communication plan will help you outline the approach that will be used to ensure the
flow of communication among the various members of the project team, engaging the key
stakeholders and any other members of the Adobe Analytics Implementation Project. The aim of
this plan is to manage and coordinate communication, as well as to engage the management
and stakeholders to gain their commitment to the implementation of the project.
5.1.6.2 Collaboration
Analytics deliveries can be simple or complex projects that in some cases may require teams
working together.
These are some factors that can help you in the process of building collaborative teams:
• Top-level executives can boost collaborative behaviour by investing in facilities with
open floor plans to improve communication;
• At organisations where senior executives are highly collaborative, teams collaborate
well;
• Invest in teaching employees how to communicate well and build relationships can
improve team collaboration;
• When employees feel a strong sense of community, it becomes easier for them to reach
out to others and share knowledge;
• Collaboration improves when the roles of individual team members are clearly defined
yet the team understands the objectives and goals they have to achieve together.
5.1.6.3 DACI — For Approval Authority
We see the most successful Adobe Analytics projects using a DACI or similar model in their
communication strategy.
DACI is used to clarify roles in a way that makes it clear who has approval authority and who
needs to be consulted before a decision is made and who needs to be informed once a decision
has been made.
The role definitions are as follows:
53.
Role Responsibilities
Driver Communicatingroles and responsibilities with other team members
5.1.6.3.1.1.1 Making sure these roles and responsibilities are clear
Overall coordination of the project
Approver 5.1.6.3.1.1.2 Approval or disapproval of decisions affecting progress of the
project
5.1.6.3.1.1.3 (Some approvals may still fall under the decision of the project’s
Driver)
Contributor Consulting and providing input to the necessary decisions
5.1.6.3.1.1.4 (Not necessarily involved in the decision approval or
disapproval)
Informed Does not necessarily have an approval role, but must be informed once a
decision or change is made
5.1.7 Administration
5.1.7.1 Credentials
The first step to getting value from Adobe Analytics is to obtain login credentials. Once a
contract has been signed, you can request a user name and password from your sales
representative or Adobe Customer Success Manager.
Reports are siloed into different groups of reports, or report suites. All data is sent to a specific
report suite in order for it to be recorded for use in reporting.
5.1.7.2 Report Suite
A report suite defines the complete, independent reporting on a chosen web site, set of web
sites, mobile app or subset of web pages. Usually, a report suite is one web site, but it can be a
global segment where you have combined several sites’ numbers to get totals. When you log in
to the marketing reports, ad hoc analysis, and report builder, you select one report suite to use
(except when you use roll-ups that combine report suites). Also, a report suite can be smaller
54.
than a website, if want to run reports for a portion of your site. Analytics solutions aggregate
and report on these data stores. The admin Report Suite Manager lets you define the rules that
govern how data is processed in a report suite.
Report Suite Manager Descriptions
Element Description
Select Report
Suite
The Report Suite Manager highlights a selected report suite. You can
select multiple report suites with Ctrl+click or Shift+click.
A selected report suite remains selected until you select another report
suite.
Download Generates an Excel spreadsheet of all settings for the currently selected
report suites.
Search Lets you locate a specific report suite in the Report Suite List. The
search tool includes both basic name-based search and an advanced
search page for in-depth searches.
Groups Lets you organise your report suites into custom groups. You can
quickly access multiple report suites that share similar settings or that
you commonly edit together.
Saved Searches A dynamic group that uses the Advanced Search feature to define a set
of criteria that determines its members. As you add or modify report
suites in the Report Suite Manager, the Saved Search automatically
adds those report suites that match its criteria.
Rollups A rollup is single report suite that combines the tracking data of several
other report suites.
Edit Settings When you edit a report suite, the edits are applied to all selected report
suites.
Create New You can create a new report suite by selecting either a pre-defined
template, or use one of your existing report suites to serve as a general
model.
Customize
Columns
Lets you choose columns to add to the Report Suite Manager.
Report Suite ID Specifies a unique ID that can contain only alphanumeric characters.
This ID cannot be changed after it is created. Adobe sets the required
ID prefix. Contact your Adobe Customer Success Manageror Customer
Care to change the prefix value.
When creating multiple report suites, ensure that the naming convention
you use guarantees unique report suite IDs.
55.
Site Title Identifiesreport suites in Admin Tools, and in the report suite drop-down
list in the marketing report header.
Base URL Defines the base domain for the report suite.
You can go to Report Suite Manager for more information on report suites.
5.1.7.3 Determine which variables to populate
Adobe Analytics has many custom variables of which you can take advantage. Every
organisation has different business requirements, so it is important to determine how each
variable is populated and what might be shared variables across report suites if using a global
report suite.
A Solution Design Document is highly recommended before
implementing code on your site. This document is a basic
structure of what each variable does, how it is populated, and
where it is implemented. Once created, save it in a place
where analysts pulling reports and developers implementing
code can easily access it. When new business requirements
are established, you can reference the existing document and
add new variables or alter the logic of existing variables as
needed.
Nominate a single
owner in your
organisation to
maintain the solution
design and update it.
It should be reviewed
quarterly — at a
minimum — for
changes.
56.
5.1.8 Workflows
5.1.8.1 ReportWorkflow
With Adobe analytics you will be able to go from reporting (organising data into informational
summaries), to analysis (transforming that raw into meaningful insights). Reporting will help you
monitor your online presence and be alerted to when data falls outside of expected ranges.
Good reporting should raise questions about the business from its end users. The goal of
analysis is to answer questions by interpreting the data at a deeper level and providing
actionable recommendations. Through the process of performing analysis you may raise
additional questions, but the goal is to identify answers, or at least potential answers that can be
57.
tested. In summary:reporting shows you what is happening, while analysis focuses on
explaining why it is happening and what you can do about it.
Source: Brent Dykes, Reporting vs. Analysis: What’s the Difference?
In other words, the ultimate goal for reporting and analysis is to increase sales and reduce costs
(add value). Both reporting and analysis play roles in influencing and driving the actions which
lead to greater value in organisations.
From Raw Data to Meaningful Insights for Decision Making
5.1.8.2 SAINT
To allow classification data to be quickly and easily uploaded and organised, Adobe Analytics
offers a tool called SiteCatalyst Attribute Importing and Naming Tool (SAINT) which allows
marketers to produce and import a table of key values and their associated metadata. This
classification model is used to manage the data collected by Adobe Analytics to generate
reports that allow you to perform analytics on your site.
The following list outlines the limits and features of classifications that may assist your
organisation when working with SAINT classifications.
58.
1. SAINT classificationsare retroactive — once the classification files are uploaded, historical
data will also be classified.
2. SAINT classifications are automatically correlated/subrelated with all other classifications
based on the same key — users can break down Campaigns by Tracking Code,
Categories by Product, etc. These breakdowns are available automatically once SAINT
data has been uploaded for a given variable/report.
3. SAINT classifications inherit all correlations and subrelations from the key — for instance,
if the user has a classification based on the page name, and page name is correlated
with Referring Domains, they will be able to break down the classification of page name
by Referring Domains.
4. SAINT classifications inherit all available metrics from the report containing the key values
— if the visits metric is available within one of the Custom Traffic reports, and the user
sets up a classification based on this report, then the visits metric will be available within
the classification-based report as well.
5. SAINT is limited to 30 classifications per variable/report.
Classifications are created by grouping (classifying) granular data from a source report. For
example, you might want to analyse display ads, but they are mixed with email, partner, text ad,
and social media campaigns. You can create groups so that you can analyse them separately.
There are three types of classifications for marketing reporting and analytics:
Campaign classifications Campaign classifications are defined as elements that will not vary
within the campaign, such as campaign name and owner.
Creative elements classification These vary between placements or instances of the
campaign, and include characteristics such as media type, headline, keyword, and media
vendor.
Metric-specific classifications These are fixed numeric values associated with a campaign,
such as the hard cost for a campaign. Additionally, you can classify prop and eVar variables.
Examples of SAINT Classifications
SAINT COLUMN VALUES
Campaign ID (Default key)
Channel Name Email campaign
SMS
Organic search
Paid search
Social
59.
Display ad
Affiliate
Offline campaign
ChannelType Online
Offline
Campaign Country Name of the country where the campaign is
running
Campaign State Name of the state where the campaign is
running
Referring Domain Name of the referring domain
Category Match type/access type
Sub-Category Additional data
Campaign Status Active
Inactive
Campaign Cost Monetary value
Marketing Objective Drive email subscriptions
Drive signups
Create awareness of brand
Drive conversion
CreativeID CreativeID for emails, display ads
Affiliate PartnerID Affiliate PartnerID
AdGroup AdGroup for paid search
Keyword Keyword used
Keyword Type Branded and non-branded keywords
Keyword MatchType Match type – broad, exact, phase, negative
Closser, S, 2014. Adobe Analytic- Marketing Reports and Analytics. Quick Reference Guide. 1st ed. United States of
America: Adobe Press.
5.1.8.3 Predictive Marketing
60.
In the earlydays of digital marketing, analytics emerged to tell organisations what happened
and, as analytics got better, why it happened. Then solutions arrived to make it easier to act on
data and optimise results. However, the amount of data available today presents a challenge to
extract insights quickly and act while those insights are still valuable. Predictive marketing will
help you and your team harness powerful data science processes, such as data mining and
statistical modeling, to understand past performance and better optimise future marketing
activities. Adobe’s predictive marketing capability extends the power of the Adobe Marketing
Cloud to enhance your digital marketing optimisation activities and make more intelligent,
forward-looking decisions with the power of data science.
Business Challenges for Predictive Marketing
For the digital marketer:
• Few expectations from optimization;
• Manual and time-consuming discovery;
• Reactive rather than proactive;
• Trial and error subjective guessing;
• Skills gap.
There are also a number of technology challenges:
• Increasing amounts of data;
• Software requires extensive knowledge of statistics;
• Black-box algorithms and models;
• Little process integration and collaboration.
Predictive Marketing provides value to everyone from analysts to technology experts to content
managers in all industries
What challenges are solved with Predictive Marketing?
Using Predictive Marketing is important because it will help you spot upcoming risks and
anomalies, forecast campaign results and develop optimised media-mix models. You can also
61.
use it topredict and target customers before they go to churn and see the impact of your
marketing campaigns and activities with real-time monitoring.
Predictive Marketing Workflow
DESCRIPTION What do you
want to improve
Discover hidden
relationships
Uncover
relevant,
differentiated,
valuable
audiences
Predict who is
most likely to
respond
Take action on
your audiences
ADOBE
FEATURE
Anomaly
Detection
Correlations Clustering Propensity
Scoring
Execution
ADOBE
CAPABILITY
Marketing
Reports &
Analytics Data Workbench
Adobe Target
Audience
Manager
Predictive Marketing capabilities:
• Anomaly detection
You can build any number of filtered metrics, use them to surface significant spikes or
dips, and then analyse the impact of the anomalies.
• Correlation analysis
Identify trends and relationships in large datasets using standard correlation equations,
so you can analyse data faster and highlight changes over time.
• Audience clustering
Analyse large numbers of variables simultaneously to dynamically categorise visitors
and create audiences for further analysis, targeting, and personalisation.
• Customer propensity modeling
Define customers with a high possibility for a successful conversion or completion of a
specific event, so you can predict visitor behavior and maximise campaign impact.
• Audience activation
Easily share newly discovered audiences across Adobe Marketing Cloud solutions and
third-party downstream systems to take action.
5.1.8.4 Data Management
TRIGGER
QUESTION
DATA
EXPLORATION
AUDIENCE
DISCOVERY
CUSTOMER
SCORING
EXECUTION
62.
5.1.8.4.1 Data Collection
Everypage Adobe tracks has a small snippet of Adobe-authorised JavaScript code. Your Adobe
Customer Success Manager or Adobe Consultant will provide this code or it can be copied from
the admin interface in Adobe Analytics.
At a high level, the data collection process flows as follows:
Adobe has created multiple ways to send data into Adobe Analytics. These methods include
tracking information in real time from web sites, emails, campaigns, web-based kiosks, mobile
devices, client-server applications, and most applications that can access the Internet.
These methods include reporting on information from offline systems via the API, Data
Sources and partner integration platform.
Input Collection
63.
JavaScript tags andAppMeasurement libraries are real-time, live data collection methods.
SAINT and Data Sources options represent post-collection methods for importing additional
data into Adobe’s analytics platform.
Input Option Description
JavaScript Tags
Today most digital analytics platforms use JavaScript tags to collect data
from web sites and other web-based systems. This approach involves
placing client-side JavaScript code within your web pages, which sends
page, browser, and visitor data to Analytics. Most implementations
leverage this approach.
Increasingly, organisations use tag management solutions such as tag
management to deploy and manage their various JavaScript tags,
including their page code.
All Analytics customers have access to Dynamic Tag Management, which
is the standard method to deploy Marketing Cloud tags.
64.
AppMeasurement
Libraries
AppMeasurement libraries providea mechanism for data collection when
the JavaScript tag method isn’t compatible with the device, application, or
system to be tracked.
Adobe has released AppMeasurement libraries for mobile devices (iOS,
Android, Windows Phone), rich media (Flash-Flex, Silverlight), and other
languages/frameworks (Java, .NET, PHP, XML). All of these libraries
leverage the Data Insertion API to pass data to reporting, which can also
be used for batch uploads or delayed data collection.
AppMeasurement libraries use cases include:
• Collect data on mobile apps and non-JavaScript supported
electronic devices;
• Send order confirmation server-side from a back-end
transactional system to reduce order count discrepancies
created by client-side browser issues;
• Measure telephone call systems and intranets;
• Track actual file downloads rather than clicks on download links;
• Use as a workaround for the IE URL limitation (IE has a 2083
character limitation that can truncate your image requests if they
exceed this threshold)
To link a visitor’s behaviour across JavaScript and tagless data collection,
you may need to generate your own visitor ID (unique identifier for a
particular visitor) so that the AppMeasurement and JavaScript values
match. Without a tie to a common visitor ID, AppMeasurement data is
typically collected in a separate report suite.
Classifications
Classifications enable you to upload metadata for custom variables (prop
or eVar). Metadata is data about data or attributes about your data. For a
particular campaign tracking code, article ID, or product ID, you can assign
multiple classifications to define or aggregate your data in various ways.
For example, for each campaign tracking code you can specify the
marketing channel, offer type, featured product, ad placement, creative
type, and so on. Each classification generates its own unique report, which
can be broken down by other attributes or dimensions.
Classifications are retroactive. If you want to reclassify or change some
metadata values, you can replace the classification file with an updated
version. While many attributes are text-based (brand, colour, size), a
special form of classification (Numeric 2) allows you to create metrics (cost
of goods sold) that can have different values for different time periods.
65.
Data Sources
You canimport other forms of time-based data. Use Data Sources to
upload offline metrics and to import data from other digital marketing
systems, such as your email or ad-serving vendor. In the upload process,
you specify and map the metrics and data dimensions to particular custom
events and eVars for reporting and analysis purposes.
There are two main types of Data Source uploads. First, you can upload
summary data, which attaches offline metrics to a subset of specified
reports (eVars). Second, the Transaction ID method enables you to link an
offline event to an online event through a unique transaction identifier that
is set when an online event occurs, such as a lead form submission. The
advantage of transaction ID data is that your uploaded metrics are fully
integrated with the rest of your marketing reports rather than a few
designated reports with summary data uploads.
Here are some common examples of how companies use Data Sources:
• Upload campaign metrics (ad impressions, campaign cost, etc.)
via summary data tied to campaign tracking codes;
• Import cost of goods sold data via transaction ID to analyse
gross margin performance;
• Tie product returns via transaction ID to close the gap between
gross sales and net sales;
• Upload closed offline sales via transaction ID to understand what
online tactics and behaviours are closing business deals, not just
generating leads;
• Bring in financial loan approvals, declines, and loan value from
offline processing via transaction ID;
• Import CRM data for data that may change over time, such as
customer lifetime value, customer type (silver/gold/platinum),
location, etc. via transaction ID.
A third type of Data Source upload is known as fully processed data,
which is used in limited cases for post-collection batch uploads (tied to
visitor ID or IP/user agent). It is handled as if it were received by Adobe’s
data collection servers at the time specified. The uploaded data is
indistinguishable from your normal report data, and there is not a
mechanism to delete the data if it is erroneous.
66.
Output Collection
The followingtable describes data output options.
Output
Option
Description
Marketing
Reports &
Analytics
The simplest way to access your data is through the marketing reports &
analytics interface. You can view and interact with your data in various ways and
via different types of devices (desktop, tablet, mobile phone, or HD display). Data
can be displayed, downloaded directly, or sent to other coworkers in various file
formats, such as PDF, Excel, Word, and CSV.
The Data Extract feature (found in most reports under More Actions > Extract
Data) lets you customise a default report with various values for the X and Y
axes. You can also bookmark custom reports and build interface-based
dashboards. The menu structure and reports can be customised to meet your
specific business needs. In addition, if you use ad hoc analysis or data
workbench, you can perform deep, ad hoc analysis on your marketing report data
in these advanced analytics tools.
67.
Scheduled
Reports
In marketing reports,you can schedule reports to be sent to different business
users on a recurring basis. You can control the recipients, format, time frame
(fixed or rolling), delivery frequency (daily, weekly, monthly, etc.), and so on.
The Publishing Lists feature enables you to distribute data from various report
suites to different groups or sets of email addresses. For example, you could
send out an external search report to multiple stakeholders, which would be
based on their unique location/report suite (France vs. Canada). You also have
the option of publishing a report builder (custom Excel-based) report rather than a
marketing report or dashboard. You also have alerts that can be configured to
send out a report when a particular condition or threshold is met.
Report
Builder
You can pull data directly into Excel using the Report Builder add-in. Report
Builder enables you to build customised data requests, which can be inserted into
your Excel worksheets and dynamically reference specific cells.
Using Report Builder’s data filters, you can extract and combine data points into
highly customised reports. Once an advanced dashboard has been created, it
can be manually refreshed or automatically published with the most up-to-date
information.
Reporting
API
If you would like to insert data and reports into third-party applications like an
intranet or company-branded application, you can use the Reporting API for
programmatic access to core report data. Through the Reporting API, you can
create customised reports that include calculated metrics and formatting options.
Version 15, you can generate reports based on segments. The Reporting API lets
you perform multilevel breakdowns across reports. See the API documentation
within the Adobe Developer Connection for more information.
Real-time
Report
Real-time Reports display web page traffic and ranks page views as data is
received in a full-screen web interface.
Data
Warehouse
Reports
If you have Data Warehouse enabled for Analytics, you can generate complex,
detailed reports that are delivered as CSV files via email or FTP. With data
warehouse reports, you build a query to filter your report data and isolate specific
data points. Data warehouse has a request manager interface and API to help
manage and prioritise data warehouse reports.
68.
Clickstream
Data Feeds
You cancombine clickstream data from marketing reports with other data in an
internal Enterprise Data Warehouse (EDW). The clickstream data feeds provide
the stream of raw, partially processed server calls from Analytics in a delimited
data set. The data feeds are configured at the report suite level and delivered on
a daily or hourly basis.
5.1.8.4.2 Data Types and Categories
Data source categories identify different data source types that provide similar functionality.
Categories provide a way to group data sources from a user’s perspective. When creating a
data source through the Data Sources UI, first select a data source category, then a specific
data source type. Each category contains types of data sources that support similar types of
data.
Data Sources has the following data source categories:
Web Site Usage
Data Source Processing Type Description
Web Server
Log Files
Web Log Most web servers generate log files that record every
page served. Using this data source, you can process
the log files from most web server data and add this
data to your reports.
Media
Optimizer
Bulk Upload
Conversion Provides manual and excel-automated bulk uploads in
Media Optimizer.
Site-level
Traffic Data
Source
Traffic Imports Traffic data for your entire web site. For
example, Page Views.
Breakdown
Traffic Data
Source
Traffic Imports Traffic data broken down by another web site
variable. For example, Page Views by Product.
Ad Campaigns
69.
Data Source ProcessingType Description
Generic Ad
Server
Conversion Lets you integrate impressions and other top-line
metrics about your ad serving activities from your ad
server into marketing reports. This is the generic ad
server data source and should be used if your specific
ad server is not supported.
Generic Email
Campaign
Server
Conversion Lets you integrate metrics from your email campaign
server into marketing reports.
Commonly incorporated metrics include the number of
messages sent, messages delivered and messages
read. This is the generic email campaign data source
and should be used if your specific email campaign
server is not supported.
Generic Pay-
Per-Click
Service
Conversion Lets you import data about your pay-per-click
performance including impressions, clicks, and costs.
This is the generic pay-per-click data source and should
be used if your specific pay-per-click service is not
supported.
Customer Relationship Management (CRM)
Data Source Processing Type Description
Generic Call
Center
Conversion Lets you integrate information about your call centre
into marketing reports. Metrics more commonly
imported include the number of calls, time on the
phone, the agent, and total sales.
This data source is the generic call centre data source
and should be used if your specific call centre software
is not supported.
Generic
Customer
Support
Application
Conversion Lets you integrate information from your customer
support software into marketing reports. It includes
metrics such as the number of new incidents, number of
incidents resolved, and the time spent resolving
incidents.
This is the generic customer support data source and
should be used if your specific customer service
70.
application is notsupported.
Customer Satisfaction
Data Source Processing Type Description
Generic
Survey Data
Conversion Lets you integrate survey results from a third-party tool
into marketing reports, and show how satisfied
customers are by their interactions with your site.
This is the generic survey data source and should be
used if your specific survey data service is not
supported.
Site Performance
Data Source Processing Type Description
Generic Site
Download
Speed
Conversion Lets you integrate data from an application or service
that tracks the speed of your downloads with your data.
This is the generic download speed data source and
should be used if your specific download speed
software or service is not supported.
Generic
Data Source Processing Type Description
Generic Data
Source
(Summary
Data Only)
Conversion Use this data source when there is no closer match to
the type of data you want to import into Marketing
Reports & Analytics.
Generic Data
Source (Full
Processing)
Full Processing Lets you import log file data. This data is processed as if
it were received by data collection servers at the time
specified (each hit receives a timestamp).
Generic Data
Source
(Transaction
Transaction ID
Visitor ID
Lets you tie any offline event to an online event. The
transaction ID acts as a key between the offline and
71.
ID) online events.
OnlinePurchases
Data Source Processing Type Description
Product
Returns
Conversion Lets you import product return data to associate with a
purchase ID so you can identify search engines,
keywords, campaigns and other attributes that are more
likely to generate returns.
Product Cost Conversion Lets you provide the actual cost of products purchased
and shipped from your web site by associating cost or
profit with individual products so you can accurately report
on the most profitable campaigns, keywords and internal
promotions for your web site.
Order Status Conversion Lets you use metrics to identify the status of every order
made, including orders canceled, shipped, completed, or
deemed fraudulent.
Order status reporting can identify which acquisition
methods generate the highest order completion rate.
Leads and Quotes
Data Source Processing Type Description
Lead
Generation
Conversion Lets you upload information about the results of the leads
for every lead generated on your web site, including
actual revenue generated.
After revenue is accurately attributed to lead IDs, you can
identify your most profitable campaigns and promotions.
Online Quote Conversion Lets you upload information about the results of the leads
for every lead generated on your web site, including
actual revenue generated.
After revenue is accurately attributed to lead IDs, you can
identify your most profitable campaigns and promotions.
Call Center
Data
Conversion Lets you upload call centre transactions so you can
identify the tactics (campaigns, promotions, and so on.)
72.
that lead customersto pick up the phone.
5.1.8.4.3 Current Data
The Include Current Data option in Reports & Analytics lets you view the latest Analytics data,
often before data is fully processed and finalised. Current Data displays most metrics within
minutes, providing actionable data for quick decision-making.
Current Data is enabled by default on all reports that support it. When enabled, metrics appear
in reports in one of three time frames, as explained in Typical Current Data Latency. If you
would rather view all metrics after the data is fully processed, you can disable Current Data by
removing users from the Current Data Users group.
Keep the following in mind as you view current data.
• Applying a segment to a report turns the current data view off. Segments are applied
to finalised data.
• Classifications are not applied to current data.
• Correlation, subrelation, and pathing reports do not provide current data. When you
run these reports, the Current Data toggle is disabled.
• Metrics introduced in v15, such as Total Time Spent and Bounces, do not provide
Current Data.
5.2 Reporting and Insights
5.2.1.1 Reporting
Reporting is the process of organising data into informational
summaries in order to monitor how different areas of a
business are performing. Reports are designed to interpret
data. They are used to summarise trends and offer
performance metrics for your website.
5.2.1.1.1 Props, eVars and Events
There are several types of variables available in Adobe Analytics. The two most popular types,
Props and eVars, allow your organisation to report on custom dimensions to your site that
standard out-of-the-box reports do not offer.
Remember to drive
insights and actions from
your data, not just
reporting.
73.
When determining whichvariables are assigned where, it is
important to understand the differences between Prop and
eVar functionality. Understanding these differences allows
your organisation to decide which type of variable is best to
use.
Differences between Props and eVars
The following are the main differences between Props and
eVars:
Naming convention Props are considered traffic variables, meaning they are used to
report on popularity of various dimensions of your site. eVars are considered conversion
variables. They are used to determine which dimensions of your site contribute the most
to success events.
Persistence Props do not persist beyond the image request they were fired on. They
cannot be associated with other variables that are not in the same image request. eVars,
however, are persistent. A back-end variable is used to preserve the value originally
fired so it can associate itself with success events later on.
Success events Success events, also known as conversion events, are metrics that
measure the number of times a visitor reaches a goal. This event can be anything from
purchasing something on your site, to subscribing to a newsletter. eVars are designed to
report on success events, to show you which values are most successful in influencing
visitors to reach your goals. Traffic variables do not have this same functionality.
However, you can view participation metrics if you configure your report suite correctly.
Pathing Props can use pathing, which allows your organisation to see a given path a
user took within the context of the variable being viewed. An Adobe representative can
enable pathing, if requested. eVars cannot use pathing.
Potentially available metrics The metrics available between Props and eVars vary
widely based on the variable's settings and data platform/version. The following list
illustrates what can be enabled, not what is enabled by default. If you want a specific
metric in reporting but do not see it, have one of your organisation's supported users
contact ClientCare.
Both Props and eVars:
Instances, page views, visits and unique visitors
Bounces, bounce rate, entries, exits, and total time spent
Participation metrics and calculated metrics
Props (Traffic variables):
Average time spent, average page depth, reloads, and single access
80per cent of reports
are out-of-the-box
with good page-
naming (prop).
Implement this right
and you’ll drive
significant benefit
from the product.
74.
eVars (Conversionvariables):
All shopping cart metrics
All purchase metrics, such as orders, units, and revenue
All custom conversion events
Breakdowns Props use correlations, which display page views for other traffic variables
fired in the same image request. eVars use subrelations, which provide a breakdown on
other conversion variables in relation to success events.
The product’s conversion variable is used in conjunction with an event to pass product
information like product name, category, price, etc. Unlike eVars, this variable is not persistent
and can hold multiple values.
Adobe Analytics provides you with up to 75 custom eVars and 75 Props variables.
Events
Events are completed visitor actions on your web site, and Analytics provides some built-in pre-
defined events as well as the ability to create your own custom events. By default, events are
counters that you increment, but you can also use currency and numeric values as an event
type.
The pre-defined events are most often associated with e-commerce sites and are prodView,
scView, scOpen, scAdd, scRemove, scCheckout, and purchase.
Analytics provides you with 100 custom events that are named event1 through event100.
Examples of custom events might be login, registration, and signup.
5.2.1.1.2 Site Overview Report
The Site Overview report provides a general view of the report suite. This page is dynamically
generated and displays high-level metrics and page-level data relevant to your report suite,
immediately after you log in.
The Site Overview report is interactive. You can update individual reportlets, change dates and
report suites, and apply segments. The Site Overview report does not override your
dashboards, but you can save it as a dashboard. If desired, you can designate any dashboard
or bookmark to display to all users upon log in.
75.
5.2.1.1.3 Report Types
TrafficReports
Traffic reports give you in-depth insight into how visitors interact with your web site, and your
customised traffic statistics.
Traffic reports let you:
• Analyse critical aspects of visitor behaviour;
• Monitor and understand traffic patterns;
• Determine popular site content;
• Segment visitors by any measurable criteria.
Conversion Reports
Conversion reports display information about success indicators that you define. When you
initially acquire licences, you have an option to define metrics that indicate or give additional
insight into successful sales or content deliveries. Reports here show numbers for these
metrics. Examples include payment types, shipping costs, and online coupons used.
Campaign Reports
76.
Campaign reports providecomprehensive, accurate, and detailed analysis of customer activity.
Metrics such as campaign management, sales cycle, customer fallout, and customer conversion
let you measure e-commerce transactions, sources of sales, advertising effectiveness,
customer loyalty, and more.
By running the Internal Campaign Report, you can see which campaign generated the most
onsite conversion.
• Custom Conversion reports are based on eVars (conversion variables).
• Conversion variables can persist beyond the page view and be associated with
metrics within its specified expiration.
• The reports’ default metrics are revenue.
• View these reports in both trended and ranked formats.
• You can use SAINT Classifications in these reports, to rename and consolidate line
items.
• These reports can be broken down by the following if basic subrelations are enabled:
o Campaigns and products, with all related classifications;
o Customer loyalty;
o All fully-subrelated eVars.
• Additional reports are available to break down when full subrelations are enabled:
o Time spent per visit;
o Pages and site sections, with all related classifications;
o Entry pages;
o Almost all traffic sources reports;
o Visit number;
o Many visitor profile and technology reports;
o All other eVars;
o Marketing channels first and last touch.
• The following events can be used as metrics:
o Instances — the number of times the eVar was defined.
o All standard eCommerce metrics — revenue, orders, units, carts, cart
views, checkouts, cart additions, cart removals;
o All custom events — Events 1-80, and Events 81-100 if on H22 code or
higher;
o Visits and visitors — available depending on organisation and report suite.
Contact your Adobe Customer Success Managerfor additional details
Paths Reports
77.
Paths reports letyou track and record entire browsing paths of visitors and customers. You can
view your site traffic as it flows from one page or item to the next, discover new patterns and
popular paths, or search out the specific paths that your visitors take.
Paths reports include standard in-depth and optional advanced analysis reports that reveal the
click-stream of pages viewed. You can uncover full paths, longest paths, and most popular
paths; explain page flow, fallout, and dropout graphically; show new and changing patterns over
time; and analyse entry and exit paths.
Next Page Flow or Next Site Flow Displays a two-level-deep branching graphic of a selected
page (or section, department, and so on), that your visitors view after moving away from the
selected page. Use this report to analyse and identify the steps your visitors take most often
after viewing a selected page. You can:
• Understand what steps are taken most frequently after viewing a selected page;
• Optimise your site path design to funnel your traffic to a desired goal page;
• Identify where visitors are going instead of your desired goal pages.
Next Page (or next categories) Provides detailed site path analysis by showing you the pages
on your site that visitors viewed after seeing a selected page. For example, when selecting and
reporting on your entire site, the report shows you the top ten landing pages, with the five most
popular next pages listed below each landing page. This data can help you understand which
content, features, and other data, most often compel your visitors to move through your site.
Previous Page Flow (or other previous categories flow) Displays two levels of the most popular
pages that your visitors view before the selected page. The report also highlights when visitors
enter your site.
Previous Page (or other previous categories) Provides detailed site path analysis by showing
you the pages on your site that visitors viewed before seeing a selected page on your site.
Fallout: Displays the visit attrition and conversion rates between each checkpoint you define.
Steps are arranged top-to-bottom, with raw numbers and percentages shown on the left, and
conversion and fall-out percentages on the right.
78.
PathFinder Lets youfurther dissect your full paths into fragments, yielding the precise patterns
that are instrumental to optimising your site. The Pathfinder wizard lets you specify selection
criteria that are used to generate the report, so that you can analyse the path fragments and
query for ones that begin with a certain page, end with a certain page, or even ones that begin
with one page and end with another.
Path Length Shows how deep visitors browse into your site (both by percentage and by total
count). In other words, the report indicates how many pages the average visitor to your site
views before leaving.
Page Analysis Contains a subset of reports that let you analyse the following:
• Page Summary or Site Category Summary Tells you everything you need to know
about the page report. It collects and organises page-specific information about a
single page and presents it in a single report.
• Reloads Shows the number of times individual pages were reloaded by visitors.
• Time Spent on Page or Site Category: Displays the length of time that visitors
browse individual pages in your site. The time spent is divided into ten categories:
less than 15 seconds, 15-30 seconds, 30-60 seconds, 1-3 minutes, 3-5 minutes, 5-10
minutes, 10-15 minutes, 15-20 minutes, 20-30 minutes and greater than 30 minutes.
• Clicks to Page Identifies the number of clicks visitors used to access each page in
your site. Depth for a page is measured by counting the number of pages viewed
before it.
Entries & Exits The Entry Page report shows you, by percentage and by total visits, which
pages on your site are the first ones seen by new visitors. You can view:
• Entry Pages (or sections) Displays, by percentage and by total visits, which pages on
your site are the first pages seen by a new visitor. You can use this report to identify
which of your web pages are the most frequent points of entry, optimise the primary
entry points on your site, and drive entry traffic to your key messages.
79.
• Original EntryPages Shows the first page viewed for first-time visitors to your site.
Each user is counted only once unless they delete their cookies or are not being
tracked with cookies.
• Single Page Visits Shows pages that are most often both the entry and exit pages for
visitor browsing sessions.
• Exit Pages Displays, by percentage and by total visits, the pages on your site that
were the last pages visitors viewed before leaving your site.
Ranked Report
In a ranked report, the table shows the rankings of the report pages in relation to the metric,
according to number or percentage. Ranked reports can display multiple metrics in a report.
Trended Report
Trended reports display metrics over time. You use this report type when you want to see how a
segment performs from one time period to the next.
Anomaly Detection Report
Anomaly Detection shows two types of charts: A summary chart and individual metrics charts.
Individual metric charts are only shown if at least one anomaly has been detected for that
metric.
Anomaly detection summary chart
What it does:
Each box represents one anomaly, tracked per day, that corresponds to a metric below.
80.
• Green indicatesanomalies above the trend line, blue below the trend line.
• Indicates the strength of the anomaly — the greater the anomaly, the darker the
colour of the data point and the farther away from the trend line.
• Clicking on an anomaly brings that anomaly’s individual metric chart (underneath the
summary chart) to the top.
• The deviation percentage values (left of chart) are calculated as follows:
o If the upper bounds and the expected value are the same, the deviation %
is 100%
o Otherwise the deviation % is ((actual value - upper bound value) / (upper
bound value – expected value)) * 100
o If the lower bounds and the expected value are the same, the deviation %
is -100%
o Otherwise the deviation % is ((lower bound value - actual value) / (expected
value - lower bound value)) * -100
• Clicking Show Segments brings up the segment rail that lets you apply segments to
an anomaly detection report.
• Clicking Edit Metrics lets you select and unselect metrics for which you want to
detect anomalies.
Individual Metric Chart
What it does:
• Displays anomalous data points for individual trended metrics (including calculated
metrics) as dots.
81.
• Shows themost recent anomaly on top, and secondarily ranks by number of
anomalies.
• Displays a solid line to indicate actual data currently collected. This is compared to
the forecast and margin of error to derive whether data points are anomalous.
• Displays a dotted line that represents a forecast based on historical data (for
example, the training period).
• Displays upper and lower 95 per cent confidence intervals/bounds in a grey shade.
• Lets you collapse and expand individual reports by clicking the double up or down
arrows next to the metric name.
• Changes the order in which the metric charts appear by reacting to drill-downs in the
overview report (see above).
• Lets you filter charts by using search terms, such as “page”, for all page-related
metrics.
• Lets you display all metrics you defined or only those with anomalies.
Conversion Funnel Report
Conversion Funnel reports display the percentage of visitors who progressed through a set of
events in order to perform a desired action. For example, you can see how many visitors
progressed from visiting your web page, through adding items to a cart, and then to purchasing
an item. This report also shows the number who fell out along the way.
Fallout Report
The Fallout Report shows the number of visitors who visited a pre-specified sequence of pages.
It also shows conversion and fallout rates between each step.
Page Flow Report
Page Flow reports show the order in which your visitors access pages and navigate through
your site.
Funnel Report
You can select success events and add them to a Purchase Conversion Funnel report or
a Product Conversion Funnel report.
Marketing Channel Report
Marketing Channel reporting provides an overview report of the first and last-touch channel
allocation, with standard reporting metrics like revenue, orders, and cost. These reports enable
you to analyse how much revenue each channel generates.
For detailed information on how to run reports, go to Report Types.
5.2.1.1.4 Classifications
82.
Classifications are createdby grouping (classifying) granular data from a source report. For
example, you might want to analyse display ads, but they are mixed with email, partner, text ad,
and social media campaigns. You can create groups so that you can analyse them separately.
There are three types of classifications for marketing reporting and analytics:
• Campaign classifications — elements that will not vary within the campaign, such as
campaign name and owner.
• Creative elements classification — vary between placements or instances of the
campaign, and include characteristics such as media type, headline, keyword, and
media vendor.
• Metric-specific classifications — fixed numeric values associated with a campaign, such
as the hard cost for a campaign. Additionally, you can classify prop and eVar variables.
5.2.1.1.5 Dashboards and Reportlets
A dashboard is a collection of thumbnail reports
called reportlets. A dashboard is most useful when it contains
related reportlets that give you complete overviews of certain
aspects of your site, such as finding methods, visitor profiles,
and so on.
You can add most marketing reports to a dashboard, including
graphically intense reports like the Fallout Report, Conversion
Funnel Report, and the Pathfinder Report.
You can also set a dashboard as your landing page, share dashboards with other users, and
schedule them for delivery. If you do not set a dashboard (or a bookmark) as a landing page,
the Site Overview report displays, and you can then save and customise it as a dashboard.
Setup a dashboard
user login which a
couple of people have
access to so that when
people leave or move
roles the scheduled
reports aren’t affected
83.
5.2.1.1.6 Reporting BestPractice
Adobe Analytics provides a flexible reporting interface that lets you generate a variety of
complex reports. While most reports generate very quickly, you might encounter reports that
timeout or fail to generate successfully. To help avoid report generation failures, this section
explains many factors that impact report generation speed. Understanding this information can
help you structure reports so they are more likely to generate successfully.
Note that these recommendations apply to Reports and Analytics, Ad Hoc Analysis, and Report
Builder. They do not apply to Data Warehouse, which provides a separate list of best practices.
An additional set of best practices is available for the Adobe Analytics Reporting API.
Report Timeouts and Request Queue
Timeouts
A single report is broken into multiple requests (one per breakdown), and each request is
subject to an individual timeout. Scheduled reports are granted longer timeout periods and are
more likely to succeed than reports that are generated directly in a user interface.
Report Suite Queue
Each report suite maintains a separate queue of requests. If many reports are requested
simultaneously, even from separate users, a small number of reports are generated
simultaneously. As reports complete, remaining reports are generated in the order in which they
were received. As a result, if a large number of complex reports are already in the report suite
queue, a report that typically generates quickly might time out.
84.
Factors that AffectReport Speed
The following factors contribute to longer report generation times. Increasing one of these
factors might not result in a timeout for that report, but it might delay other reports in the report
suite queue and cause a subsequent report to timeout.
Time range The largest factor that affects report generation time is the number of months
requested. Reducing the number of months from three to one decreases generation time
significantly, but reducing the time range from one month to one week does not have a large
impact on report generation time.
Number of metrics As the number of metrics increases, the report run time increases.
Removing metrics often improves report generation time.
Number of breakdowns Within a report, each breakdown represents a separate request. While
individual requests may complete quickly, running thousands of breakdowns in a single report
can significantly slow down report generation time and affect the report suite queue.
Segment complexity Segments that consider many dimensions or have many (24+) rules
increase the processing impact and increase the report generation time.
Number of unique values Reports that contain hundreds of thousands of unique values
generate more slowly than reports that contain fewer unique values, even if the segment or filter
reduces the number of values that ultimately appear in a report. For example, a report that
displays search terms typically generates more slowly than other reports, even if a filter is
applied to show only search terms that contain a specific value.
Other Reporting Options
In addition to reducing the time range, number of metrics, and number of breakdowns in a
report, the following guidelines help increase reliability of report delivery.
Use Data Warehouse to request reports that contain many breakdowns or metrics. Data
Warehouse is designed to generate these types of reports.
Schedule reports to run during non-peak hours. This increases the likelihood of a report
returning because the request queue for a report suite is more likely to be empty during those
times.
Report Builder can be used to break reports into smaller time ranges and requests that contain
fewer metrics. You can then use native Excel functionality to merge data from various requests
into a single report.
5.2.1.1.7 Targets
85.
Targets let youmeasure your web site performance and track progress against target goals. For
example, you might want to increase the number of visitors that
come from a geographic region, the revenue per order, or the
number of hits that come from a specific referrer.
When you create targets, you select which attribute metrics or
eVars you want to measure, or you can choose to measure your
entire site against your selected metric.
You can measure the number of unique visitors to your web site, and use it as a target. In this
case, choose the entire web site. However, if you want to target the number of unique visitors to
your web site from a specific area, you can specify that eVar rather than look at your entire site.
Target Field Descriptions:
Element Description
Target
Name
Specify a target name, which is displayed on the Target Manager page.
Apply To5.2.1.1.7.1.1 Apply the target to the entire site or to a selected attribute or eVar.
Select Item
Displays the selection form for the selected attribute or eVar, so that you can
perform an Advanced search for related items. For example, if you select the
eVar Countries, the item list lets you specify which country. If you select the
eVar Products, the item list lets you specify which product. Custom insight
variables are also listed in the menu. If you have a custom insight variable
set up to measure visitor age ranges, then the item list displays the ranges
of the ages, such as 18-24, 25-35, and so on.
Metric5.2.1.1.7.1.2 Spply the target to a metric. This menu displays only those metrics that
apply to a given eVar. For example, if you select Products as the eVar, a
metric such as Page Exits does not apply to it. The Page Exits metric can
apply to a web page eVar.
Period5.2.1.1.7.1.3 Define the Date Range and Granularity settings of the target. Depending
on your date range specifications, some granularity options do not apply.
When typing values for your metrics, type a value for each granularity
setting. For example, if your date range is the month of February, and your
granularity selection is weekly, type a value for each week of the month of
February. Target reports display for each granularity setting.
Values5.2.1.1.7.1.4 Specify target values for the time period and the selected metric. These
value are the target numbers that you are attempting to reach. For example,
Targets provide a quick
reference for how you
are performing against
your business goals.
86.
if the targetswere based on revenue, and you were aiming for $10,000 of
revenue for a given month, you would enter 10000 in the value field for the
month.
5.2.1.1.8 Alerts
You can send alerts via email or to a mobile device when criteria that you specify are met. For
example, if a report shows that data reached a specified high or low point, or the values have
changed by a specified percentage, you will receive an alert.
Alerts are specific to the type of report you are viewing. For example, to set an alert for the Cart
Views metric, you need to be in the Cart Views report. You can also assign alerts to
classification reports.
Note: Alerts still work when assigned to a report with a segment applied.
When you set up alerts, you can configure analytics reports to check your web site statistics at
the end of each day, week, or month. You can receive an alert when your metric reaches a high
or low value that you set, or if it changes by a certain percentage (either up or down).
For the specified time frames, analytics reports use the sum of the total amount for the alert. For
monthly alerts, if the total of hits for the calendar month reaches the number you specify, then
the alert is sent.
Alerts Field Descriptions
Element Description
Alert Name Specify a name for the alert. The alert name might contain the name of the
report or the metrics threshold.
Check values
at the end of
each
Specify when you want the metrics to be checked. You can specify Day,
Week, or Month.
Assign Alert
to
The metric for the alert to check at each interval. Option only available in
reports with line items.
87.
Apply the
alert to
Canbe applied to all items, the top 1000 items, or specific items. If the top
1000 items or specific items are selected, each individual line item triggers
the alert, not the summed total. Option only available in reports with line
items.
Note: If you apply a segment to a report before creating the alert, the
segment applies to the alert.
Rule Determine the threshold the metric must exceed before an alert is set. You
can set this value to a threshold and then to one of the following
conditions:
• Is Above
• Is Below
• % Changes By
Delivery
Options
Specify where the alert can be sent. An alert can be sent as an email or a
mobile alert, or both, to addresses you specify in the fields provided for
that purpose. When sending an alert to a mobile device, use the SMS
email address appropriate to the carrier. For example;
8015550000@messaging.mycellphonecompany.com.
5.2.1.2 Analytics Segmentation
Adobe Analytics lets you build, manage, share, and apply powerful, focused audience segments
to your reports using Analytics capabilities, the Adobe
Marketing Cloud, Adobe Target, and other integrated Adobe
products.
Analytics segmentation includes the Segment Builder to
construct segments and run a pre-test, and the Segment
Manager to collect, tag, approve, set security, and share
segments across your organisation.
Data Scientists and Marketing Analysts can employ, extend,
and refine segments for analysis specific to his or her needs,
and then save the segment for other users to extend, refine and save as a new segment to the
library. Once set in motion, it’s a cycle of designing and managing codified audience insights
as a unified segment workflow.
5.2.1.2.1 Setting up a Segmentation Workflow
Adobe Analytics
comes with some pre-
built segments. Use
these to get the
business up to speed
and familiar with
segmentation.
88.
This is asuggested workflow for segments created with the Segment Builder and managed
through the Segment Manager
89.
Step Workflow TaskDescription
Planning
Segments
Have you asked all the right questions before building segments
and setting up a segment management environment? Have you
designed the segment with its intended purpose and distinct
usage in mind?
See the Segment Planning Checklist for help in planning and
organising your segments.
Building
Segments
Build and edit segments for use in all Analytics capabilities.
Tagging
Segments
Tag segments for ease of organisation and sharing. Tagging
replaces folder hierarchies in ad hoc analysis. See how to plan
and assign tags for simple and advanced searches and
organisation.
Approving
Segments
Approve segments to make them canonical.
Applying
Segments
You can apply segments directly from a report, from the segment
rail (Show Segments).
Sharing Segments Share your segments with the intended audience in other
Analytics tools and to Adobe Target and the Adobe Marketing
Cloud.
Filtering
Segments
Filter by tags, owners, and other filters (Show All, Mine, Shared
With me, Favorites, and Approved.)
90.
Marking Segment
as Favorites
Markingsegments as Favorites is another way to organise them
for ease of use.
5.2.1.2.2 Planning Your Segmentation Environment
Devoting some time to plan segments improves the chances that they will be useful for your
organisation and that their numbers will be kept in check.
1. Consider the audience. Who will consume it? With whom will you share it? Which groups
of people will use this segment and how should I tag it accordingly? This also means
providing a good segment description. At minimum, the description should answer these
questions:
What is this segment useful for?
When should I use this segment?
2. Determine the segment scope. Which segment container best represents the scope? Use
the smallest container possible.
3. Decide which elements to include in the segment definition, and which values.
Consider variable persistence in this decision.
4. Consider how you want your approval process to unfold. Will a single person review and
approve segments or will it be a committee decision?
5. Define your segments with view to a segment library that gives business users the ability
to stack and reuse segment pieces or components in a modular fashion. What “modules”
do you need to define to make this library a reality?
Features of Advanced Segmentation:
• Unlimited real-time segmentation
Easily compare concise visitor segments side by side to identify new audiences, gather
actionable insights, and see how customer behaviour changes over time.
• Behaviour visualisations
See how your visitors use — or don’t use — your digital properties, and leverage the
insights to improve site design, navigation, content layout, product affinity, and
conversion.
• Online and offline personalised customer analysis
91.
Connect and combinecustomer data from traditional, digital, and in-store marketing
channels to get a more comprehensive view of unique customer behaviours and
attributes.
• Audience clustering
Analyse large numbers of variables simultaneously to turn new relationships into
actionable audiences quickly for further analysis, targeting, and personalisation.
5.2.1.3 Reporting and Insights
Having successful analysis generated in your business comes
from being able to understand business drivers and continually
provide valuable insights and actionable recommendations to
the business.
The three key stages for your business when producing
analysis and insights are:
1. Pre-Analysis: What to do before beginning
analysis.
2. Analysis: How to approach your analysis.
3. Presentation: How to translate insights into a compelling deliverable
5.2.1.3.1 Pre-Analysis
Understanding enterprise objectives comes first.
Without a clear understanding of what is most important to your business, you may go
astray in your analysis.
Fuzzy enterprise goals will lead to misguided analysis and irrelevant recommendations.
Try to seek direction from as high up within the organisation as possible.
o You will notice a clear difference between the direction provided by an executive
(strategic) compared to that from a low-level employee (tactical).
Assume your goals will change over time.
What may have been a priority last month or quarter may not be a priority now.
Business needs may change frequently from quarter-to-quarter, and even week-to-week.
Client personnel change.
Business strategies evolve.
Web sites are redesigned.
New campaigns and products are launched.
Before beginning any analysis, it may be a good idea to confirm what is most important
within your company.
Use the 80/20 rule
when assigning tasks
for your business
analysts in doing
insights and actions
versus reporting.
92.
Topical andtimely analysis of your company’s hot issues will always deliver more value.
Know your audience.
When possible, try to determine who will be receiving your analysis
Different audience members may have varied agendas, and you need to be aware of
their different agendas as much as possible.
You need to be sensitive to how people may receive your analysis or recommendations
if it affects their role, responsibilities, budget, or performance evaluation.
5.2.1.3.2 Analysis Summary
Quantify or monetise the impact of your recommendations.
Help decision-makers see the value of your recommendations by quantifying them in
terms of KPIs (such as additional leads), and the value to the organisation (such as
increased revenue or cost savings).
Ensure others can logically follow your calculations in how you arrived at your projected
impact.
Be conservative in your calculations so that they aren’t quick to dismiss your impact
projections as unrealistic.
Draw on separate research or business data for additional insights.
Recommendations should be data-driven.
Sometimes we may have opinions about what does or doesn’t work online.
Web sites should always have an on-site search engine.
The checkout process should only be three steps long.
Unless we can support a recommendation with data, we should never make a
recommendation simply based on our personal preferences.
5.2.1.3.3 Presentation Summary
Tell a story rather than providing a data dump.
You will need to guide your audience through your analysis findings and
recommendations.
Providing a logical framework for your analysis will make your recommendations more
impactful.
Similar to telling a story, you will need to build up interest to your presentation’s climax,
your key findings, and recommendations.
Digital analysis should follow this flow or format:
93.
Problem (beginning);
Analysis and findings (middle);
Recommendations (end);
Next problem (beginning);
Next analysis and findings (middle);
Next recommendations (end);
Etc.
Use cases, screenshots, and other examples, add “colour” to your analysis and help your
audience to understand the importance of your findings and recommended solutions
Highlight what’s valuable, not your work.
You may have to turn over ten rocks to find a single golden nugget.
Two hours of analysis may be spent on the nugget, but it might have been
preceded by 20 hours of fruitless exploration in other areas.
It can be tempting to show all of the rocks you turned over.
You need to focus on valuable, actionable insights rather than analysis that went
nowhere, regardless of how innovative or time-consuming the approach was.
Highlight key takeaways.
Key takeaways should be simple so that non-technical business users can follow them.
(avoid analytics jargon).
Besides final recommendations, key takeaways can be small insights into visitors, site
performance, or implementation gaps that you have uncovered during the analysis
process.
Special text boxes can be used to highlight a slide takeaway.
5.3 Usage
Once Adobe Analytics is in place, how your company uses the tool
becomes important because it will help you maximise your investment.
Usage is all about establishing and leveraging best practices that will
help you with your overall reporting, analysis and decision-making.
Here are a few questions you will need to consider:
• How will you manage time and resources spend on reporting
and deep-dive analysis?
Use Adobe
Analytics report to
monitor your mbox
calls against your
contracted volume
94.
• If youranalysts are going to be overloaded with reporting and analysis requests each
week, what tools and workflows you need to implement to help them prioritise those
requests?
For routine reports and business questions, it may be helpful to agree on the best approach to
ensure numbers match up properly regardless of who is building the report or performing the
analysis.
5.4 Sustainability
Sustainability focuses on having the right structure and measures in place to support or sustain
Adobe Analytics post-implementation. These processes ensure that your analytics
implementation, reporting and insights do not go off course in six to twelve months. Some
examples of sustainability practices include documenting each deployment for future reference,
establishing and enforcing corporate standards, creating a centralised knowledge base of
metrics and reports and scheduling periodic implementation reviews.
To keep up with the latest updates and releases in Adobe Analytics, go to Documentation
Updates.
5.5 Change Management
Change management is about managing the people side of change. In order for this to happen,
leaders, employees, and partners may need to adjust existing attitudes and behaviours.
Define change management mission:
• Ensure documentation of all proposed changes;
• Ensure verification of technical completeness;
• Ensure timing of change executions does not conflict;
• Ensure appropriate management involvement (sign-offs, approvals, deferrals);
• Ensure the verification of successful testing to the degree required by organisation
standards before change introduction;
• Ensure documentation of actual change (enable communication of change results,
provide a history of changes, support the maintenance of systems documentation).
Define change management guidelines:
• Monitor all changes;
• Formal change management system must be in place;
• Define the change management life cycle functions
95.
6 Product
6.1 SolutionArchitecture – Inputs and Outputs
Input Options
JavaScript Tags
• Place JavaScript code within pages, which sends page, browser, and visitor data to
Adobe Analytics.
• Primarily known as the web beacon or image request method.
• More organisations are using tag management solutions (DTM) to deploy and manage
JavaScript files.
• Deploying JavaScript tags is now even easier with the new context variables and
processing rules, which give both the developer and marketer more flexibility and control
over their implementation.
AppMeasurement Libraries
• Measurement libraries provide a mechanism for data collection when the JavaScript tag
method isn’t compatible with the device, application, or system to be tracked.
• AppMeasurement libraries include mobile devices (iOS, Android, Windows Phone,
Symbian, BlackBerry), rich media (Flash-Flex, Silverlight), and other
languages/frameworks (Java, .NET, PHP, XML).
• All these libraries leverage the Data Insertion API to pass data to SiteCatalyst, which can
also be used for batch uploads or delayed data collection.
96.
• Examples includecollecting data on mobile apps and non-JavaScript supported
electronic devices, sending order confirmation server-side from a backend transactional
system to reduce order count discrepancies created by client-side browser issues.
• In order to link visitor behaviour across JavaScript and tagless data collection, you may
need to generate your own visitor ID so the two values match
SAINT Classifications
• Enables you to upload metadata for Adobe Analytics custom variables (prop or eVar)
(metadata is data or attributes about data).
• Each classification generates its own unique report in Adobe Analytics, which can be
broken down by other attributes or dimensions.
• Classifications are retroactive so you can re-classify values at a later point.
Data Sources
• Used to upload offline metrics and data from other systems/tools.
• Specify and map the metrics and data dimensions to particular custom events and eVars
for reporting and analysis purposes.
• Two main types of Data Sources are summary data and transaction ID.
• Summary data ties offline metrics to a subset of specified reports.
• Transaction ID data enables you to link an offline event to an online event through a
unique transaction identifier.
o The advantage of the transaction ID approach is that your uploaded metrics are
fully integrated with the rest of your Adobe Analytics reports, not just a few
designated ones;
o Examples: cost of goods sold to analyse gross margin performance; product
returns to close the gap between gross sales and net sales; upload financial loan
approvals, declines, and loan value.
Output Options
Adobe DMS Interface
• You can interact with your data in the DMS interface via desktop, tablet, mobile phone or
HD display.
• You can download reports in multiple file formats such as PDF, Excel, Word, CSV, etc.
• Data Extract feature lets you customise a default report with various values for the X and
Y axes.
• You can bookmark custom reports, build dashboards in the Adobe Analytics interface,
and even customise the menu structure.
• You can leverage Adobe Discover and Adobe Insight for deep-dive, ad-hoc analysis on
your Adobe Analytics data.
Scheduled Reports
• Schedule reports to be sent out to different business users on a recurring basis.
• Control the recipients, format, time frame (fixed or rolling), delivery frequency, etc.
97.
• Publishing listfeature enables you to distribute data from various report suites to
different groups or sets of email addresses.
o Could send out an external search report to multiple stakeholders, which would
be based on their unique location/report suite (France vs. Canada).
• Can publish a Report Builder report rather than an Adobe Analytics report or dashboard.
• Alerts can be configured to send out a report when a particular condition or threshold
• is met.
Excel Integration
• Can pull data directly into Excel using the Report Builder add-in to create advanced
dashboards and custom reports.
• Enables you to build customised data requests from Adobe Analytics, which can be
inserted into your Excel worksheets and dynamically reference specific cells.
Reporting API
• Insert Adobe Analytics data and reports into third-party applications such as an intranet
or company-branded application, using programmatic access to Adobe Analytics core
report data.
• Reporting API can access calculated metrics, formatting options, and multi-level
breakdowns.
• Alternatively, Adobe Analytics Widget is a simple tool for pulling bookmarked reports and
dashboards into web pages, intranet pages, or other HTML-based applications.
Live Stream
• Streaming API provides hit-level, real-time data collected on a page within 30-90
seconds.
• If you miss the data, it is gone so it is not appropriate for a system of record scenario
(data feeds would be more suitable).
• Generates a high volume of data so clients need to be prepared from a hardware
perspective.
• Common use cases will include complex, real-time dashboards, content
recommendations, and remarketing.
Data Warehouse Reports
• Generate ad hoc data reports, which are delivered as CSV files via email or FTP.
• Build a query to filter data and isolate specific data points.
• Vast majority of requests take less than a day to process, but depending on the
complexity of your query and the amount of data it can take longer to process.
• Have a request manager interface and API to help manage and prioritise Data
Warehouse reports.
Data Warehouse Data Feeds
• Can be used when a client wants to combine its clickstream data from Adobe Analytics
with other data in an internal Enterprise Data Warehouse (EDW).
98.
• Provides thestream of raw, partially-processed server calls from Adobe Analytics in a
delimited data set.
• Configured at the report suite level and delivered on a daily basis (containing hit data for
the previous day) or hourly basis.
• Can be delivered via FTP in a single zipped file or multiple zipped files (recommended).
Data Connector Integrations (formerly Genesis)
• Streamlined way of importing and exporting data out of Adobe Analytics.
• Pre-built data connector integrations (email, survey, ad serving, social media) simplify
the process of importing data from other marketing applications and also give you
control over what Adobe Analytics data is shared with these third-party vendors.
• Data connectors leverage all of the aforementioned input and output mechanisms to
automate the process of capturing and sharing data with other systems.
6.1.1 Data Workbench
With Data Workbench, you and your team will be able to get a 360-degree view of your
customers. You can also collect, process, analyse, and visualise big data from online and offline
customer interactions. More importantly, Adobe Analytics does it in real time and at scale, so
you can quickly turn terabytes of information into actionable information that can be shared with
stakeholders and used to make decisions that can improve the performance of your business.
Data Workbench features:
• Personalised customer targeting
99.
You can bringtogether data from both your online and offline marketing channels to
provide deeper insights around customer behaviours.
• Online and offline insight for retail
Analyse constantly changing data volumes, including data from point-of-sale, kiosk, and
inventory systems, as well as from multiple web properties. Uncover behaviours and
trends across channels and then target customers through the best avenues.
• Online and offline insight for call centres
This feature will help you understand how customers are navigating across various
channels, such as web, live chat, IVR, and interactions with call centre agents. Overlay
customer satisfaction and customer sentiment to find the right balance between
servicing cost and customer satisfaction.
• Engagement scoring
Develop detailed, accurate engagement scores based on online and offline activity to
personalise content, better identify where buyers are in the purchase cycle, and give
sales teams more meaningful customer information.
• Campaign attribution
Look at the sequencing of all the campaigns and events that touched prospects or
customers before they converted. Use this information to develop campaign-attribution
models that include both online and offline strategies.
• Advanced display attribution and retargeting
See which display ads people saw on third-party sites prior to arriving at your site, even
days before. Know which banner ads are the most effective and should be used in more
campaigns.
Data Workbench Architecture
100.
6.1.2 Cross-Channel Attribution
Customersinteract with your brands in many different ways, which can make it hard to
understand their complete journey to conversion. They might see your television ad, come to
your site through Facebook, but then finally buy your product in a store two weeks later. The
Adobe Analytics cross-channel marketing attribution capabilities reveal the complete sequence
of events that lead to conversion.
Why is it important to use cross-channel attribution?
• Test and understand the results of shifts in your digital marketing efforts.
• Understand where certain marketing channels contribute in the marketing influence
funnel.
• Get more efficient with marketing efforts and avoid cannibalisation.
• Easily explained and understood by the business and your partners to allow true
valuation of partners and affiliates.
• Enhance your PPC bid management and optimisation.
Digital analysts and marketers repeatedly face the challenge of accurately measuring the impact
of their marketing investments – a process known as attribution. Marketers are continually
asked to demonstrate the effectiveness of their marketing decisions across paid, earned and
owned channels. Increased spend of digital marketing dollars has led to the critical need to
measure and manipulate the channel controls and customer interactions that impact business
goals. Attribution is the process of measuring and assigning credit to touch points and customer
interactions that influence a customer along the entire path to conversion.
To achieve cross-channel marketing attribution you must see all your marketing channels in one
place, but you also need to be able to stitch the events through time together. For instance, on
day one, a prospect sees banner ad of your product on a favourite blog, clicks on it, and visits
the landing page. On day three, the prospect makes a word search about your product on Bing,
comes to the site naturally, and visits numerous pages. On day four, the prospect searches the
word “buy” followed by the name of your product and clicks on a paid ad. The prospect sees
different packages of the product and has some questions, but decides to wait until the following
day. On day five, the prospect goes directly to your site and finds the contact number to speak
with a sales rep. The prospect decides to purchase the product after talking with the call centre
agent.
101.
Example: Cross-Channel Attribution
Tounderstand this entire customer journey, Adobe Analytics tracks all these marketing touch
points. After the sale takes place, it can go back and tie all the events to the final purchase,
essentially connecting together the online interactions with the final offline conversion. After that
information is known, it is important to understand how to attribute this information effectively. In
the situation above, last-click attribution counts only the last step as the determinant of the final
sale. Adobe Analytics supports numerous attribution models beyond first and last touch.
Whether the aim is to attract new customers, retain customers, maximise mobile conversions,
increase social engagement, boost average order value, or all of the above, marketers today
can no longer rely on guesstimates. The complexity of channels and the huge volume of data
created and captured are the primary culprits hindering data acquisition and reporting. Using the
multi-channel attribution and analysis capabilities of Adobe Analytics, marketers can gain
invaluable insights based on hard data that can assist in more intelligently allocating funds
toward online and offline channels and communicating the resulting strategies and results
across their organisations.
Here are some simple steps you can follow to improve your attribution analyses and achieve
better returns on your marketing investments.
• Start collecting data and have a realistic, phased strategy.
• Start measuring and exploring for insights without knowing the answer.
• Be prepared to make mistakes, but learn from them — keep iterating.
• Continue to evolve by adding new channels and models.
6.1.3 Report Builder
Adobe Report Builder is an add-in for Microsoft Excel. Report Builder lets you build customised
requests from reporting and analytics data, which you can insert into your Excel worksheets.
Requests can dynamically reference cells within your worksheet, and you can update and
customise how report builder presents the data.
Features of Report Builder:
Custom reports
Create and customise reports that are specific to your needs and edit them on the fly with the
power and flexibility of Excel formatting tools.
Scheduled reports
Have reports created and delivered automatically, in a variety of file formats, right from Excel.
102.
Multiple report suiteaccess
Get insights into individual sites, business units, and departments by creating reports that span
multiple report suites.
6.1.4 Ad Hoc Analysis
Ad hoc analysis helps you identify high-value customer segments with unlimited real-time visitor
information, allowing you to drill down into the data to get deep, precise, and comprehensive
views of your customers.
You can perform instantaneous, advanced analysis on web site activity. You can view multiple
reports simultaneously and apply segments across multiple dimensions. You can analyse the
data from both micro and macro perspectives to view their impact on your important business
metrics.
These features enable you to answer questions about site traffic, visitor demographics, revenue,
and product movement. You can then filter, sort, and segment your data to find the answers to
precise questions. The results are returned almost instantaneously, enabling you to analyse the
effects of a combination of factors quickly.
Features of Adobe Analytics ad hoc analysis:
Multidimensional site analysis
Make connections between your customers’ nonlinear site navigations with charts that use
colour, size, position, movement, and volume to present complex and trending relationships.
Use this date to improve site design, navigation, content layout, and conversion.
Unlimited real-time segmentation
Build concise visitor segments that can be compared to one another to identify new segments,
insights, and key performance indicators (KPIs).
Advanced reporting
Dynamically build and analyse online conversion processes on multiple pages with advanced
fall-out reports, and apply customisable default settings for enhanced conversion and traffic
reporting.
Multiple reports on one screen
Manage and conduct analysis of multiple reports on one screen, enabling side-by-side
comparison without toggling between separate report tabs.
Reports for mobile segments
103.
Use reports builtspecifically to observe mobile visitor behaviour, such as comparing mobile
conversion with web conversion and keyword search by mobile visitors versus web visitors.
6.1.5 Data Connectors
Adobe Data Connectors provide a complete development ecosystem to help Data Connectors
partners integrate their products and services into the Adobe Marketing Cloud. This combined
view of your marketing data will show you how your customers behave, and the best ways to
invest your marketing resources. Adobe makes the integration easy with prebuilt APIs that allow
you to drag and drop approved providers into the Analytics interface and immediately begin
analysing and optimising.
Features of Adobe Analytics Data Connectors:
Aggregated reports
View reports that aggregate data from both Adobe and your partner online marketing
applications in a single dashboard view.
A large partner ecosystem
Adobe Analytics integrates with more than 500 technology partners, including more than 40
accredited integrations with top marketing application providers.
Cross-channel insights
Measure conversion based on integrated data from Adobe and third-party applications. Cross-
channel insights help you identify the strong and weak elements of your overall marketing
strategy.
Targeting and remarketing
Use on-site browser-based data to create visitor segments for targeting and remarketing for
your email, ad serving, site search, and other marketing functions.
6.1.6 Data Warehouse
Data Warehouse refers to the copy of raw, unprocessed data for storage and custom reports,
which you can run by filtering the data. You can request reports to display advanced data
relationships from raw data based on your unique questions. Data Warehouse reports are
104.
emailed or sentvia FTP, and may take up to 72 hours to process. Processing time depends on
the complexity of the query and the amount of data requested.
Adobe enables Data Warehouse for administrator-level users only, for specific report suites. (It
can be enabled for global and children report suites, but not for rollup report suites.) The
administrator can create a group that has access to Data Warehouse, and then associate non-
administrator level users to that group.
Data Warehouse Requests Descriptions
This table describes the fields and options on the Data Warehouse Request tab.
Element Description
Request
Name
Identifies the request.
Reporting
Date
The date and granularity of the request.
Custom: A date range you configure in the calendar.
Preset: A preset range. The preset range is relative to the report date.
Granularity: The time granularity. Valid values are None, Hour, Day, Week,
Month, Quarter, and Year.
Available
Segments
Lets you select the part of the visitor population you want to examine and
generate complex segments. You can load pre-configured segments,
create new segments, and store segment components in a library to use in
building additional segments.
See Segmentation for more information.
Breakdowns6.1.6.1.1.1.1 Lets you categorise data using breakdowns. Segments and breakdowns
differ in that a segment filters data out of a data set, while a breakdown
compartmentalises data across all valid values for the breakdown.
For example, use segments to remove a gender from the data set, and use
a breakdown to see data separated by gender.
Metrics6.1.6.1.1.1.2 Lets you add metrics on which you want to report.
Schedule
Delivery
6.1.6.1.1.1.3 Lets you schedule requests for automatic delivery at selected intervals, or
as a one-time report. If you use the default format, the report arrives in an
email as a .csv file.
To add the date range, include %R in the filename. This value represents
the date values requested in the report. For example, if you request data
from May 1, 2013 through May 7, 2013, the %R shows a filename including
the date range of 20130501 – 20130507.
105.
Data Warehouse providesa flexible interface to run custom reports. Following these guidelines
can help reduce the time it takes to retrieve data.
Guideline Description
Run Page Views,
Visits, Visitors,
and other standard
reports in Version
15
Before creating a Data Warehouse report, see if the information you
are looking for is already available in Reports. If so, the report will
be delivered much faster due to the pre-processing performed by
Reports and Analytics for common metrics.
Understand the
amount of data
you are requesting
A multi-year report on a large report suite can contain tens of
billions of data rows. Processing and evaluating this data can take
days, or even weeks.
Evaluate how the report is being used to determine if some of the
multi-year data is available, or if you can break the report into
multiple requests.
Match the report
period to the
granularity
Reporting granularity requires additional processing time. If you are
reporting monthly granularity for an entire year, your reports process
much faster if you submit a report request for each month.
Report on
completed data
ranges
Data Warehouse reports are generated when the date range
requested is complete. For example, if you request a report for the
current week on Wednesday, the report isn’t generated until Sunday
of the following week.
Generate pathing
reports in Data
Warehouse
Pathing metrics (entries, exits, bounces, etc.) are not available in
Data Warehouse.
6.1.7 Compare Adobe Analytics Versions
Capabilities Adobe Analytics Adobe Analytics Standard
Premium
Marketing Reports & Analytics • •
Ad Hoc Analysis • •
Data Workbench •
Advanced Segmentation
Unlimited real-time segmentation • •
106.
Behaviour visualisations ••
Online and offline personalised customer
analysis
•
Audience clustering •
Marketing Attribution
Online campaign and channel attribution • •
360-degree customer view •
Retroactive event processing •
Out-of-the-box attribution models •
Mobile App Analytics
Data collection for mobile channels • •
Mobile app dashboards and reports • •
Geolocation analysis • •
Mobile engagement analysis • •
Mobile campaign analysis • •
Pathing analysis • •
Predictive Marketing
Anomaly detection • •
Correlation analysis •
Audience clustering •
Customer propensity modeling •
Decision trees •
Predictive Model Markup language (PMML) •
Real-Time Web Analytics
Real-time reports • •
Real-time APIs • •
Live stream (data firehose) •
Advanced Visualisations
Interactive visualisations • •
Dashboards and reports • •
Side-by-side reports • •
Visual querying •
Big Data
Comprehensive data ingestion •
Data pattern discovery •
On-demand data curation • •
Automated syndication • •
Social Analytics
Comprehensive social insight • •
Facebook and Twitter analytics • •
Enriched audience optimisation
Classifications • •
107.
Integration of offlineevent level data •
Advanced audience discovery and measurement •
Audience activation and delivery • •
Customer Churn Analysis
Improved retention • •
6.1.7.1.1.1.1 Prioritised marketing • •
Propensity modeling •
Increased customer value • •
Report Builder
Custom reports • •
Scheduled reports • •
Multiple report suite access • •
Dynamic Tag Management
Tag management • •
Contextual experience management • •
Permission-based workflows • •
Rules-driven tag execution • •
Data distribution management • •
Data Connectors
Integrate data from third-party marketing
applications
• •
6.2 Adobe Analytics Integrations
It’s essential to have a unified platform that easily integrates with applications while leveraging
open standards and enabling agile development to create a diverse array of immersive
experiences for customers.
Companies are frequently using various tools to measure and optimise different areas of their
digital marketing (social media, email, targeting, and so on). Integration between technologies is
critical because companies can benefit from integrated data and workflows that streamline
processes, provide better insights, and enable greater agility.
6.2.1 Common Third-party Integrations
If you’re considering integrating third-party applications with reporting, Adobe’s Data Connectors
platform represents a streamlined way of importing and exporting data out of Analytics. The
various pre-built integrations (email, survey, ad serving, and social media) simplify the process
of importing data from other marketing applications and also give you control over what report
data is shared with third-party vendors. Data Connectors leverage all of the aforementioned
108.
input and outputmechanisms to automate the process of capturing and sharing data with other
systems.
Adding integrations with Data Connectors
Listed below are the most common non-Adobe applications and integrations for Adobe
Analytics.
Gigya: the Gigya and Adobe Analytics integration combines the power of Gigya’s integrated
social interactions with the behavioural tracking, targeting and reporting of Adobe Marketing
Cloud to create powerful analytics and optimisation opportunities for your organisation.
Simply activate the custom conversion variables that you will use for capturing Gigya event data
within Adobe SiteCatalyst, and deploy your integration code. Benefits include driving user
engagement and conversions across your site or app by tying consumers’ social and on-site
actions, collected via Gigya’s Social Login and Plugins, to Adobe® Analytics’ behavioural data.
Understand the value and impact of social actions and engagement in the context of your
current analytics and KPIs to optimise social marketing ROI.
Key benefits of the Adobe Analytics Gigya integration include:
• Simple integration configuration and deployment;.
• Reporting of Gigya related dimensions and metrics within the Adobe Marketing Cloud;
• The power to build Adobe Marketing Cloud analytics segments built with Gigya
dimensions.
For data
109.
Kampyle: Kampyle’s integrationfor Adobe® Analytics combines the power of Kampyle’s
integrated feedback system and the behavioural reporting of the Adobe Marketing Cloud®. It
empowers analytics and uncovers optimisation opportunities for organisations that need to
understand how their visitors interact with their online presence. Integrating Kampyle brings
visitor feedback metrics and dimensions into the Marketing Cloud, so that visitor behaviour can
be analysed in the context of attitudes and opinions. The combined solution creates the
opportunity to leverage attitudinal insight to optimise web site effectiveness and improve
conversion rates.
Once enabled, you can access all of the Kampyle feedback data within Adobe® Analytics report
suites. A set of pre-defined dashboards is provided to get you started. The added insight allows
you to explore new attitudinal dimensions within existing traffic-orientated segments, including
customer satisfaction, NPS and key visitor issues. Or apply behavioural segmentation based on
feedback classifications to identify and create new attitudinal segments within funnels or
reporting paths. The result is a sharply focused picture of visitor motivations for specific site
behaviour.
Kampyle’s integration for Adobe® Analytics lets you continue to analyse data the way you do
today, without building new processes or reports — except your web analytics is enriched by
user insight. Overlaying behavioural data with feedback lets you optimise efficiently and
effectively based on solid visitor insight instead of guesswork, empowering you to meet your
business goals today.
For advertising – display
Tracking First: Automates the routine of tracking code creation, classification, insertion of that
code within a landing page link, and finally link validation. Beyond that, it provides a variety of
governance tools, ensuring that your company’s tracking standards are being used across the
organisation.
Most clients struggle to implement a standardised process like this on their own. Our research
shows that upwards of 70 per cent of codes created by organisations fail to align fully with their
own standards. Channel managers and agencies frequently invent their own pet processes,
which don’t necessarily conform to the requirements laid out by the analytics team.
Who, knowing of that peril, would ever again accept campaign reports at face value?
Tracking First will restore your company’s faith in its reports, because it forces every new code
to conform to a process that you have defined. It shores up all of the technical gaps that
typically creep into this process, and ensures that all of your Classification and Marketing
Channel reports which key off of the tracking code are 100 per cent trustworthy. Everyone will
be standing at attention and ready to report before a single campaign responder hits your site.
110.
In short, yourcampaign reports will finally mean what you think they mean. Not to mention that
your job in creating and maintaining that tight ship will become so easy that you’ll have to find
something more rewarding to do with your time.
For email
Lyris: Integrate Lyris with Adobe Analytics and increase revenue through remarketing. Measure
revenue generated through your email campaigning effort.
For mobile
Fiksu: Provides industry-leading technology for all of your mobile marketing needs. By
combining actionable data, programmatic reach, and ad performance optimisation, Fiksu
delivers all of the capabilities a marketer needs to succeed on mobile, including mobile ad
tracking and attribution, audience segmentation, media buying, retargeting, optimisation, and
analytics.
The Fiksu integration with Adobe Analytics offers you the opportunity to pull Fiksu mobile
campaign performance data automatically into Adobe Analytics. By viewing the complete picture
of your marketing efforts in one dashboard, you can tie Adobe Analytics insights to Fiksu-driven
users to optimise performance further and maximise returns from your mobile marketing spend.
For commerce
Hybris: The Hybris integration with Adobe Analytics enables marketers and analysts to tell the
story of what’s happening in their business with data by leveraging high-performance, real-time
analytics across online and offline marketing channels. Marketers utilise the information that
flows through Adobe Analytics to improve the performance of their marketing activities. Adobe
Analytics from SAP is the central source for relevant marketing data supporting digital marketing
experiences. Following successful integration, the following reporting will become available in
Adobe Analytics:
• KPIs;
• Site Traffic — Pages and Page pathing;
• Site Traffic — Categories and Category pathing;
• Site Traffic — Page Types and pathing;
• Product reports;
• Site Conversion Funnel;
• Products Conversion Funnel;
• Payment Type;
• Merchandising/Finding method;
• Fulfillment method;
• Internal Searches;
• External Campaigns;
• Traffic Sources Reporting;
111.
• Visitor ProfileReporting;
• Visitor Retention Reporting;
For Data Warehouse integration
Tableau: Mash up your Adobe Analytics data with any number of other data sources using
Tableau Software. Adobe Analytics Data Warehouse now supports the ability to export directly
to a Tableau Data Extract file (.tde), meaning digital marketers can bring their critical Adobe
Marketing Cloud data into the Tableau Environment like never before.
Use cutting-edge visual analytics to explore data sets of any size quickly and even bring
additional data from sources like Salesforce, Splunk, Excel files, and countless other data
environments. Compare data visually, build interactive dashboards, and share with your team or
your entire organisation securely over the web — all without writing a single script or SQL query.
Tableau’s easy and intuitive drag-and-drop interface means that digital marketers can focus
more time on making decisions with data and less time grappling with complex calculations and
queries.
For more information on Adobe Analytics applications and integrations visit Adobe Analytics
Exchange.
6.2.2 Marketing Cloud Integrations
The Adobe Marketing Cloud includes powerful web analytics and web site optimisation products
that deliver actionable, real-time data and insights to drive successful online initiatives. It offers
an integrated and open platform for online business optimisation. The Cloud consists of
integrated applications to collect and unleash the power of customer insight to optimise
customer acquisition, conversion and retention efforts as well as the creation and distribution of
content.
Adobe Analytics + Adobe Social
• Compare social performance against conversion metrics.
• Automate measurement of social applications.
• Automate social campaign measurement.
Adobe Analytics + Adobe Experience Manager
• Easily and automatically deploy analytics across all managed digital properties.
• Have analytics best practices and frameworks built into content deployment and
measurement.
• Provide in-context analytics overlays for content authors.
Adobe Analytics + Adobe Target
112.
• Leverage analyticsdata collection to enrich the visitor profile for automated behavioural
targeting.
• Extend analysis of testing and targeting campaigns with deeper segmentation and
behavioural breakdowns.
• Optimise and target search results based on behavioural data and business rules.
Adobe Analytics + Adobe Media Optimizer
• Combine data from ad platforms with site engagement and conversion metrics to gain a
complete view of ad performance.
• More accurately model and forecast your ad performance.
• More effectively allocate your marketing spend across the channels and then optimise
budgeting and bidding within each of those channels.
6.2.2.1 Enrich Audience Optimisation
By combining the power of Adobe Analytics, Adobe Audience Manager and Adobe Target, you
can enrich user optimisation by delivering your customers a more personalised and relevant
experience.
With Adobe Analytics, analyse online and offline customer data to discover and measure new
audiences.
Audience measurement and delivery:
• Correlation Analysis
• Audience Clustering
• Propensity Scoring
With Adobe Audience Manager, refine audience data from AAP and directly integrated data
sources to perform real-time segmenting.
Audience activation:
• Segmenting syndication
• Real-time syncing
• Privacy-compliant ad targeting
With Adobe Target, take action on your audiences with personalised targeting and delivery.
Audience delivery:
• Offer and content testing
• Cross channel targeted content
6.3 Validation, Optimisation and Security
The testing and validation process is used to ensure data reporting accuracy. It should always
be done on the development report suite.
113.
The process includessteps both from a technical and administrative level.
6.3.1 Data Accuracy Validation
Data accuracy validation is a process of comparing report data with known and verifiable data
points.
The validation process should be completed by Adobe personnel, preferably by the Adobe
Consultant (the person most familiar with the technical implementation details).
The preferred data points for this validation, in order of preference, are listed as follows:
(Econversion sites) Comparison of econversion orders for a single day;
Comparison of known success events, especially logged data where IP address and other
browser information generally stored in web server logs can be compared to the data
collected;
Comparison of page views.
All three types of validation require a debug log or data feed for the time period in question. This
is generally one day or less.
It is expected that orders or success events can be measured to within 2–3 per cent of actual
values (sometimes reaching higher accuracy levels) using standard JavaScript-based
implementations. This assumes an SSL page, since SSL pages are cached much less
frequently, and by definition they should not be cached. An implementation with fully server-side
image requests on an SSL page should come within about 0–1 per cent of actual values. Non-
secure pages may experience higher differences, but still within five per cent of actual values.
When comparing page views for a single time period, it is expected that the page views can be
accounted for within five per cent of actual values, not including monitoring (such as Keynote or
WhatsUpGold) or automated traffic (spiders, bots, and scripts).
Data accuracy comparisons need to take into account the following items:
• Quality assurance or other types of internal testing that may be filtered by IP
addresses or VISTA rules;
• Smart tags that only generate tags for certain types of orders or traffic;
• Queries for comparison must take into account what is being measured by the web
site (not including returns, orders placed by customer service personnel, or other
special conditions);
• Ensure that the time zone differences between the query and the report suite match;
• Custom Keynote or similar traffic (Keynote Transaction, etc.) that measures the
ordering process and may be reflected in tags, but removed from ordering systems;
• Account for the client’s de-duping processes;
• Reloads of the order page (Orders are de-duplicated based on purchaseID).
114.
To go throughthe list and each of the step components go to Testing and Validation Process.
6.3.2 Optimisation
Analytics deployment is organised into three major steps.
1. Pasting a snippet of HTML code onto each page (or page template) of a web site. The
HTML code snippet is very small (400 to 1000 bytes) and contains JavaScript variables
and other identifiers that facilitate the data collection process.
2. The code snippet calls a JavaScript library file, which contains JavaScript functions
specific to Analytics used during metrics collection. If the Analytics code is implemented
correctly, the time required for the browser to execute the JavaScript library file is usually
negligible.
3. The library file makes an image request to an Adobe data collection server. The server
collects the data being submitted and returns a 1x1 transparent image to the visitor’s
browser. This third step adds an insignificant increment to the total page download time.
You can take additional steps to minimise Analytics overhead:
Page Naming
The pageName variable is used to identify each page that is tracked on the web site.
If the pageName variable is not populated with a defined value (such as Home), Analytics uses
the URL of the page. Because the page name is central to your reports, make sure that all
parties in your organisation agree on a strategy before you implement.
Depending on the content management system your site uses, it is helpful to add content
elements to your system that can be used to populate Analytics variables. Many companies find
that most Analytics variables can be populated from existing content management elements.
Variable Length
The length of Analytics variables can impact the size of the HTML code snippet, JavaScript
library file, and image request. If a customer has many variables that are long (60 characters or
more) the values can be replaced with shorter identifiers. Data classifications or VISTA rules
can be used to translate the identifiers to friendly names.
HTML Code Snippet
Many users have variables declared, but no value is assigned to the variable. Removing unused
variables helps to reduce the page size.
Javascript Library File
115.
The JavaScript libraryfile is intended to be cached in the user’s browser after the initial load,
which limits the amount of data that needs to be downloaded. Page-specific variables should be
placed in the HTML snippet. All other variables should be put in the JavaScript library file.
Caching Directives
Adobe customers should ensure that their web servers are set up to take advantage of this
functionality. For example, make sure that the NO-CACHE setting is set to false. Additionally,
ensure that the expiration date is sufficiently long. Make sure any proxy caches are set up with
the correct configuration. The customer’s web server documentation provides more information.
Tables
Many web browsers do not start displaying the contents of a table until the browser has
compiled the entire table. If the entire contents of the page are inside one big table, the browser
must compile the entire contents of the page before anything is displayed. Placing the call to the
JavaScript library file outside table tags ensures that the call to the Analytics servers does not
impact the displaying of the page content.
File Compression
Customers can compress the JavaScript library file by using standards-based encoding (such
as gzip). Typical compression algorithms can reduce the size of the JavaScript file by 40–60 per
cent or more.
Secure Pages
Secure pages (pages loaded under https://) encrypt the image request and add to the total
download time. Secure pages can add as much as 50–75 per cent overhead to the image
request. Customers should ensure that https is used only where necessary.
Content Delivery Services/Networks
Content Delivery Services or Content Distribution Networks (CDNs) such as Akamai and
Speedera push web content closer to the edge of the network, keeping frequently-requested
documents close to the location where they are accessed. Typically, this reduces access
latency, bandwidth usage, and infrastructure cost.
Your AppMeasurement for JavaScript library file can be delivered via a CDN to enhance
performance and delivery of the file to the site visitor. Adobe customers need to ensure they
have configured their CDN services correctly. CDNs are a common reason for fluctuations in
download times and should be considered the most probable cause for any changes in
download times. Tag manager stores all JavaScript on a CDN.
JavaScript File Location and Concurrency
116.
Placing the callto the JavaScript library file at the top of the page ensures that the image is
among the first elements to be downloaded. Most web browsers download images concurrently.
Typically three to four images can be downloaded simultaneously.
Because most web browsers download elements concurrently, the status bar of many common
browsers does not accurately reflect which element the browser is trying to load. For example,
your status bar may report that your browser is waiting for image 1 to download. The network
packet tests show your browser has already received image 1 and is currently waiting for image
2.
Peering
Private Network Peering enables data to pass from an ISP’s network to the Analytics network
more efficiently.
Peering is simply the agreement to interconnect and exchange routing information without the
need of the public network. Please contact Adobe Engineering if an ISP is interested in
establishing a peering relationship.
Although peering may provide some benefits to Adobe ISP customers, optimising the HTML
snippet and the web server’s caching directives are likely have a much greater impact. High-
volume ISP customers realise the most benefit from peering.
6.3.3 Security
Security Manager in Adobe Analytics enables you to control access to reporting data. Options
include strong passwords, password expiration, IP login restrictions, and email domain
restrictions.
Element Description
Require Strong
Passwords
Forces users to create more secure passwords that adhere to the following
rules:
• Must be at least eight characters in length.
• Has at least one symbol/number character between the first and last
characters.
• Has at least one alpha character.
• Cannot be found in a dictionary or contain words from a dictionary
(English).
• May not include any three consecutive characters from the login
username.
• Must be different than the previous ten passwords.
Note: This feature is enforced on new passwords going forward. It does not
check existing passwords, or force users to change existing passwords. For
117.
6.4 Adobe Debugger
TheAdobe Debugger (previously DigitalPulse Debugger) is a free tool provided by Adobe that
lets you view the data being collected from your site on any given page.
When executed in your browser, it shows the image requests that transmitted data from that
page into Marketing Cloud solutions, along with any variable values or parameters that were
captured. This allows you and your developers to check the validity of your implementation on
any page on your site.
The Adobe Debugger is officially supported for use in all recent versions and builds of Mozilla
Firefox, Google Chrome, Microsoft Internet Explorer, and Apple Safari. It is installed as a
this reason, consider enabling password expiration to force users to change
their passwords and adhere to the strong password rules.
Password
Expiration
Forces users to regularly change their user account password. You can specify
the interval at which you want passwords to expire, and force passwords to
expire immediately.
Enforce IP Login
Restrictions
Limits report access to specific IP addresses or IP address ranges.
You can add up to 100 entries in the IP Address Filter list, and each entry can
be a specific address or a range of addresses.
Enforce IP Login Restrictions is not enforced until there is at least one entry in
the IP Address Filter list.
Enforce Email
Domain
Restrictions
Filters the email addresses and domains where Analytics sends bookmarks,
downloadable reports, and alerts.
The email filter list supports up to 100 entries, and each entry can be an email
address or an entire email domain.
If a scheduled report has an unapproved email destination, Analytics sends an
email notification of the problem, and a link to unschedule the report.
Enforce Email Domain Restrictions is not enforced until there is at least one
entry in the Accepted Email Domain Filter list.
Password
Recovery
Notification
Notifies the specified administrators when a user attempts to reset a user
account password.
118.
bookmark in yourbrowser. Copy the provided JavaScript code to your clipboard and then create
a bookmark in a supported browser.
For instructions on how to install Adobe Debugger go to install.
6.5 Democratisation
Democratisation refers to the process by which access to technology rapidly continues to
become more accessible to more people. At an internal scale, the use of Adobe Analytics needs
to be slowly democratised across your organisation. This can be done by sharing knowledge
and training staff, and the result will be the better utilisation of the solution as internal
engagement increases.
6.6 User Access
In order to manage the security around your data, ensure that you have clearly defined Working
Groups which can include both internal
employees and third parties who need
access to the data to manage your
campaigns. Create buckets of users and
then create an accessibility map similar to
the below to understand the extent of their
visibility and accessibility of company
reporting.
Use the user usage reports in Adobe
Analytics to understand which of your
users most frequently login and those
who don’t
119.
6.7 Automation
Automation canoffset resource bandwidth issues. Whenever a company can substitute
technology for people through automation, it means it can either reduce costs or reallocate
resources to more strategic areas. Digital analytics can provide automated alerts to notify
analysts of key problems requiring investigation, and refreshable Excel-based dashboards to
simplify reporting and free up analysts’ time to focus on more strategic analyses.
120.
6.8 Leveraging YourInvestment (The Big Picture)
The Adobe Marketing Cloud includes powerful web analytics and website optimisation
products that deliver actionable, real-time data and insights to drive successful online
initiatives. It offers an integrated and open platform for online business optimisation. The
Cloud consists of integrated applications to collect and unleash the power of customer
insight to optimise customer acquisition, conversion and retention efforts as well as the
creation and distribution of content.
Once you are up running with Adobe Analytics and want to grow your digital capabilities to the
next level, you might want to go back to what your business needs are. We see a common trend
of Analytics users purchasing Adobe Experience Manager (AEM) as a next step in order to
improve their web and mobile sites’ experiences. Clients who feel they have a gap in
acquisition, or want to improve their customer reach, opt to follow their AEM or Analytics
purchase with Adobe Social, Campaign or Media Optimizer depending on their specific needs.
Manage Digital Experiences
Personalise Content
Build and Deliver Video
Build Audience Profiles
Manage Social
Manage Campaigns
Management Digital Ad
Collect and Analyse Data
121.
If your objectiveis to increase personalisation and engagement, we suggest you purchase
Adobe Target together with Adobe Audience Manager. This will help you test and personalise
content across channels as well as extending audiences across solutions. In the specific case
that you manage high volumes of video content and want to improve your video delivery across
channels and devices, Adobe Primetime will do the work.
Continue growing your digital marketing strength and add a new Adobe Marketing
Cloud solution based on what your business demands. A good integration across
solutions will help you make, manage, measure and monetise your content across every
channel and screen.
7 Checklists
The following lists highlight some specific high-level points; they are not meant to be exhaustive
but aim to give some pointers and provide a basis for your own checklists. You and your Adobe
Customer Success Manager can use the first checklist to qualify which of our recommendations
from this document have been put in place.
Responsible
Item Client Adobe Comments
1 7.1.1.1.1.1.1 Executive sponsor assigned
2 Stakeholder buy-in across the business
3 Testing communication plan created
4
A program name is assigned, a budget defined,
project success criteria documented and this
together with the executive sponsor has been
communicated across the business
5 7.1.1.1.1.1.2 Steering Committee set up
6 Working Group set up
7 KPI metrics set against current business goals
8
7.1.1.1.1.1.3 KPI metrics agreed and set across
the business units
9
7.1.1.1.1.1.4 Digital strategy aligned and
communicated
122.
An analytics measurementstrategy is defined
and communicated
10 A data strategy is documented
11
Roadmap includes progressively advanced
analysis to mature the business
12
7.1.1.1.1.1.5 Roles and responsibilities defined
and communicated
13 A testing organisational structure is defined
14 Roles and responsibilities are documented
15
7.1.1.1.1.1.6 Training and enablement plan
created
16
A proactive effort is underway to develop a
culture of analytics and testing
17 7.1.1.1.1.1.7 Implementation process defined
18 Analysis request workflow defined
19
7.1.1.1.1.1.8 External data integrations setup
20
7.1.1.1.1.1.9 Reports and dashboard by R&R
setup and scheduled
21
7.1.1.1.1.1.10 Audiences segments defined
and embedded in reporting
22 7.1.1.1.1.1.11 Targets and alerts set
23 User groups and permissions are setup
24 Server calls and user usage reports scheduled
25
An ideation to deployment workflow is
documented
26
An agile approach to campaign execution is
applied
27
7.1.1.1.1.1.12 A community data dictionary is
shared
28
7.1.1.1.1.1.13 Templates documented and
used across the business
29 7.1.1.1.1.1.14 Adobe Target maturity
123.
assessment completed
8 AdobeAnalytics Product Maturity Activities
Basis Analysis and Reporting Opportunities
Intermediate Analysis and Reporting Opportunities
125.
Advanced Analysis andReporting Opportunities
Digital intelligence segmentation strategies rely heavily on demographic, historical, behavioural,
and environmental data and can be derived via rule-based or data-mining techniques. With a
segmentation strategy in place, the rule sets that identify key audiences and behaviours can be
efficiently applied to metrics, reports, and analysis projects to focus users on actionable
outcomes. In addition, enterprise segmentation strategies are extensible to acquisition and
retention marketing.
126.
9 Adobe ConsultingOperational Maturity Review
Operational Readiness Assessment and Recommendations — $6k (per brand/business
unit)
Adobe Consulting provides a package to review your operational business readiness and
provide a recommended roadmap of initiatives to accelerate your maturity. This service is highly
recommended if you are new to the solution and need assistance in evaluating your capabilities.
Activities include:
Conference call/meeting to interview executive sponsor;
Consulting guidance on completing the solution maturity assessment;
Consulting walkthrough of maturity operational readiness checklist;
Qualification of current documents, templates, processes;
Draft of initial findings, highlight focus themes reviewed with executive sponsor;
Executive sponsor sign-off;
High-level roadmap of recommendations presented to stakeholder group.
10 Adobe Analytics Glossary of Terms
Acquisition
The attraction, enticement, gain, or addition of new visitors to your web site. You can create a
calculated metric to determine the cost required to acquire each new visitor.
Activity
Marketing activity as part of a campaign. In Adobe Target, activity is your means of controlling
what content to show to whom, and when to show it.
Allocation
Conversion variables (eVars) allow Adobe Analytics to attribute success events to specific
variable values. Sometimes, variables encounter more than one value before hitting a success
event. For these cases, allocation determines which variable value gets credit for the event.
Anomaly
An anomaly is detected using statistical modeling to find unexpected trends in your data
automatically. The model analyses metrics and determines a lower bound, upper bound, and
expected range of values. When an unexpected spike or drop occurs, the system alerts you to
the anomaly in the report.
Calculated Metric
Calculated metrics enable you to combine metrics to create mathematical operations that are
used as new metrics. These metrics can be created for a report to which you add metrics.
Administrators can create calculated metrics for all users of a report suite.
127.
Campaign
Campaigns are definedand used in various ways in Marketing Cloud products.
Channel
Generally, a channel is a section (or category) of your site. For example, a web site might have
two channels, one for Weather and one for News.
Classification
Classifications are created by grouping (classifying) granular data from a source report. For
example, you might want to analyse display ads, but they are mixed with email, partner, text ad,
and social media campaigns. You can create groups so that you can analyse them separately.
Clickstream Data Feeds
Raw clickstream data that is collected from web sites, mobile apps, or is uploaded using web
service APIs or data sources, is processed and stored in Adobe’s Data Warehouse. This raw
clickstream data forms the data set that is used by Adobe Analytics.
Conversion Variable (eVar)
The Custom Insight Conversion Variable (eVar) is placed in the Adobe code on selected web
pages of your site. Its primary purpose is to segment conversion success metrics in custom
marketing reports. eVar variables can be visit-based and can function similarly to cookies on the
site. Values passed into eVar variables follow the user for a predetermined period of time,
based on configurations made on the Settings tab.
Count Repeat Instances
Specifies in ad hoc analysis whether instances are counted in reports. This means that if you
have multiple sequential values for the same variable, you can count them either as one or
multiple instances of the variable.
Correlation
The relationship between two traffic reports in a report suite. You can run correlation reports by
breaking down report data. For example, you can run a correlation breakdown report that shows
visitor age group correlated with the type of search engine the visitors use.
CPM
Cost per Thousand. Pertains to instances in which the code on the client’s web page generates
a server call to Adobe — for example, an image request.
CPMM
Cost per Million. Pertains to instances in which the code on the client’s web page generates a
server call to Adobe — for example, an image request.
Creative Element
Creative elements are characteristics that vary between placements or instances of the
campaign, and include characteristics such as media type, headline, keyword, and media
vendor.
128.
Custom Traffic Variable(s.prop)
Custom traffic variables, also called props (s.prop) or property variables, are counters that count
the number of times each value is sent into Analytics.
Current Data
The Include Current Data option on reports lets you view the latest Analytics data, often before
data is fully processed and finalised. Current Data displays most metrics within minutes,
providing actionable data for quick decision making. Current Data is enabled by default on all
reports that support it.
Data Connectors
Adobe Data Connectors provide a complete development ecosystem to help Data Connectors
partners integrate their products and services into the Adobe Marketing Cloud.
Data Sources
You can use Analytics to create and manage FTP-based Data Sources, which leverage FTP file
transfer to import offline or historical data into the Marketing Cloud. After creating a Data
Sources instance, the tool provides an FTP location that you can use to upload Data Sources
files. Once uploaded, Data Sources automatically locates and processes them. After the files
are processed, the data is available for Analytics reporting.
Decision Tree
In data workbench, decision trees are a predictive analytics visualisation used to evaluate visitor
characteristics and relationships. The Decision Tree Builder generates a decision tree
visualisation based on a specified positive case and a set of inputs.
Deduplication
The removing of duplicate events and visits from reporting.
Dimensions
Descriptions or characteristics of metric data that can be viewed, broken down, and compared
in a report. They are non-numeric values and dates that correlate, sub-relate, or are a
classification of the original report type metric.
Event Serialisation
The process of implementing measures to prevent duplicate events from entering Analytics
reporting. Duplicate events can occur when a user refreshes a page multiple times, navigates to
a certain page multiple times, or saves the web page to their machine (some users may save
the purchase confirmation page to their computer). Every time they viewed the page, orders and
revenue would be counted again if event serialisation were not in place.
Exit Link
Any link that takes a visitor away from your site.
Expiration Trigger
Sets the lifetime of a variable value by letting you tell the system when to expire the variable’s
value. Expiration triggers can be dates, time periods, or conversion events. It’s the event or
129.
action that occursthat expires the value of a variable. A campaign variable could be set to
expire on purchase. An internal search term can be set to expire with a visit.
Fallout Report
The Fallout Report shows where visitors leave (fallout) and continue through (fallthrough) a pre-
specified sequence of pages. It displays conversion and fallout rates between each step. For
example, you can track a visitor's fallout points during a buying process. You select a beginning
point and a conclusion point, and add intermediate points to create a web site navigation path.
Gantt View
The Gantt view provides a quick view of when your site campaigns began and when they
ended, and how they affected your site’s success metrics. You can see the day each campaign
began as well as the day the campaign ended.
Gauge Reportlet
Gauge reportlets show the performance of a specific metric according to a custom-defined
scale. You have the option to select a dial, bar, or bulb visualisation type, set the scale
(thresholds) you wish to use, and define other report details.
Granularity
The level of period-based detail at which you are viewing your report data. Granularity can be
daily, weekly, monthly, and so on.
Hierarchy
The hierarchy variable is used to determine the location of a page in your site’s hierarchy or
page structure. Hierarchies reflect the natural organisation of the site. The hierarchy variable is
most useful for sites that have many levels in the site structure. For example, a media site may
have four levels to the Sports section: Sports, Local Sports, Baseball, Red Sox. If someone
visits the Baseball page, then Sports, Local Sports and Baseball reflect that visit.
Hit
A single image request to Adobe servers, generated when a user requests a resource on a web
site. A request can result in an error or a successful transmission of any data type. Each Track
and Track Link calk generates a hit.
Image Request
An image request is used to send data to Adobe data collection servers. It is also known as a
web beacon and is a transparent graphic image no larger than 1x1 pixel. It is placed on a web
site or in an email to track visitor behaviour. Data collection parameters are attached to the
source of the image and read by the data collection server.
Internal Search Term
Search terms typed when visitors are on your web site.
Key Performance Indicator (KPI)
Key performance indicators simplify web analysis data reporting so that only relevant
information is presented in an easily understood and actionable format.
130.
Lifetime Value
The totalamount of a given success metric for a single user, for example, the total number of
lifetime visits for a user.
List Prop
A list prop is a traffic variable that can accept multiple values at once. A delimited list of values
is passed into the variable, then reported as individual line items. List props are most commonly
implemented on pages that contain user-selectable values, such as listed items with check
boxes or radio buttons. They are useful in any circumstance where you want to define multiple
values in a variable without sending multiple image requests.
Login Company
A login company is a collection of report suites used by your organisation. Some organisations
have multiple login companies that apply to different parts of the organisation. This is especially
useful for large organisations that deal with different business units where many report suites
are not applicable to others in the company.
Marketing Cloud
The Marketing Cloud is an integrated family of digital marketing solutions, as well as an intuitive
interface for new resources and capabilities, called core services, for your business. Solutions
include: Reports & Analytics, Ad Hoc Analysis, Data Workbench, Data Warehouse, Visitor Click
Map, and Adobe Report Builder.
Master Marketing Profile
The Master Marketing Profile provides the ability for Adobe Marketing Cloud solutions to
communicate and share information about web site visitors so the same data can be used by
each solution. The Master Marketing Profile eliminates the need for customers to use their
visitors and their visitor web sessions as the integration point between the solutions by moving
the integration point to the Adobe Marketing Cloud.
Metric
Metrics are quantitative information about visitor activity, such as Views, Click-Throughs,
Reloads, Average Time spent, Units, Orders, and Revenue. They are the foundation of reports
and help you view and understand data relationships. They let you perform side-by-side
comparisons of different data sets about your web site.
Multi-Suite Tagging
The ability to send data to multiple report suites using a single image request.
Normalisation
Normalisation shows the percentage of change between comparison reports — useful when
date ranges have a different number of days, or different volumes of traffic. Normalisation takes
all metrics and forces them to equal proportions, raising or lowering individual line items
according to their normalised total. Normalising lets you match trends when one date is much
higher or lower than the other.
Original Referring Domain
Customers can visit your site multiple times and have a different referrer for each visit. The
131.
original referring domainis the referring domain customers used the first time they arrived at
your site.
Pathing
Pathing is defined as the path that users take through your site. For example, a visitor went to
page A, then page B, then page C.
Persistence
Persistence refers to the ability of conversion variables to retain their value from one page to the
next. You can choose how long a conversion variable retains its value, whether for a specified
duration of time, or until a specific success event takes place. Traffic variables are not
persistent.
Ranked Report
Displays a table with ranked items, using numbers and percentages in metrics. For example, a
Pages Report ranks the pages on your site based on traffic, and the detail table shows
percentages and numbers for metrics like Page Views and Revenue. A horizontal bar chart is
the default graph type. Graphs display a colour for each metric. Ranked reports can display
multiple metrics in a report.
Real Time
Real-time reports display web page traffic and rank page views in real time, so that you can
more quickly understand what is trending on your site.
Report
Standard reports display data for web site and visitor activity, traffic patterns, referral data,
advertising campaigns, visitor retention, product data, and more. You can run reports and then
access tools to configure segments, metrics, and report comparisons.
Report Suite
A report suite defines the complete, independent reporting on a chosen web site, set of web
sites, or subset of web pages. Usually, a report suite is one web site, but it can be a global
segment where you have combined several sites’ numbers to get totals. When you log in to the
marketing reports, ad hoc analysis, and Report Builder, you select one report suite to use
(except when you use roll-ups that combine report suites).
Segment Container
The Segment Builder utilises a container architecture that lets you determine what to include in
a segment. The Visitor container is the outermost container and includes overarching data
specific to the visitor across visits and page views. A nested Visit container lets you set rules to
break down the visitor’s data based on visits, and a nested Hit container lets you break down
visitor information based on individual page views. Each container lets you report across a
visitor’s history, interactions broken down by visits, or break down individual hits.
Segmentation
Segments are custom subsets of data, or data filtered by rules that you create. Segments are
based on hits, visits, and visitors. For example, you can run a Pages Report and then apply
a Visitors from Mobile Devices segment.
132.
Server Call
A servercall, also known as a hit or an image request, is an instance in which data is sent to
Adobe servers to process. The most common type of server call is a page view. A page view is
where a visitor views a page on your web site and a server call is generated to Adobe, where
information is collected, processed, and then included in your report metrics. There are other
types of server calls, including exit links and file downloads, where data is sent to Adobe to
process, but is not recorded as a new page view. Even excluded page views (excluded from
your reports by an IP address range you configure, for example) are server calls because they
are received and processed by Adobe but never show up in your reports.
Subrelation
The ability to break down conversion reports by other conversion reports. Subrelation is
synonymous with conversion report breakdown.
Success Event
Success events are actions that can be tracked. You determine what a success event is. For
example, if a visitor purchases an item, the purchase event could be considered the success
event. Other examples include media subscriptions, self-service tool usage, searches,
downloads, checkouts, etc.
Transaction Unique Customer URL
Any process set by the web site owner that begins with an order variable and ends with a
success variable. This could mean a product purchase, newsletter sign-up or e-mail request for
information after going through a preset process. A unique customer is registered when a
person makes a purchase from your site for the first time within a specified period of time. In
other words, while one person may buy from your site three times, this person would be
recorded as one unique customer. You can tell exactly how many individual people are
purchasing from your site.
Trended Report
A report view that lets you view trends over a given time period, so that you can identify data
patterns.
Unique Visitors
Unique visitors represent the number of de-duplicated (counted only once) visitors to your web
site over the course of a specified time period. A unique visitor is determined with cookies.
Unique visitors are calculated based on the selected reporting period. Any visitor during that
reporting period will be counted only once.
Visit Depth
The depth to which customers to your site browse. For example, if a customer views three
pages on your site before making a purchase, that visit depth would be three.
VISTA Rules
Visitor Identification, Segmentation and Transformation Architecture (VISTA) is a server-side
approach to populating report variables. VISTA uses visitor segmentation rules to create real-
time segmentation of all online data. These rules enable you to alter or segment data in nearly
133.
any way thatyou choose, without the need for implementing complex logic on your site. An
unlimited number of visitor segmentation rules can be defined with VISTA.
11 Adobe Analytics Templates
Campaign measurement template:
Deep dive insights request template: