
![[1] A. Fernández-Ares, A. M. Mora, J. J. Merelo, P. García-
Sánchez, and C. Fernandes, “Optimizing player behavior
in a real-time strategy game using evolutionary
algorithms,” in Evolutionary Computation, 2011. CEC ’11.
IEEE Congress on, June 2011, pp. 2017–2024.
[2] A. M. Mora, A. Fernández-Ares, J. J. M. Guervós, and P.
García-Sánchez, “Dealing with noisy fitness in the design
of a rts game bot” in EvoApplications, ser. Lecture Notes in
Computer Science, vol. 7248. Springer, 2012, pp. 234–244.
4](https://image.slidesharecdn.com/adaptativebotsforreal-timestrategygameviamap-120913081357-phpapp01/85/Adaptative-bots-for-real-time-strategy-game-via-map-characterization-4-320.jpg)


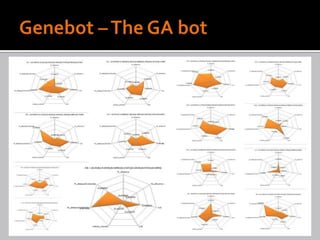
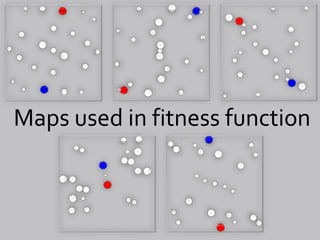
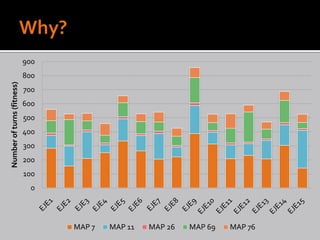


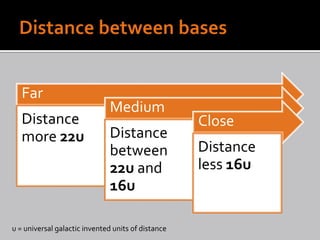


The document discusses the optimization of player behavior in a real-time strategy game through evolutionary algorithms, highlighting the development of a superior bot that outperformed another bot in 99% of simulations across various maps. Key factors such as the distance and distribution of planets on these maps were analyzed to enhance bot performance, leading to the creation of nine distinct bots tailored for different map characteristics. Experimental results indicate significant victories for the optimized bot, emphasizing the importance of genetic algorithms in gaming strategy development.


