Ad fraud is more than just bots jan 2019
•
3 likes•1,567 views

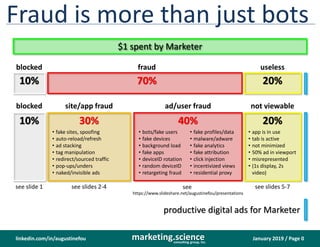
Ad fraud is only a part of the sum total of issues that make digital ads less effective and waste marketers' ad budgets -- i.e. reduced working media.

Recommended
Recommended
More Related Content
What's hot
What's hot (20)
Similar to Ad fraud is more than just bots jan 2019
Similar to Ad fraud is more than just bots jan 2019 (20)
More from Dr. Augustine Fou - Independent Ad Fraud Researcher
More from Dr. Augustine Fou - Independent Ad Fraud Researcher (20)
Recently uploaded
Recently uploaded (20)
Ad fraud is more than just bots jan 2019
- 1. January 2019 / Page 0marketing.scienceconsulting group, inc. linkedin.com/in/augustinefou Fraud is more than just bots $1 spent by Marketer blocked see slide 1 site/app fraud see slides 2-4 ad/user fraud see https://www.slideshare.net/augustinefou/presentations not viewable see slides 5-7 10% 30% 40% 20% • fake sites, spoofing • auto-reload/refresh • ad stacking • tag manipulation • redirect/sourced traffic • pop-ups/unders • naked/invisible ads • bots/fake users • fake devices • background load • fake apps • deviceID rotation • random deviceID • retargeting fraud • fake profiles/data • malware/adware • fake analytics • fake attribution • click injection • incentivized views • residential proxy • app is in use • tab is active • not minimized • 50% ad in viewport • misrepresented • (1s display, 2s video) 10% 70% 20% blocked fraud useless productive digital ads for Marketer
- 2. January 2019 / Page 1marketing.scienceconsulting group, inc. linkedin.com/in/augustinefou Overall ad blocking – B2C, B2B Higher ad blocking in b2b compared to b2s, more mobile in b2c B2C (Consumer) Jan 2019 EXCLUDE BOTS RAW (percent of data) percent NOT Blocked Blocked mobile 61.8% 0.4% 0.7% blocking rate desktop 27.6% 3.1% 10.2% blocking rate not measured 4.8% 97.8% 2.2% bots B2B Jan 2019 EXCLUDE BOTS RAW (percent of data) percent NOT Blocked Blocked mobile 34.5% 0.5% 1.3% blocking rate desktop 39.9% 9.0% 18.5% blocking rate not measured 7.9% 91.8% 8.2% bots
- 3. January 2019 / Page 2marketing.scienceconsulting group, inc. linkedin.com/in/augustinefou U.S. Digital Ad Spend Distribution $46 Search Display/Video $46 $32$39 $8 Google Search FB+Google Display$29 (outside Google/Facebook) $100 Billion Digital SpendSource: IAB 2H 2018 Report Source: Verisign, Q4 2016 329M domains est. 1 million est. 164 million 7M apps Source: Statista, March 2017 est. 10,000 est. 6.99 million 1% of impressions 99% of impressions $10B $19B Good Publishers “sites/apps with ads”
- 4. January 2019 / Page 3marketing.scienceconsulting group, inc. linkedin.com/in/augustinefou $23 (outside Google/Facebook) There’s 160X more “sites with ads” Good Publishers “sites with ads” Source: Verisign, Q4 2016 329M domains est. 164 million “sites that carry ads” “sites you’ve heard of” WSJ ESPN NYTimes Economist Reuters Elle 0.3% no ads carry ads 160X more 78% programmatic est. 1 million
- 5. January 2019 / Page 4marketing.scienceconsulting group, inc. linkedin.com/in/augustinefou $23 (outside Google/Facebook) 700X more There’s 700X more fake apps 7M apps Source: Statista, March 2017 6.99 million 96% “apps that carry ads” 10,000 “apps you’ve heard of” Facebook Spotify Pandora Zynga Pokemon YouTube Facebook, 2015 Users use 8 – 15 apps on their phones. Spotify, 2016 People have 25 apps on their phones, use 5-8 regularly Forrester Research, May 2017 Humans “use 9 apps per day, 30 per month” 78% programmatic
- 6. January 2019 / Page 5marketing.scienceconsulting group, inc. linkedin.com/in/augustinefou 1cent CPM vs All CPMs No statistical difference between 1cent CPM inventory vs All CPMs Exchange A, 1c CPM exclude app app only blended hasFocus:1 4.9% 5% 0.0% 0% 4.9% 5% -hasFocus:1 92.0% 95% 3.1% 100% 95.1% 95% 96.9% 3.1% 100.0% visibilityState:visible 57.3% 59% 1.8% 59% 59.1% 59% -visibilityState:visible 39.6% 41% 1.3% 41% 40.9% 41% 96.9% 3.1% 100.0% intersection >50% 30.8% 32% 1.5% 48% 32.3% 32% -intersection >50% 66.1% 68% 1.6% 52% 67.7% 68% 96.9% 3.1% 100.0% viewable 0.9% 0.0% 0.9% (excl hasFocus:1) viewable 18.8% 28.4% 19.1% Exchange A, All CPMs exclude app app only blended hasFocus:1 4.2% 5% 0.5% 4.8% 4.7% 5% -hasFocus:1 84.7% 95% 10.6% 95.2% 95.3% 95% 88.9% 11.1% 100.0% visibilityState:visible 69.9% 79% 9.6% 86.1% 79.5% 80% -visibilityState:visible 19.0% 21% 1.5% 13.9% 20.5% 20% 88.9% 11.1% 100.0% intersection >50% 20.1% 23% 4.2% 37.4% 24.2% 24% -intersection >50% 68.8% 77% 7.0% 62.6% 75.8% 76% 88.9% 11.1% 100.0% viewable 0.8% 1.5% 0.9% (excl hasFocus:1) viewable 17.8% 32.2% 19.3% OBSERVATIONS • Quality is virtually identical (dark blue and dark red similar across both CPM ranges) • Buying on the same exchange appears to yield very similar viewability whether the CPMs were 1cent or all CPMs • % of impressions from apps is higher for higher average CPMs
- 7. January 2019 / Page 6marketing.scienceconsulting group, inc. linkedin.com/in/augustinefou 2 Campaigns on the same DSP Quality and viewability are consistent for campaigns on same DSP Campaign A, All CPMs exclude app app only blended hasFocus:1 1.1% 1% 0.7% 4.8% 1.8% 2% -hasFocus:1 83.6% 99% 14.6% 95.2% 98.2% 98% 84.7% 15.3% 100.0% visibilityState:visible 61.1% 72% 13.7% 89.3% 74.8% 75% -visibilityState:visible 23.6% 28% 1.6% 10.7% 25.2% 25% 84.7% 15.3% 100.0% intersection >50% 17.1% 20% 7.4% 48.2% 24.5% 24% -intersection >50% 67.6% 80% 7.9% 51.8% 75.5% 76% 84.7% 15.3% 100.0% viewable 0.2% 2.1% 0.3% (excl hasFocus:1) viewable 14.6% 43.1% 18.3% Campaign B, All CPMs exclude app app only blended hasFocus:1 1.0% 1% 0.5% 2.7% 1.5% 2% -hasFocus:1 80.8% 99% 17.7% 97.3% 98.5% 99% 81.8% 18.2% 100.0% visibilityState:visible 57.8% 71% 12.9% 70.5% 70.6% 71% -visibilityState:visible 24.0% 29% 5.4% 29.5% 29.4% 29% 81.8% 18.2% 100.0% intersection >50% 11.2% 14% 5.2% 28.5% 16.4% 16% -intersection >50% 70.6% 86% 13.0% 71.5% 83.6% 84% 81.8% 18.2% 100.0% viewable 0.1% 0.5% 0.2% (excl hasFocus:1) viewable 9.7% 20.1% 11.6% OBSERVATIONS • Quality is virtually identical (dark blue and dark red similar across both campaigns) • Buying on the same DSP appears to yield very similar viewability results across campaigns • % of impressions from apps vs non-apps are consistent across campaigns
- 8. January 2019 / Page 7marketing.scienceconsulting group, inc. linkedin.com/in/augustinefou Exchange A vs Exchange B Exchange A has more confirmed humans, higher quality than B Exchange A, All CPMs exclude app app only blended hasFocus:1 4.2% 5% 0.5% 4.8% 4.7% 5% -hasFocus:1 84.7% 95% 10.6% 95.2% 95.3% 95% 88.9% 11.1% 100.0% visibilityState:visible 69.9% 79% 9.6% 86.1% 79.5% 80% -visibilityState:visible 19.0% 21% 1.5% 13.9% 20.5% 20% 88.9% 11.1% 100.0% intersection >50% 20.1% 23% 4.2% 37.4% 24.2% 24% -intersection >50% 68.8% 77% 7.0% 62.6% 75.8% 76% 88.9% 11.1% 100.0% viewable 0.8% 1.5% 0.9% (excl hasFocus:1) viewable 17.8% 32.2% 19.3% Exchange B, All CPMs exclude app app only blended hasFocus:1 0.4% 0% 0.0% 0.0% 0.4% 0% -hasFocus:1 95.1% 100% 4.5% 100.0% 99.7% 100% 95.5% 4.5% 100.0% visibilityState:visible 34.3% 36% 4.2% 92.2% 38.4% 38% -visibilityState:visible 61.2% 64% 0.4% 7.8% 61.6% 62% 95.5% 4.5% 100.0% intersection >50% 8.0% 8% 0.5% 10.9% 8.5% 9% -intersection >50% 87.5% 92% 4.0% 89.1% 91.5% 91% 95.5% 4.5% 100.0% viewable 0.0% 0.0% 0.0% (excl hasFocus:1) viewable 3.0% 10.0% 3.3%
- 9. January 2019 / Page 8marketing.scienceconsulting group, inc. linkedin.com/in/augustinefou 2017 Digital Ad Productivity est. Served ad impressions Not NHT 74% 26% Avg NHT “working digital media” fees, profit margin (ad tech, middlemen) 1/3rd 2/3rd “At the very best, only 60 cents of every dollar spent in digital media actually goes towards ‘working digital media’.” “productive digital ads” 59% not viewable 35% ad blocked Viewable 41% Not Blocked 10% confirmed humans 16%