
Download to read offline
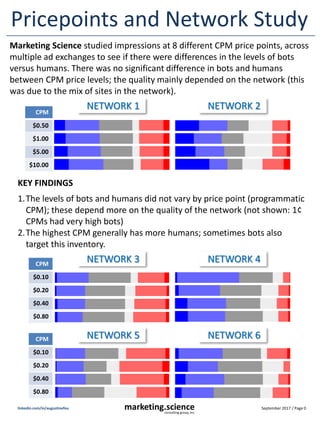
The study analyzed ad impressions across two networks at various CPM price points and found no significant difference in the levels of bots versus humans, with quality mainly determined by the network. Higher CPMs had more humans but also more bots, and viewability was consistent across price points, depending on the network. The report advises avoiding inventory priced below 50¢ due to high fraud rates.


