Download as DOC, PPTX

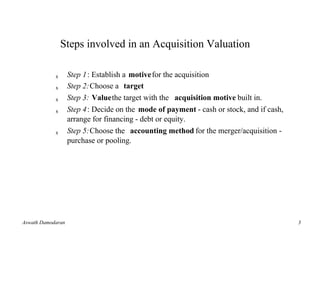

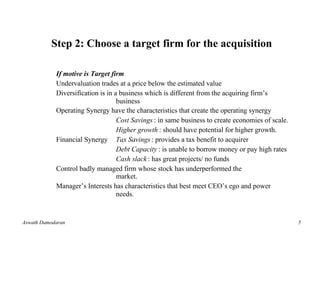


The document discusses issues related to acquisition valuation, including: 1) Acquisition valuations consider synergies and control premium, which go beyond just valuing the target firm. 2) The document outlines the key steps in an acquisition valuation process: establishing the motive, choosing a target, valuing the target with the motive incorporated, and deciding on payment terms. 3) Factors like synergies, control premium, and stand-alone valuation are discussed in the context of valuing the target firm and determining the maximum price an acquirer should pay.


