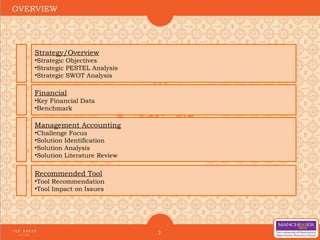
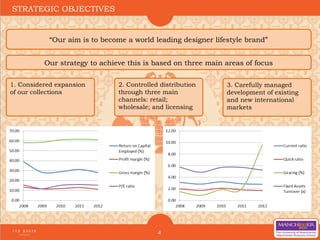
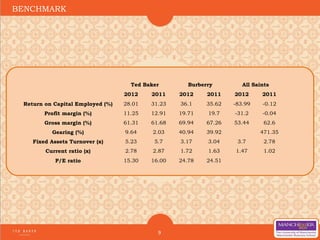
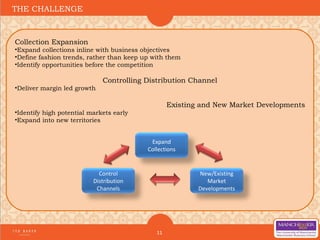
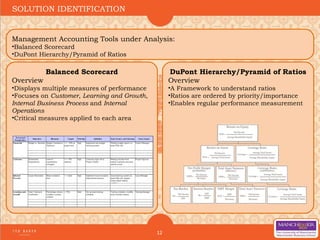
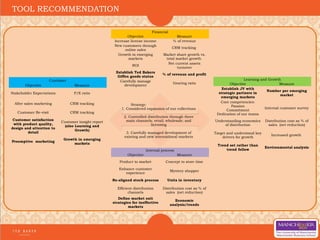
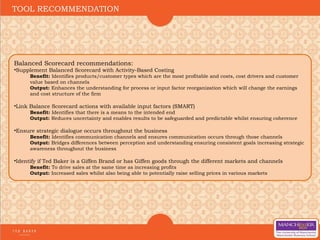
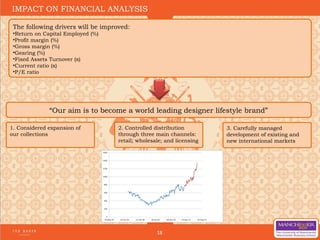
The document provides an overview of Ted Baker's strategic objectives, which are to expand their collections, control distribution through retail, wholesale and licensing channels, and carefully manage existing and new international markets. It analyzes Ted Baker's strategy using PESTEL, SWOT and financial analyses. Two management accounting tools - the balanced scorecard and DuPont analysis - are identified as potential solutions. The balanced scorecard is recommended to supplement financial measures and ensure strategic alignment. Metrics are proposed to measure objectives across customers, learning & growth, internal processes and finance. The recommendation aims to improve Ted Baker's return on capital employed, profit margin, and other financial ratios to achieve their strategic goals.
4. 4
STRATEGIC OBJECTIVES
1. Considered expansion
of our collections
“Our aim is to become a world leading designer lifestyle brand”
Our strategy to achieve this is based on three main areas of focus
2. Controlled distribution
through three main
channels: retail;
wholesale; and licensing
3. Carefully managed
development of existing
and new international
markets
5. 5
STRATEGIC SWOT ANALYSIS
Strengths
•Strong brand name
•Niche market in high-end fashion
•Geographical diversity
Weakness
•Escalating debt
•Cash flow cycle
•Distribution competency
Opportunities
•Global expansion plans
•New market exploitation
•Online sales in developing markets
•Traditional Marketing
•Fast changing fashion trends
Threats
•Strong competition both locally and
internationally
•Change in labour/wage law
6. 6
STRATEGIC PESTEL ANALYSIS
Political
•Political environment is quite stable in the
regions company operates ( Aim 3 )
•No apparent affect on religion ( Aim 3 )
Economical
•Economic uncertainty (Aim 2)
•Reward package to keep the talented within
the company (All 3 aims)
Social
•Demand for recyclable clothes (Aim 1)
•Social media marketing (All 3 aims)
•Change in fashion trends (Aim 1 & 3)
Technological
•Strong growth in online activities (Aim 2 &
3)
•Upgrading of security equipment to safe
guard the increased online customer base
(Aim 2 & 3)
•Online and social media marketing (All 3)
Legislative
•Corporate tax rate reduction in UK ( Aim 3 )
•Change in labour/wage laws ( Aim 3 )
Environmental
•*All underwear, pants & socks made with
organic cotton ( Aim 3 )
•*2% of the collection is currently made of
sustainable materials. ( Aim 3 )
•**Green 500 member (Aim 2 & 3)
11. 11
THE CHALLENGE
Collection Expansion
•Expand collections inline with business objectives
•Define fashion trends, rather than keep up with them
•Identify opportunities before the competition
Controlling Distribution Channel
•Deliver margin led growth
Existing and New Market Developments
•Identify high potential markets early
•Expand into new territories
Control
Distribution
Channels
New/Existing
Market
Developments
Expand
Collections
12. 12
SOLUTION IDENTIFICATION
Management Accounting Tools under Analysis:
•Balanced Scorecard
•DuPont Hierarchy/Pyramid of Ratios
Balanced Scorecard
Overview
•Displays multiple measures of performance
•Focuses on Customer, Learning and Growth,
Internal Business Process and Internal
Operations
•Critical measures applied to each area
DuPont Hierarchy/Pyramid of Ratios
Overview
•A Framework to understand ratios
•Ratios are ordered by priority/importance
•Enables regular performance measurement
13. 13
SOLUTION ANALYSIS
Balanced Scorecard
Advantages
•Makes strategy operational
•Provides a balanced performance picture
•Combines quantitative and qualitative
measures
•Assists in clarifying vision/strategies
Disadvantages
•Potential high implementation cost
•Requirement of clearly defined objectives
•Four areas do not provide a whole picture
DuPont Hierarchy/Pyramid of Ratios
Advantages
•Provides a prioritised view of performance
•Can also be adapted for specific SBUs
•Non-financial data can be introduced
•Identification of ratio relationships
Disadvantages
•Sometimes difficult to see how performance
can affect high-end ratios
•Limited to only those ratios that can be
originally derived from ROCE
•Cannot include important indicators of risk
(Current/Gearing Ratios)
14. 14
Gaps exist between the strategy
expressed in the actions and the
planned strategy
SOLUTION LITERATURE REVIEW
“Unfortunately, benchmarking is one of those initially
good ideas that has turned into a fad. About 95% of
those companies that have tried benchmarking have
spent a lot of money and have got very little return”
(Kaplan et al, 1992)
“Balanced Scorecard aims to contribute to reducing
the problems involved in using only financial measures
for the purposes of control” (Norreklit, 2000)
Other methods (e.g. Du Pont
Pyramids) generally focus on
financial measures
"There is not a causal but rather a logical relationship
among the areas analyzed” (Norreklit, 2000)
Intangible elements tend to be logical
rather causal
“The balanced scorecard is not a valid strategic
management tool, mainly because it does not ensure
any organizational rooting, but also because it has
problems ensuring environmental rooting” (Norreklit,
2000)
“The Balanced Scorecard puts Strategy – not Control –
at the center” (Kaplan et al, 1992)
Alignment to strategy achieving
results and key metrics
The Balanced Scorecard could not be implemented
without the involvement of senior management
(Kaplan et al, 1992)
Essential that management buy-in is
obtained to resolve limited visibility
Benchmarking isn’t critical to
Balanced Scorecard however does
enable a basis for comparison
16. TOOL RECOMMENDATION
Customer
Objective Measure
Stakeholder Expectations P/E ratio
After sales marketing CRM tracking
Customer Re-visit CRM tracking
Customer satisfaction
with product quality,
design and attention to
detail
Customer insight report
(also Learning and
Growth)
Preemptive marketing
Growth in emerging
markets
Learning and Growth
Objective Measure
Establish JV with
strategic partners in
emerging markets
Number per emerging
market
Core competencies:
Passion
Commitment
Dedication of our teams
Internal customer survey
Understanding economics
of distribution
Distribution cost as % of
sales (net reduction)
Target and understand key
drivers for growth
Increased growth
Trend set rather than
trend follow
Environmental analysis
Financial
Objective Measure
Increase license income % of revenue
New customers through
online sales
CRM tracking
Growth in emerging
markets
Market share growth vs.
total market growth
ROI
Net current assets
turnover
Establish Ted Bakers
Giffen goods status
% of revenue and profit
Carefully manage
development
Gearing ratio
Internal process
Objective Measure
Product to market Concept to store time
Enhance customer
experience
Mystery shopper
Re-aligned stock process Units in inventory
Efficient distribution
channels
Distribution cost as % of
sales (net reduction)
Define market exit
strategies for ineffective
markets
Economic
analysis/trends
Strategy:
1. Considered expansion of our collections
2. Controlled distribution through three
main channels: retail; wholesale; and
licensing
3. Carefully managed development of
existing and new international markets
17. Balanced Scorecard recommendations:
•Supplement Balanced Scorecard with Activity-Based Costing
Benefit: Identifies products/customer types which are the most profitable and costs, cost drivers and customer
value based on channels
Output: Enhances the understanding for process or input factor reorganization which will change the earnings
and cost structure of the firm
•Link Balance Scorecard actions with available input factors (SMART)
Benefit: Identifies that there is a means to the intended end
Output: Reduces uncertainty and enables results to be safeguarded and predictable whilst ensuring coherence
•Ensure strategic dialogue occurs throughout the business
Benefit: Identifies communication channels and ensures communication occurs through those channels
Output: Bridges differences between perception and understanding ensuring consistent goals increasing strategic
awareness throughout the business
•Identify if Ted Baker is a Giffen Brand or has Giffen goods through the different markets and channels
Benefit: To drive sales at the same time as increasing profits
Output: Increased sales whilst also being able to potentially raise selling prices in various markets
TOOL RECOMMENDATION
18. 18
IMPACT ON FINANCIAL ANALYSIS
The following drivers will be improved:
•Return on Capital Employed (%)
•Profit margin (%)
•Gross margin (%)
•Gearing (%)
•Fixed Assets Turnover (x)
•Current ratio (x)
•P/E ratio
1. Considered expansion of
our collections
“Our aim is to become a world leading designer lifestyle brand”
2. Controlled distribution
through three main channels:
retail; wholesale; and licensing
3. Carefully managed
development of existing and
new international markets
A quarter of Ted Baker's sales came from overseas, up from 20 percent a year ago, Page said. Online sales jumped 82 percent and made for roughly 5 percent of total sales. - http://uk.reuters.com/article/2012/10/04/uk-tedbaker-results-idUKBRE8930EE20121004
"The irony is that Ted Baker has done nothing remarkable," McGregor stated. "Instead, it's enthusiastic, creative and 100% Tedicated to its core customers and this is serving it well. - http://www.iii.co.uk/articles/82155/next-cautious-ted-baker-flourishes
Source: Fame Database and Ted Baker Website (http://www.tedbakerplc.com/ted/en/aboutus/strategy)
Source: Ted Baker, Burberry and All Saints Annual Reports
Source: The du Pont ‘pyramid’ of ratios
BS Advantages
Strategies are made increasingly visible
A balanced picture throughout the business is provided
Incorporates qualitative and quantitative data
Clarifies the Vision and Strategies by attributing data to them
BS Disadvantages
High implementation costs through training, time to create, strategy formulation etc
The four areas do not provide a complete picture
DP Advantages
Prioritised view of performance objectives
Can be adapted for different SBUs
Can incorporate non-financial data
Identifies relationships between ratios
DP Disadvantages
Can be difficult to see how performance can affect certain ratios
Limited to only the ratios than can be derived from ROCE (a focus for Ted Baker analysis)
Cannot include Current/Gearing Ratios (a focus for Ted Baker analysis)
Source:
The Balanced Scorecard – Measures That Define Performance (1992), Kaplan, R; Norton, D; Harvard Business Review, http://www.stevens-tech.edu/MSISCourses/450/Articles/ValueOfIT/TheBalancedScoreCard.pdf
The balance on the balanced scorecard- a critical analysis of some of its assumptions, (2000), Norreklit, H, Management Accounting Research, http://www.sciencedirect.com/science/article/pii/S104450059990121X#