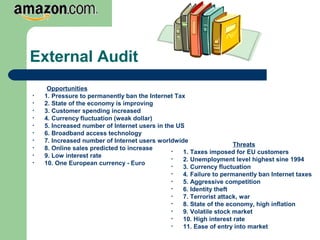
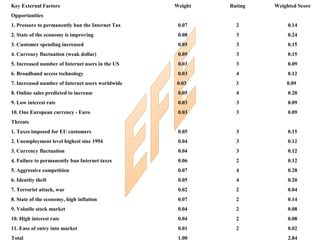
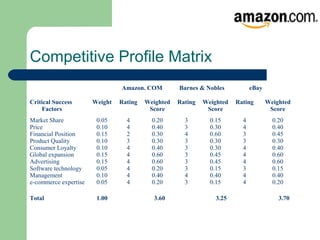
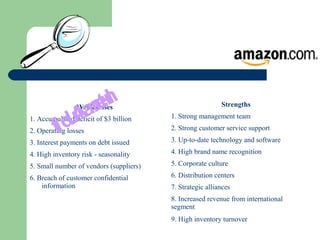
Presented by:
Amy Kakuk,
Jessica Bourgoin,
and Beth Theriault
April 14, 2005
Outline
 History
 Where we Stand Today
 Vision Statement
 Mission Statements
– Actual
– Proposed
 Business Segments
 External Audit
– Opportunities
– Threats
 EFE
 CPM
 Internal Audit
– Strengths
– Weaknesses
 IFE
 Matrix Analysis
– SWOT Matrix
– Space Matrix
– Grand Strategy Matrix
– BCG Matrix
– IE Matrix
 Matrix and SWOT Summary
 Financial Ratios
 QSPM
 Strategy Recommendations
 EPS/EBIT Analysis
 Future Goals/Objectives
 Amazon. COM in the News
•Amazon was incorporated in the state of Washington on July 5, 1994.
•Before the company was renamed Amazon it was called Cadabra, Inc.
•The company was developed by Jeff Bezos and two associates in a garage
converted into a shop.
•The company began selling to the public in July 1995.
•On May 15, 1997 the company went public with an opening price of $18 per
share.
•In 1999, the company bought 46% of drugstore.com and launched it’s own
auction site to challenge e-bay.
•In 2002, Virgin Entertainment Group and Amazon.com relaunched
www.virginmega.com as a co-branded Web site.
•Also in 2002, Amazon.com launched Amazon.ca, bringing Canadians the
selection, convenience, and the value of the Amazon shopping experience.
A little about us…
 Headquarters is located in Seattle,
Washington.
 Amazon’s common stock is publicly traded
on the NASDAQ under AMZN.
 Our web-site address is amazon.com
Where we stand today..
Amazon.com, Inc. is an internet-based company that offers
books, music, videos, DVDs, electronics, software, toys, video
games, electronic greeting cards, home improvements, online
auctions, and a virtual mall called z-shops. Amazon has sites in
France, Japan, Germany and the United Kingdom. Domestically,
Amazon has experienced tremendous growth since its inception.
However, that growth has not come without a cost. As the world
economy worsens, Amazon faces pressure from stockholders as
well as the entire financial community to realize a profit. Amazon
has created a platform and customer base that many companies
envy, but can they stay in business long enough to reach
profitability.
Price and Volume
Information from Amazon.com
Recent Price $34.60
Trade Date 04/11/05
52-Week High $54.70
52-Week Low $32.82
Beta (5-Year) 2.37
Stock Chart (May 2003 – March
2005)
Chart from Amazon.com
Vision Statement (proposed)
To be the largest mass online
merchandiser on earth.
Mission Statement
Actual
The company motto: “Work Hard, Have Fun,
and Make History.”
The company’s six core values: customer
obsession, ownership, bias for action,
frugality, high hiring bar, and innovation.
Proposed
Our first responsibility is to service our worldwide (1)
online customers. (2) We pledge to make every effort
to improve the level of customer service throughout
the e-commerce industry by using up-to-date
hardware and software (3) and by listening to our
customers. We will offer customers increased product
selections (4) to fulfill their online shopping desires.
We strive to be the most used e-commerce portal on
the World Wide Web (6), while conducting operations
in a highly ethical (5) manner to ensure the long-term
profitability and growth for shareholders.(7) We
pledge to contribute to the economic strength of
society and to function as an exceptional corporate
citizen in all countries that we do business. (8) We
vow to recruit, develop, motivate, reward and retain
personnel of exceptional ability, character, and
dedication. In return, we will provide them good
working conditions, superior leadership, short and
long term compensation, and an opportunity for
individual growth and employment security.(9)
1. Market
2. Customer
3. Technology
4. Product or services
5. Philosophy
6. Self Concept
7. Concern for survival,
growth, and
profitability
8. Concern for public
image
9. Concern for
employees
Business Segments
•The North America segment consists of amounts earned from retail sales
through www.amazon.com and www.amazon.ca, Syndicated Stores and
mail-order catalogs, Merchant.com, marketing, and promotional
agreements. This segment has seen a growth in net sales from $2.382
billion in 2000 to $2.74 billion in 2002
•The International Segment consists of amounts earned from retail sales
through www.amazon.co.uk, www.amazon.de, www.amazon.fr, and
www.amazon.co.jp, Syndicated Stores, and international focused
marketing and promotional agreements. This segment has seen a growth
in net sales from $381million in 2000 to $1.17billion in 2002
External Audit
Threats
• 1. Taxes imposed for EU customers
• 2. Unemployment level highest sine 1994
• 3. Currency fluctuation
• 4. Failure to permanently ban Internet taxes
• 5. Aggressive competition
• 6. Identity theft
• 7. Terrorist attack, war
• 8. State of the economy, high inflation
• 9. Volatile stock market
• 10. High interest rate
• 11. Ease of entry into market
Opportunities
• 1. Pressure to permanently ban the Internet Tax
• 2. State of the economy is improving
• 3. Customer spending increased
• 4. Currency fluctuation (weak dollar)
• 5. Increased number of Internet users in the US
• 6. Broadband access technology
• 7. Increased number of Internet users worldwide
• 8. Online sales predicted to increase
• 9. Low interest rate
• 10. One European currency - Euro
Key External Factors Weight Rating Weighted Score
Opportunities
1. Pressure to permanently ban the Internet Tax 0.07 2 0.14
2. State of the economy is improving 0.08 3 0.24
3. Customer spending increased 0.05 3 0.15
4. Currency fluctuation (weak dollar) 0.05 3 0.15
5. Increased number of Internet users in the US 0.03 3 0.09
6. Broadband access technology 0.03 4 0.12
7. Increased number of Internet users worldwide 0.03 3 0.09
8. Online sales predicted to increase 0.05 4 0.20
9. Low interest rate 0.03 3 0.09
10. One European currency - Euro 0.03 3 0.09
Threats
1. Taxes imposed for EU customers 0.05 3 0.15
2. Unemployment level highest sine 1994 0.04 3 0.12
3. Currency fluctuation 0.04 3 0.12
4. Failure to permanently ban Internet taxes 0.06 2 0.12
5. Aggressive competition 0.07 4 0.28
6. Identity theft 0.05 4 0.20
7. Terrorist attack, war 0.02 2 0.04
8. State of the economy, high inflation 0.07 2 0.14
9. Volatile stock market 0.04 2 0.08
10. High interest rate 0.04 2 0.08
11. Ease of entry into market 0.01 2 0.02
Total 1.00 2.84
Competitive Profile Matrix
Amazon. COM Barnes & Nobles eBay
Critical Success
Factors
Weight Rating Weighted
Score
Rating Weighted
Score
Rating Weighted
Score
Market Share
Price
Financial Position
Product Quality
Consumer Loyalty
Global expansion
Advertising
Software technology
Management
e-commerce expertise
0.05
0.10
0.15
0.10
0.10
0.15
0.15
0.05
0.10
0.05
4
4
2
3
4
4
4
4
4
4
0.20
0.40
0.30
0.30
0.40
0.60
0.60
0.20
0.40
0.20
3
3
4
3
3
3
3
3
4
3
0.15
0.30
0.60
0.30
0.30
0.45
0.45
0.15
0.40
0.15
4
4
3
3
4
4
4
3
4
4
0.20
0.40
0.45
0.30
0.40
0.60
0.60
0.15
0.40
0.20
Total 1.00 3.60 3.25 3.70
Weaknesses
1. Accumulated deficit of $3 billion
2. Operating losses
3. Interest payments on debt issued
4. High inventory risk - seasonality
5. Small number of vendors (suppliers)
6. Breach of customer confidential
information
InternalAudit
Strengths
1. Strong management team
2. Strong customer service support
3. Up-to-date technology and software
4. High brand name recognition
5. Corporate culture
6. Distribution centers
7. Strategic alliances
8. Increased revenue from international
segment
9. High inventory turnover
Key Internal Factors Weight Rating Weighted
Score
Strengths
1. Strong management team 0.10 4 0.40
2. Strong customer service support 0.07 4 0.28
3. Up-to-date technology and software 0.08 4 0.32
4. High brand name recognition 0.10 4 0.40
5. Corporate culture 0.07 3 0.21
6. Distribution centers 0.05 3 0.15
7. Strategic alliances 0.07 3 0.21
8. Increased revenue from international segment 0.03 3 0.09
9. High inventory turnover 0.03 3 0.09
Weaknesses
1. Accumulated deficit of $3 billion 0.10 1 0.10
2. Operating losses 0.05 1 0.05
3. Interest payments on debt issued 0.05 2 0.10
4. High inventory risk - seasonality 0.05 2 0.10
5. Small number of vendors (suppliers) 0.05 2 0.10
6. Breach of customer confidential information 0.10 2 0.20
TOTAL 1.00 2.80
IFE
S-O Strategies
Market penetration – increase
marketing expenditures to 5% of net
sales (O3, O5, O9, S4, S2,
S9)Lobby to permanently ban
Internet Tax (O1, O7, S1, S4)
S-T Strategies
Lobby to permanently ban Internet
Tax ( T4, S1)Horizontal
Diversification – create a Web
search engine (T5, T11, S1, S2,
S4).
W-O Strategies
Concentric Diversification – add
new services/products to level
seasonality- food & beverage
(O1, O2, O5, O9, W4, W5)
W-T Strategies
Lower prices (T4, T5, T11, W4)
SWOT MatrixSWOT Matrix
FS
CA IS
ES
AggressiveAggressiveConservativeConservative
DefensiveDefensive CompetitiveCompetitive
Space Matrix
Quadrant II Quadrant I
Quadrant IV
Grand Strategy Matrix
Weak
Competitive
Position
Strong
Competitive
Position
Slow
Market
Growth
Rapid
Market
Growth
1. Market Development
2. Market Penetration
3. Product Development
4. Forward/Backward/Horizontal Integration
5. Concentric Diversification
BCG Matrix
High
+20
Med
0
Stars
Domestic
Question Marks
International
Low
-20
Cash Cows Dogs
High 1.0 Medium .50 Low 0.0
Relative Market Share Position
Industry
Sales
Growth
Rate
1.0 to
1.99
IXVIIIVIILow
2.0 to
2.99
The EFE
Total
Weighted
Score
VIVIVMedium
DomesticInternational3.0 to
3.99
IIIIIIHigh
1.0 to 1.992.0 to 2.993.0 to 4.0
WeakAverageStrong
The IFE Total Weighted Score
Internal-External (IE)
Matrix
Hold and
Maintain
Matrix Analysis and SWOT Summary
Alternative Strategies IE SPACE GRAND COUNT
Forward Integration * * * 3
Backward Integration * * * 3
Horizontal Integration * * * 3
Market Penetration * * * 3
Market Development * * * 3
Product Development * * * 3
Concentric Diversification * * 2
Conglomerate Diversification * 1
Horizontal Diversification * 1
Joint Venture * 1
Retrenchment
Divestiture
Liquidation
Financial Ratio Analysis (March 2004)
Company Industry Sector S&P 500
Valuation Ratios
P/E Ratio (TTM) 559.59 41.01 28.90 24.01
P/E High - Last 5 Yrs NA 45.19 48.47 45.41
P/E Low - Last 5 Yrs NA 15.69 16.09 16.26
Beta 2.23 1.30 0.96 1.00
Price to Sales (TTM) 3.16 5.40 2.80 3.33
Price to Cash Flow (TTM) 145.89 29.19 17.03 17.32
Price to Free Cash Flow
(TTM)
48.12 43.57 33.11 28.97
% Owned Institutions 58.35 68.16 50.48 64.19
Dividends Amazon Sector Industry S&P 500
Dividend Yield N/A 1.17 2.14 2.04
Dividend Yield - 5 Yr Avg 0.00 0.22 1.43 1.48
Dividend 5 Yr Growth Rate NM 7.00 -0.89 6.48
Payout Ratio (TTM) 0.00 2.12 15.54 26.78
Growth Rates %
Sales (MRQ) vs Qtr 1 Yr Ago 36.20 24.97 14.39 13.40
Sales - 5 Yr Growth Rate 53.89 35.47 17.25 9.30
EPS (MRQ) vs Qtr 1 Yr Ago 2357.14 27.30 15.43 28.69
EPS - 5 Yr Growth Rate NM 43.79 15.23 12.15
Capital Spending - 5 Yr
Growth
Rate
10.16 15.62 2.61 4.06
Financial Ratio Analysis (cont.)
Financial Strength Amazon Sector Industry S&P 500
Quick Ratio (MRQ) 1.11 1.22 0.93 1.26
Current Ratio (MRQ) 1.45 2.19 1.47 1.76
LT Debt to Equity (MRQ) N/A 0.66 0.74 0.68
Total Debt to Equity
(MRQ)
N/A 0.73 0.82 0.85
Interest Coverage (TTM) 2.08 16.81 7.84 11.86
Profitability Ratios %
Gross Margin (TTM) 23.88 42.23 42.84 47.32
Gross Margin - 5 Yr Avg 23.23 41.08 42.06 47.01
EBITD Margin (TTM) 5.19 13.65 22.32 20.79
Financial Ratio Analysis (cont.)
Amazon Industry Sector S&P 500
Operating Margin - 5 Yr Avg -14.93 6.75 11.21 18.35
Pre-Tax Margin (TTM) 0.68 11.64 10.37 17.27
Pre-Tax Margin - 5 Yr Avg -19.84 7.27 11.77 17.54
Net Profit Margin (TTM) 0.68 7.76 7.54 13.12
Net Profit Margin - 5 Yr Avg -19.84 3.74 7.62 11.59
Management Effectiveness %
Return on Assets (TTM) 1.94 8.29 5.91 6.40
Return on Assets - 5 Yr Avg -24.73 4.45 5.49 6.79
Return on Investment (TTM) 3.89 11.53 7.98 9.97
Return on Investment - 5 Yr Avg -40.89 5.83 7.59 10.93
Return on Equity (TTM) N/A 14.04 13.51 18.71
Return on Equity - 5 Yr Avg N/A 13.84 13.18 19.22
Financial Ratio Analysis (cont.)
Efficiency Amazon Sector Industry S&P 500
Revenue/Employee (TTM) 674,833
393,35
1
479,338 622,866
Net Income/Employee (TTM) 4,579 29,688 90,606 81,707
Receivable Turnover (TTM) N/A 26.71 17.23 9.76
Inventory Turnover (TTM) 18.39 6.48 17.53 10.46
Asset Turnover (TTM 2.86 1.91 1.17 0.92
Financial Ratio Analysis (cont.)
Financial Information
 Amazon.com had an increase in revenue of
2141.3 million from 2001 to 2003
 In 2001 and 2003, Amazon.com’s net income
was in the negative, but in 2003 they had a
positive net income of $35.3 million
 They have experienced a decrease in their
total debt from 2001 to 2003 of $221.4 million
Key External Factors
Weight
Create a
web
Search
engine
Start
Gourmet
food
wholesaler
Opportunities AS TAS AS TAS
1. Pressure to permanently ban the Internet Tax 0.07 1 0.07 1 0.07
2. State of the economy is improving 0.08 1 0.08 3 0.24
3. Customer spending increased 0.05 1 0.05 3 0.15
5. Increased number of Internet users in the US 0.03 3 0.09 4 0.12
6. Broadband access technology 0.03 4 0.12 3 0.09
8. Increased number of Internet users worldwide 0.03 3 0.09 4 0.12
9. Online sales predicted to increase 0.05 1 0.05 3 0.15
10. Low interest rate 0.03 1 0.03 2 0.06
Threats
2. Unemployment level highest since 1994 0.04 1 0.04 2 0.08
4. Failure to permanently ban Internet taxes 0.06 1 0.06 1 0.06
5. Aggressive competition 0.07 4 0.28 3 0.21
6. Identity theft 0.05 1 0.05 1 0.05
8. State of the economy, high inflation 0.07 1 0.07 2 0.14
11. Ease of entry into market 0.01 3 0.03 4 0.04
SUBTOTAL 1.11 1.58
Key Internal Factors
Weight
Create a
web search
engine
Start gourmet
food
wholesaler
Strengths AS TAS AS TAS
1. Strong management team 0.10 2 0.20 4 0.40
2. Strong customer service support 0.07 1 0.07 4 0.28
3. Up-to-date technology and software 0.08 3 0.24 4 0.32
4. High brand name recognition 0.10 1 0.10 4 0.40
5. Corporate culture 0.07 1 0.07 3 0.21
Weaknesses
1. Accumulated deficit of $3 billion 0.10 1 0.10 2 0.20
2. Operating losses 0.05 2 0.10 1 0.05
SUBTOTAL 1.00 0.88 1.86
Total Attractiveness Score 1.81 3.26
Strategy Recommendations and
Implementation
Market penetration – increase market share for present products
in present markets through greater marketing efforts.
Increase marketing expenses to 3% of net sales for the next
three years compared to 2% in 2002.
 Reasons – aggressive advertising from new competitors
such as buy. COM, overstock. COM.
Target the marketing campaign.
 Costs associated with this strategy – increase in fulfillment
costs and marketing costs. Fulfillment costs are 10% of net
sales. For the period 2003 – 2005, these costs amount to
$2,084,000,000. The 1% increase in marketing costs for the
period 2003 -2005 amounts to $208,440,000.
Strategy Recommendations and
Implementation
Concentric diversification – add new but related products/services.
 Example – start an online gourmet food and beverage store
using a wholesaler such as Seattle Chocolate Co.
 Reasons – take advantage of brand name recognition and
customer loyalty.
 Because this strategy does not involve any inventory build-up,
costs associated are relatively low.
Horizontal diversification – add new, unrelated products/services for
present customers.
 Example – develop a search engine to control the path to
online merchants.
 Risk – similar services are already available: Yahoo, Google.
EPS/EBIT Analysis
Recession Normal Boom Recession Normal Boom
EBIT 500,000,0001,000,000,0001,500,000,000500,000,0001,000,000,0001,500,000,000
Interest 0 0 0 50,000,000 50,000,000 50,000,000
EBT 500,000,0001,000,000,0001,500,000,000450,000,000 950,000,0001,450,000,000
Taxes 0 0 0 0 0 0
EAT 500,000,0001,000,000,0001,500,000,000450,000,000 950,000,0001,450,000,000
#Shares440,631,579 440,631,579 440,631,579 388,000,000 388,000,000 388,000,000
EPS 1.13 2.27 3.40 1.16 2.45 3.74
CommonStockFinancing DebtFinancing
Recession Normal Boom Recession Normal Boom
EBIT500,000,0001,000,000,0001,500,000,000500,000,0001,000,000,0001,500,000,000
Interest 15,000,000 15,000,000 15,000,000 35,000,000 35,000,000 35,000,000
EBT 485,000,000985,000,0001,485,000,000465,000,000965,000,0001,465,000,000
Taxes 0 0 0 0 0 0
EAT 485,000,000985,000,0001,485,000,000465,000,000965,000,0001,465,000,000
#Shares424,842,105424,842,105 424,842,105403,789,474403,789,474 403,789,474
EPS 1.14 2.32 3.50 1.15 2.39 3.63
70PercentDebt-30PercentStock70PercentStock-30PercentDebt
Amount Needed 1,000M
Interest 5%
Tax Rate 0%
Share Price $19
Shares Outstanding 388M
Net Worth Analysis
1. Stockholders’ Equity = $(1,355,900,000)
2. Net Income (12/31/2002) * 5 = $149,100,000 * 5 = $(745,500,000)
3. Share price / EPS * Net Income = $19/$(0.39)*$(149,100,000) = $(7,263,846,154)
4. Number of shares outstanding * Share price = 388,000,000*$19 = $7,372,000,000
Goals and Objectives
For the next 3-4 years, Amazon is hoping to have
started their online gourmet food and beverage
store.
Also, Amazon want to increase their marketing
expenses from 2% of net sales to 3%. This will give
them more advertising and brand recognition.
Amazon has recently launched their search engine
called A9. Now they need to spend the next three
year trying to get the name known and get in the
competition with yahoo and google.
2005 Press Releases
Apr.04 Amazon.com Acquires BookSurge LLC
Mar.11 Amazon.com to Webcast Investor Conference Presentation
Feb.15 Amazon.com Announces New Award for Innovative Nonprofit Organiza
Feb.08 Amazon.com Jewelry Sales Up More Than 120 Percent
Feb.02 Amazon.com Announces Record Free Cash Flow Fueled by Lower Prices
Jan.21 Amazon Web Services Gives Software Developers First-Ever Access to
Amazon.ca and Amazon.fr
Jan.17 Amazon Services and Diane Von Furstenberg Studio Announce E-Comm
Press releases form Amazon.com

About Amazon.com

  • 1.
    Presented by: Amy Kakuk, JessicaBourgoin, and Beth Theriault April 14, 2005
  • 2.
    Outline  History  Wherewe Stand Today  Vision Statement  Mission Statements – Actual – Proposed  Business Segments  External Audit – Opportunities – Threats  EFE  CPM  Internal Audit – Strengths – Weaknesses  IFE  Matrix Analysis – SWOT Matrix – Space Matrix – Grand Strategy Matrix – BCG Matrix – IE Matrix  Matrix and SWOT Summary  Financial Ratios  QSPM  Strategy Recommendations  EPS/EBIT Analysis  Future Goals/Objectives  Amazon. COM in the News
  • 3.
    •Amazon was incorporatedin the state of Washington on July 5, 1994. •Before the company was renamed Amazon it was called Cadabra, Inc. •The company was developed by Jeff Bezos and two associates in a garage converted into a shop. •The company began selling to the public in July 1995. •On May 15, 1997 the company went public with an opening price of $18 per share. •In 1999, the company bought 46% of drugstore.com and launched it’s own auction site to challenge e-bay. •In 2002, Virgin Entertainment Group and Amazon.com relaunched www.virginmega.com as a co-branded Web site. •Also in 2002, Amazon.com launched Amazon.ca, bringing Canadians the selection, convenience, and the value of the Amazon shopping experience.
  • 4.
    A little aboutus…  Headquarters is located in Seattle, Washington.  Amazon’s common stock is publicly traded on the NASDAQ under AMZN.  Our web-site address is amazon.com
  • 5.
    Where we standtoday.. Amazon.com, Inc. is an internet-based company that offers books, music, videos, DVDs, electronics, software, toys, video games, electronic greeting cards, home improvements, online auctions, and a virtual mall called z-shops. Amazon has sites in France, Japan, Germany and the United Kingdom. Domestically, Amazon has experienced tremendous growth since its inception. However, that growth has not come without a cost. As the world economy worsens, Amazon faces pressure from stockholders as well as the entire financial community to realize a profit. Amazon has created a platform and customer base that many companies envy, but can they stay in business long enough to reach profitability.
  • 6.
    Price and Volume Informationfrom Amazon.com Recent Price $34.60 Trade Date 04/11/05 52-Week High $54.70 52-Week Low $32.82 Beta (5-Year) 2.37
  • 7.
    Stock Chart (May2003 – March 2005) Chart from Amazon.com
  • 8.
    Vision Statement (proposed) Tobe the largest mass online merchandiser on earth.
  • 9.
    Mission Statement Actual The companymotto: “Work Hard, Have Fun, and Make History.” The company’s six core values: customer obsession, ownership, bias for action, frugality, high hiring bar, and innovation.
  • 10.
    Proposed Our first responsibilityis to service our worldwide (1) online customers. (2) We pledge to make every effort to improve the level of customer service throughout the e-commerce industry by using up-to-date hardware and software (3) and by listening to our customers. We will offer customers increased product selections (4) to fulfill their online shopping desires. We strive to be the most used e-commerce portal on the World Wide Web (6), while conducting operations in a highly ethical (5) manner to ensure the long-term profitability and growth for shareholders.(7) We pledge to contribute to the economic strength of society and to function as an exceptional corporate citizen in all countries that we do business. (8) We vow to recruit, develop, motivate, reward and retain personnel of exceptional ability, character, and dedication. In return, we will provide them good working conditions, superior leadership, short and long term compensation, and an opportunity for individual growth and employment security.(9) 1. Market 2. Customer 3. Technology 4. Product or services 5. Philosophy 6. Self Concept 7. Concern for survival, growth, and profitability 8. Concern for public image 9. Concern for employees
  • 11.
    Business Segments •The NorthAmerica segment consists of amounts earned from retail sales through www.amazon.com and www.amazon.ca, Syndicated Stores and mail-order catalogs, Merchant.com, marketing, and promotional agreements. This segment has seen a growth in net sales from $2.382 billion in 2000 to $2.74 billion in 2002 •The International Segment consists of amounts earned from retail sales through www.amazon.co.uk, www.amazon.de, www.amazon.fr, and www.amazon.co.jp, Syndicated Stores, and international focused marketing and promotional agreements. This segment has seen a growth in net sales from $381million in 2000 to $1.17billion in 2002
  • 12.
    External Audit Threats • 1.Taxes imposed for EU customers • 2. Unemployment level highest sine 1994 • 3. Currency fluctuation • 4. Failure to permanently ban Internet taxes • 5. Aggressive competition • 6. Identity theft • 7. Terrorist attack, war • 8. State of the economy, high inflation • 9. Volatile stock market • 10. High interest rate • 11. Ease of entry into market Opportunities • 1. Pressure to permanently ban the Internet Tax • 2. State of the economy is improving • 3. Customer spending increased • 4. Currency fluctuation (weak dollar) • 5. Increased number of Internet users in the US • 6. Broadband access technology • 7. Increased number of Internet users worldwide • 8. Online sales predicted to increase • 9. Low interest rate • 10. One European currency - Euro
  • 13.
    Key External FactorsWeight Rating Weighted Score Opportunities 1. Pressure to permanently ban the Internet Tax 0.07 2 0.14 2. State of the economy is improving 0.08 3 0.24 3. Customer spending increased 0.05 3 0.15 4. Currency fluctuation (weak dollar) 0.05 3 0.15 5. Increased number of Internet users in the US 0.03 3 0.09 6. Broadband access technology 0.03 4 0.12 7. Increased number of Internet users worldwide 0.03 3 0.09 8. Online sales predicted to increase 0.05 4 0.20 9. Low interest rate 0.03 3 0.09 10. One European currency - Euro 0.03 3 0.09 Threats 1. Taxes imposed for EU customers 0.05 3 0.15 2. Unemployment level highest sine 1994 0.04 3 0.12 3. Currency fluctuation 0.04 3 0.12 4. Failure to permanently ban Internet taxes 0.06 2 0.12 5. Aggressive competition 0.07 4 0.28 6. Identity theft 0.05 4 0.20 7. Terrorist attack, war 0.02 2 0.04 8. State of the economy, high inflation 0.07 2 0.14 9. Volatile stock market 0.04 2 0.08 10. High interest rate 0.04 2 0.08 11. Ease of entry into market 0.01 2 0.02 Total 1.00 2.84
  • 14.
    Competitive Profile Matrix Amazon.COM Barnes & Nobles eBay Critical Success Factors Weight Rating Weighted Score Rating Weighted Score Rating Weighted Score Market Share Price Financial Position Product Quality Consumer Loyalty Global expansion Advertising Software technology Management e-commerce expertise 0.05 0.10 0.15 0.10 0.10 0.15 0.15 0.05 0.10 0.05 4 4 2 3 4 4 4 4 4 4 0.20 0.40 0.30 0.30 0.40 0.60 0.60 0.20 0.40 0.20 3 3 4 3 3 3 3 3 4 3 0.15 0.30 0.60 0.30 0.30 0.45 0.45 0.15 0.40 0.15 4 4 3 3 4 4 4 3 4 4 0.20 0.40 0.45 0.30 0.40 0.60 0.60 0.15 0.40 0.20 Total 1.00 3.60 3.25 3.70
  • 15.
    Weaknesses 1. Accumulated deficitof $3 billion 2. Operating losses 3. Interest payments on debt issued 4. High inventory risk - seasonality 5. Small number of vendors (suppliers) 6. Breach of customer confidential information InternalAudit Strengths 1. Strong management team 2. Strong customer service support 3. Up-to-date technology and software 4. High brand name recognition 5. Corporate culture 6. Distribution centers 7. Strategic alliances 8. Increased revenue from international segment 9. High inventory turnover
  • 16.
    Key Internal FactorsWeight Rating Weighted Score Strengths 1. Strong management team 0.10 4 0.40 2. Strong customer service support 0.07 4 0.28 3. Up-to-date technology and software 0.08 4 0.32 4. High brand name recognition 0.10 4 0.40 5. Corporate culture 0.07 3 0.21 6. Distribution centers 0.05 3 0.15 7. Strategic alliances 0.07 3 0.21 8. Increased revenue from international segment 0.03 3 0.09 9. High inventory turnover 0.03 3 0.09 Weaknesses 1. Accumulated deficit of $3 billion 0.10 1 0.10 2. Operating losses 0.05 1 0.05 3. Interest payments on debt issued 0.05 2 0.10 4. High inventory risk - seasonality 0.05 2 0.10 5. Small number of vendors (suppliers) 0.05 2 0.10 6. Breach of customer confidential information 0.10 2 0.20 TOTAL 1.00 2.80 IFE
  • 17.
    S-O Strategies Market penetration– increase marketing expenditures to 5% of net sales (O3, O5, O9, S4, S2, S9)Lobby to permanently ban Internet Tax (O1, O7, S1, S4) S-T Strategies Lobby to permanently ban Internet Tax ( T4, S1)Horizontal Diversification – create a Web search engine (T5, T11, S1, S2, S4). W-O Strategies Concentric Diversification – add new services/products to level seasonality- food & beverage (O1, O2, O5, O9, W4, W5) W-T Strategies Lower prices (T4, T5, T11, W4) SWOT MatrixSWOT Matrix
  • 18.
  • 19.
    Quadrant II QuadrantI Quadrant IV Grand Strategy Matrix Weak Competitive Position Strong Competitive Position Slow Market Growth Rapid Market Growth 1. Market Development 2. Market Penetration 3. Product Development 4. Forward/Backward/Horizontal Integration 5. Concentric Diversification
  • 20.
    BCG Matrix High +20 Med 0 Stars Domestic Question Marks International Low -20 CashCows Dogs High 1.0 Medium .50 Low 0.0 Relative Market Share Position Industry Sales Growth Rate
  • 21.
    1.0 to 1.99 IXVIIIVIILow 2.0 to 2.99 TheEFE Total Weighted Score VIVIVMedium DomesticInternational3.0 to 3.99 IIIIIIHigh 1.0 to 1.992.0 to 2.993.0 to 4.0 WeakAverageStrong The IFE Total Weighted Score Internal-External (IE) Matrix Hold and Maintain
  • 22.
    Matrix Analysis andSWOT Summary Alternative Strategies IE SPACE GRAND COUNT Forward Integration * * * 3 Backward Integration * * * 3 Horizontal Integration * * * 3 Market Penetration * * * 3 Market Development * * * 3 Product Development * * * 3 Concentric Diversification * * 2 Conglomerate Diversification * 1 Horizontal Diversification * 1 Joint Venture * 1 Retrenchment Divestiture Liquidation
  • 23.
    Financial Ratio Analysis(March 2004) Company Industry Sector S&P 500 Valuation Ratios P/E Ratio (TTM) 559.59 41.01 28.90 24.01 P/E High - Last 5 Yrs NA 45.19 48.47 45.41 P/E Low - Last 5 Yrs NA 15.69 16.09 16.26 Beta 2.23 1.30 0.96 1.00 Price to Sales (TTM) 3.16 5.40 2.80 3.33 Price to Cash Flow (TTM) 145.89 29.19 17.03 17.32 Price to Free Cash Flow (TTM) 48.12 43.57 33.11 28.97 % Owned Institutions 58.35 68.16 50.48 64.19
  • 24.
    Dividends Amazon SectorIndustry S&P 500 Dividend Yield N/A 1.17 2.14 2.04 Dividend Yield - 5 Yr Avg 0.00 0.22 1.43 1.48 Dividend 5 Yr Growth Rate NM 7.00 -0.89 6.48 Payout Ratio (TTM) 0.00 2.12 15.54 26.78 Growth Rates % Sales (MRQ) vs Qtr 1 Yr Ago 36.20 24.97 14.39 13.40 Sales - 5 Yr Growth Rate 53.89 35.47 17.25 9.30 EPS (MRQ) vs Qtr 1 Yr Ago 2357.14 27.30 15.43 28.69 EPS - 5 Yr Growth Rate NM 43.79 15.23 12.15 Capital Spending - 5 Yr Growth Rate 10.16 15.62 2.61 4.06 Financial Ratio Analysis (cont.)
  • 25.
    Financial Strength AmazonSector Industry S&P 500 Quick Ratio (MRQ) 1.11 1.22 0.93 1.26 Current Ratio (MRQ) 1.45 2.19 1.47 1.76 LT Debt to Equity (MRQ) N/A 0.66 0.74 0.68 Total Debt to Equity (MRQ) N/A 0.73 0.82 0.85 Interest Coverage (TTM) 2.08 16.81 7.84 11.86 Profitability Ratios % Gross Margin (TTM) 23.88 42.23 42.84 47.32 Gross Margin - 5 Yr Avg 23.23 41.08 42.06 47.01 EBITD Margin (TTM) 5.19 13.65 22.32 20.79 Financial Ratio Analysis (cont.)
  • 26.
    Amazon Industry SectorS&P 500 Operating Margin - 5 Yr Avg -14.93 6.75 11.21 18.35 Pre-Tax Margin (TTM) 0.68 11.64 10.37 17.27 Pre-Tax Margin - 5 Yr Avg -19.84 7.27 11.77 17.54 Net Profit Margin (TTM) 0.68 7.76 7.54 13.12 Net Profit Margin - 5 Yr Avg -19.84 3.74 7.62 11.59 Management Effectiveness % Return on Assets (TTM) 1.94 8.29 5.91 6.40 Return on Assets - 5 Yr Avg -24.73 4.45 5.49 6.79 Return on Investment (TTM) 3.89 11.53 7.98 9.97 Return on Investment - 5 Yr Avg -40.89 5.83 7.59 10.93 Return on Equity (TTM) N/A 14.04 13.51 18.71 Return on Equity - 5 Yr Avg N/A 13.84 13.18 19.22 Financial Ratio Analysis (cont.)
  • 27.
    Efficiency Amazon SectorIndustry S&P 500 Revenue/Employee (TTM) 674,833 393,35 1 479,338 622,866 Net Income/Employee (TTM) 4,579 29,688 90,606 81,707 Receivable Turnover (TTM) N/A 26.71 17.23 9.76 Inventory Turnover (TTM) 18.39 6.48 17.53 10.46 Asset Turnover (TTM 2.86 1.91 1.17 0.92 Financial Ratio Analysis (cont.)
  • 28.
    Financial Information  Amazon.comhad an increase in revenue of 2141.3 million from 2001 to 2003  In 2001 and 2003, Amazon.com’s net income was in the negative, but in 2003 they had a positive net income of $35.3 million  They have experienced a decrease in their total debt from 2001 to 2003 of $221.4 million
  • 29.
    Key External Factors Weight Createa web Search engine Start Gourmet food wholesaler Opportunities AS TAS AS TAS 1. Pressure to permanently ban the Internet Tax 0.07 1 0.07 1 0.07 2. State of the economy is improving 0.08 1 0.08 3 0.24 3. Customer spending increased 0.05 1 0.05 3 0.15 5. Increased number of Internet users in the US 0.03 3 0.09 4 0.12 6. Broadband access technology 0.03 4 0.12 3 0.09 8. Increased number of Internet users worldwide 0.03 3 0.09 4 0.12 9. Online sales predicted to increase 0.05 1 0.05 3 0.15 10. Low interest rate 0.03 1 0.03 2 0.06 Threats 2. Unemployment level highest since 1994 0.04 1 0.04 2 0.08 4. Failure to permanently ban Internet taxes 0.06 1 0.06 1 0.06 5. Aggressive competition 0.07 4 0.28 3 0.21 6. Identity theft 0.05 1 0.05 1 0.05 8. State of the economy, high inflation 0.07 1 0.07 2 0.14 11. Ease of entry into market 0.01 3 0.03 4 0.04 SUBTOTAL 1.11 1.58
  • 30.
    Key Internal Factors Weight Createa web search engine Start gourmet food wholesaler Strengths AS TAS AS TAS 1. Strong management team 0.10 2 0.20 4 0.40 2. Strong customer service support 0.07 1 0.07 4 0.28 3. Up-to-date technology and software 0.08 3 0.24 4 0.32 4. High brand name recognition 0.10 1 0.10 4 0.40 5. Corporate culture 0.07 1 0.07 3 0.21 Weaknesses 1. Accumulated deficit of $3 billion 0.10 1 0.10 2 0.20 2. Operating losses 0.05 2 0.10 1 0.05 SUBTOTAL 1.00 0.88 1.86 Total Attractiveness Score 1.81 3.26
  • 31.
    Strategy Recommendations and Implementation Marketpenetration – increase market share for present products in present markets through greater marketing efforts. Increase marketing expenses to 3% of net sales for the next three years compared to 2% in 2002.  Reasons – aggressive advertising from new competitors such as buy. COM, overstock. COM. Target the marketing campaign.  Costs associated with this strategy – increase in fulfillment costs and marketing costs. Fulfillment costs are 10% of net sales. For the period 2003 – 2005, these costs amount to $2,084,000,000. The 1% increase in marketing costs for the period 2003 -2005 amounts to $208,440,000.
  • 32.
    Strategy Recommendations and Implementation Concentricdiversification – add new but related products/services.  Example – start an online gourmet food and beverage store using a wholesaler such as Seattle Chocolate Co.  Reasons – take advantage of brand name recognition and customer loyalty.  Because this strategy does not involve any inventory build-up, costs associated are relatively low. Horizontal diversification – add new, unrelated products/services for present customers.  Example – develop a search engine to control the path to online merchants.  Risk – similar services are already available: Yahoo, Google.
  • 33.
    EPS/EBIT Analysis Recession NormalBoom Recession Normal Boom EBIT 500,000,0001,000,000,0001,500,000,000500,000,0001,000,000,0001,500,000,000 Interest 0 0 0 50,000,000 50,000,000 50,000,000 EBT 500,000,0001,000,000,0001,500,000,000450,000,000 950,000,0001,450,000,000 Taxes 0 0 0 0 0 0 EAT 500,000,0001,000,000,0001,500,000,000450,000,000 950,000,0001,450,000,000 #Shares440,631,579 440,631,579 440,631,579 388,000,000 388,000,000 388,000,000 EPS 1.13 2.27 3.40 1.16 2.45 3.74 CommonStockFinancing DebtFinancing Recession Normal Boom Recession Normal Boom EBIT500,000,0001,000,000,0001,500,000,000500,000,0001,000,000,0001,500,000,000 Interest 15,000,000 15,000,000 15,000,000 35,000,000 35,000,000 35,000,000 EBT 485,000,000985,000,0001,485,000,000465,000,000965,000,0001,465,000,000 Taxes 0 0 0 0 0 0 EAT 485,000,000985,000,0001,485,000,000465,000,000965,000,0001,465,000,000 #Shares424,842,105424,842,105 424,842,105403,789,474403,789,474 403,789,474 EPS 1.14 2.32 3.50 1.15 2.39 3.63 70PercentDebt-30PercentStock70PercentStock-30PercentDebt Amount Needed 1,000M Interest 5% Tax Rate 0% Share Price $19 Shares Outstanding 388M
  • 34.
    Net Worth Analysis 1.Stockholders’ Equity = $(1,355,900,000) 2. Net Income (12/31/2002) * 5 = $149,100,000 * 5 = $(745,500,000) 3. Share price / EPS * Net Income = $19/$(0.39)*$(149,100,000) = $(7,263,846,154) 4. Number of shares outstanding * Share price = 388,000,000*$19 = $7,372,000,000
  • 35.
    Goals and Objectives Forthe next 3-4 years, Amazon is hoping to have started their online gourmet food and beverage store. Also, Amazon want to increase their marketing expenses from 2% of net sales to 3%. This will give them more advertising and brand recognition. Amazon has recently launched their search engine called A9. Now they need to spend the next three year trying to get the name known and get in the competition with yahoo and google.
  • 36.
    2005 Press Releases Apr.04Amazon.com Acquires BookSurge LLC Mar.11 Amazon.com to Webcast Investor Conference Presentation Feb.15 Amazon.com Announces New Award for Innovative Nonprofit Organiza Feb.08 Amazon.com Jewelry Sales Up More Than 120 Percent Feb.02 Amazon.com Announces Record Free Cash Flow Fueled by Lower Prices Jan.21 Amazon Web Services Gives Software Developers First-Ever Access to Amazon.ca and Amazon.fr Jan.17 Amazon Services and Diane Von Furstenberg Studio Announce E-Comm Press releases form Amazon.com