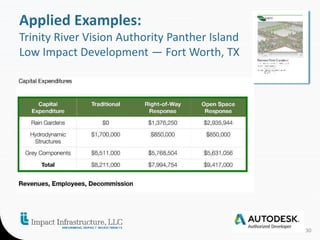
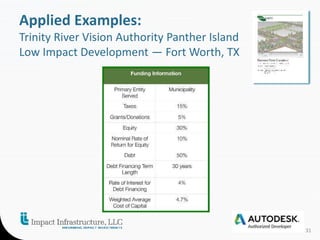
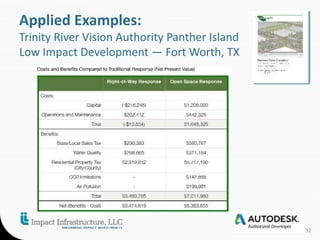
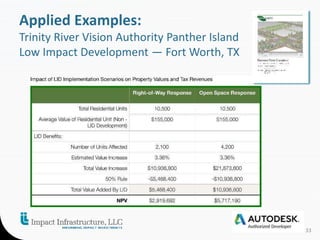
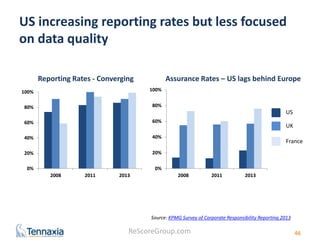
A New Generation of Practical Tools for Sustainability 
Professionals 
Daniel Aronson, Valutus @DanielAronson 
John Williams, Impact Infrastructure @ImpactNFSTR 
Emma Stewart, Autodesk 
Deborah Stern, 2020 Strategies 
Reed MacMillan, The Triana Group @MacMillianGroup
Man is a tool-using animal. Without 
tools he is nothing, with tools he is all. 
— Thomas Carlyle
The most satisfactory definition of 
man from the scientific point of view is 
probably Man the Tool-maker. 
― Kenneth Page Oakley
We become what we behold. We 
shape our tools, and thereafter our 
tools shape us. 
― Marshall McLuhan
The stone age was marked by man's 
clever use of crude tools; the 
information age, to date, has been 
marked by man's crude use of clever 
tools.
Men have become the tools of their 
tools. 
— Henry David Thoreau
One only needs two tools in life: WD- 
40 to make things go, and duct tape to 
make them stop.” 
— G. Weilacher
The expectations of life depend upon 
diligence; the mechanic that would 
perfect his work must first sharpen his 
tools. 
— Confucius
It doesn't work to urge people to think 
outside the box without giving them 
the tools to climb out. 
— Laurie Dunnavant
© 2013 
Autodesk 
1. The scientific 
consensus is 
unprecedented 
2. Current 
practice is ripe 
for disruption 
3. Regulatory 
expectations are 
generally 
increasing
C-FACT (both for Corporations & Cities) is free and available for download: 
www.autodesk.com/sustainabilitysolutions 
© 2013 
Autodesk
© 2013 
Autodesk 
6% 
0.006%
Workshop: 
A New Generation of Practical, Web-based Tools 
for Sustainability Professionals 
What About Infrastructure 
and Buildings? 
Speaker: John F. Williams, Chairman and CEO, 
Impact Infrastructure, Inc. 
John.williams@ImpactInfrastructure.com 
13
Introduction 
Infrastructure and 
Building Projects 
 Multi-Trillion Dollar Market 
 Source of Massive Costs and Benefits 
 Pivotal position in long term Financial, Sustainability, 
Resilience outcomes 
14
ABC Tells the Complete 
Value Story 
 Financial 
 Economic 
 Social 
 Environmental 
 Resiliency 
15
ABC is Offered by 
Impact Infrastructure and Autodesk 
Harvests Data from BIM allowing 
Economic Assessment 
 Calculates Financial and Sustainable Returns on Investment 
 Identifies Costs and Benefits by Stakeholder Group 
 Enables Project Sponsors and Financiers to use 
- a common standard 
- automation 
- planning and design professionals 
- addressing the cost, capacity and comparability 
due diligence challenges 
16
ABC Makes Business Case 
Analysis Practical 
 Reduces the Cost of Economic and Risk Analysis 
 Provides real time Assessment informing Planning 
and Design Decisions 
 Provides a means of Comparability between Projects 
 Informs project Prioritization, applications for Merit 
and Impact Capital funding 
17
Embraces the GOLD Standard 
for Project Valuation: 
CBA Building on Recent Progress 
 CBA under the Federal TIGER Grant (merit) Program 2008 
 SROI Framework introduced into the public domain 2009 
 Urban Sustainability Directors’ Network TBL Calculator 2010 
 ISI’s EnvisionTM Sustainable Rating System 2011 
18
Embraces the GOLD Standard 
for Project Analysis: 
BIM More Recently 
 Business Case Evaluator (BCE) for Envision v1.0 
- economics and risk assessment tool 
- released at Harvard’s Graduate School of Design 2013 
- V2.01 released in early 2014 
- free, public domain via ISI, spread sheet, manual, 
documentation 
 BCE focuses on specific Infrastructure and Building sectors 
 Stormwater Management, Transit, Highway and Bridges, Energy, 
other environmental and social infrastructure 2014 -2016 
19
This Fall: ABC Solution for 
Infrastructure and Buildings 
Automated Business Case Evaluator 
 Portfolio of Sector Specific Metrics and a Common Analytical Engine 
 Harvests: 
- planning 
- design 
- publicly sourced data 
 Captures 
- financial 
- economic 
- social 
- environmental 
- resilience costs and benefits 
 Real Time Assessment 
20
 Monte Carlo Simulations to Address Uncertainty and Risk 
 Multiple Beneficiary CBA account for the Winners and Losers 
 Project specific Value for Money 
 Enables Decisions for Optimal Outcomes 
 Answers the What’s in it for me? Question 
21 
ABC Addresses 
Uncertainty and Risk 
Focus on Stakeholder Interests
22 
Applied Examples: 
Tucson and Pima County, AZ 
Monte Carlo Simulation
23 
Applied Examples: 
Tucson and Pima County, AZ 
Xeriscape Swale
24 
Applied Examples: 
Tucson and Pima County, AZ
25 
Applied Examples: 
Tucson and Pima County, AZ
26 
Applied Examples: 
Tucson and Pima County, AZ
27 
Applied Examples: 
Tucson and Pima County, AZ
28 
Applied Examples: 
Trinity River Vision Authority Panther Island 
Low Impact Development — Fort Worth, TX 
Benefits Analyzed Include: 
1. Increased revenues, change in subsidies and avoided costs 
2. Shadow wage benefit 
3. Recreational use value 
4. Property value benefit 
5. Reduce heat stress mortality benefit 
6. Water quality and habitat enhancement 
7. Wetland enhancement 
8. Emissions
29 
Applied Examples: 
Trinity River Vision Authority Panther Island 
Low Impact Development — Fort Worth, TX
30 
Applied Examples: 
Trinity River Vision Authority Panther Island 
Low Impact Development — Fort Worth, TX
31 
Applied Examples: 
Trinity River Vision Authority Panther Island 
Low Impact Development — Fort Worth, TX
32 
Applied Examples: 
Trinity River Vision Authority Panther Island 
Low Impact Development — Fort Worth, TX
33 
Applied Examples: 
Trinity River Vision Authority Panther Island 
Low Impact Development — Fort Worth, TX
34 
Applied Examples: 
Trinity River Vision Authority Panther Island 
Low Impact Development — Fort Worth, TX
35 
The Ultimate Show and Tell
36 
150 km2 3D model of Manhattan – 
terrain, buildings, roads, waterways, 
transit etc. Time to build – 15 min.
37 
The Ultimate Show and Tell
Multiple account/stakeholder CBA
Conclusion: 
Reducing the 
Due Diligence Burden 
Ask for Comprehensive Business Cases 
Project Sponsors Will Provide Them 
39
Speaker: John F. Williams, Chairman and CEO, 
Impact Infrastructure, Inc. 
John.williams@ImpactInfrastructure.com 
40 
Workshop: 
A New Generation of Practical, Web-based Tools 
for Sustainability Professionals 
What About Infrastructure 
and Buildings?
41 
Sustainable Brands/MIT New Metrics ‘14 
Tools for Sustainability 
Management 
Deborah Stern 
Founder & CEO, 2020 Strategies LLC 
Senior Advisor, Tennaxia 
ReScore Group Team Leader 
2020 Strategies, LLC
Researching Corporate Responsibility 
Using Tools to Improve CSR Data Capture & Reporting, a 2014 
Market Research Study: 
1. Review of existing literature 
2. 57 interviews & surveys with CSR managers, stakeholders 
ReScoreGroup.com 
& experts 
3. Case Studies 
4. Benchmarking study of software platforms 
42 
Corporate Partners: Triana Group, 2020 Strategies, Tennaxia
The Big “Why” 
Metrics are essential to build a 
robust, coherent market for a 
sustainable world. 
ReScoreGroup.com 
43
The Drivers of CSR Reporting are Different in 
North America and Europe 
ReScoreGroup.com 
Stakeholders 
Regulation 
Voluntary 
• GRI 
• CDP 
• AccountAbility 
• DJSI 
• SASB 
• ISO 
Regulatory 
• Lisbon Strategy (2000-2010) 
• Europe 2020 (2010-2020) 
• EU Climate Action 
• European Commission 
adoption of The Directive 
(2014) 
44
Europe had more early reporters and higher 
reporting rates 
ReScoreGroup.com 
45
US increasing reporting rates but less focused 
on data quality 
Reporting Rates - Converging Assurance Rates – US lags behind Europe 
100% 
80% 
60% 
40% 
20% 
ReScoreGroup.com 
46 
US 
UK 
France 
Source: KPMG Survey of Corporate Responsibility Reporting 2013 
100% 
80% 
60% 
40% 
20% 
0% 
2008 2011 2013 
0% 
2008 2011 2013
Use of tools in the US 
ReScoreGroup.com 
47 
Organizational Size 
Small Mid-Cap Large-Cap 
Organizational commitment to CSR 
No System & 
No Tracking 
Software 
Solution 
(e.g. 
Tennaxia, 
Credit 360) 
Internally 
Customized 
Systems 
Software 
Solution 
(e.g. 
Tennaxia, 
Credit 360) 
(e.g. 
Oracle, 
SAP)
Companies are settling for inferior solutions to 
tracking and reporting sustainability data 
Features Excel 
ReScoreGroup.com 
Sustainability 
Software 
Solutions 
Cloud-based, multi-user interface 
Customized to track specific company KPIs and strategies 
Ability to attach supporting documents 
Ability to manage workflows (e.g. assign tasks, send reminders) 
Customized end user training 
Integration with other corporate systems 
System in place for validating data and flag data inconsistencies 
Easily export data into high level and auditable reports 
48
Tennaxia CSR Data Management Solution 
ReScoreGroup.com 
49
Data Management with Tennaxia 
3 - 40 days 7 days 18 days Ongoing 
ReScoreGroup.com 
50 
Collect Control Analyze & 
Produce 
Verify & 
Configure Report 
Understanding 
Clients’ Business 
& Objectives 
Constructing 
Platform 
Platform Setup & 
Training 
Operationalize 
Platform 
Fast Implementation and Delivery Process:
A few Key features of the Software tool 
ReScoreGroup.com 
51 
Fully Customizable 
Features 
Streamlined 
Documentation 
Management 
Data 
Verification
Case Study: Group GeoPost 
ReScoreGroup.com 
52 
Background: 
• Private Express Delivery: 24,000 employees providing express 
delivery of 814 million parcels annually between 230 countries 
• Manages 830 operational sites and uses 26,000 vehicles 
Business needs: 
• Integrate data into parent company (La Poste Group) CSR report 
• Pilot a new corporate-wide initiative to build environmental 
management ISO 14001 program, including measuring GHG 
Emission Reductions 
• Support External Communications, Compliance, Audit 
Before Tennaxia CSR Tool: 
• Costly: 2 weeks FTE min. collecting and verifying data 
• Stressful, time-consuming process 
• Challenging to assure data quality
Case Study: Group GeoPost 
After Tennaxia CSR Tool 
• Cost Savings: 5-10 minutes vs. 2 weeks every quarter 
• Efficiently avoid mistakes, gain peace of mind 
• More motivated data providers 
• Improved HQ – Subsidiary relationship 
• Allows for bigger picture to granular analysis 
• Measure and compensate for reduced GHG Emissions 
Overall Business Value: 
• A true tool: Liberates team for mission-critical work 
• Drives performance; Guides decisions 
• Mitigates reputational and operating risks – verified data 
• “It helped to have an IT tool designed by environmental experts, in 
contrast to just IT experts” 
ReScoreGroup.com 
53
ReScoreGroup.com 
What’s Possible 
• Our case studies have shown that implementing a 
CSR tool can have real value to companies 
• Also, good CSR tools drive the momentum of 
investment and action to achieve a sustainable world 
• Unfortunately, several gaps exist that are delaying 
adoption 
2020: 
Flourishing markets to achieve a sustainable world. 
54
ReScoreGroup.com 
Thank you 
For research project and more 
information on Tennaxia Solution: 
ReScoregroup.com 
Deborah Stern 
Rescore Group Team Leader 
2020 Strategies, LLC 
dstern@2020Strategies.net 
212-838-7678 
55
56 
Reporting 
CSR Solution
Tennaxia at a glance 
ReScoreGroup.com 
57 
European company founded in 2001 
Platform utilized at over 3,000 client sites 
Accessed in over 70 countries in multiple languages 
Compatible with CDP, GRI, ISO & other Reporting Frameworks 
Nearly 100% client retention rate
Flexible Integrated CSR Service Offering 
Strategic Consulting 
CSR Report Blueprint 
Planning, benchmarking & 
communication strategy 
Data Management 
ReScoreGroup.com 
58 
SaaS (Software as a Service) 
Customized Settings 
Deployment in partnership 
with client 
Training of key staff 
Monitoring & on-going support 
Materiality analysis, 
indicators & KPIs 
Ability to take on client data 
management
Data Management with Tennaxia 
ReScoreGroup.com 
59 
Collect Control Analyze & 
Produce 
Verify & 
Report 
•Transfer 
historic data 
•Assign users 
to collect data 
•Set up 
automatic 
data entry 
•Track progress 
•Validate data 
and flag 
inconsistencies 
•Management 
verification 
•Simple data 
export 
• Ability to 
visualize data 
•Multi-dimensional 
analysis 
•Audit ready 
•Reportable 
data for 
internal and 
external 
stakeholders 
•View project 
history 
Configure 
•Adapt 
software to 
processes and 
standards 
•Set indicators 
and scope 
•Workflow 
validation
Key features of the Software tool 
ReScoreGroup.com 
60 
Fully Customizable 
Features 
Streamlined 
Documentation 
Management 
Data 
Verification
Working Together: Our Business Process 
ReScoreGroup.com 
61 
Understanding 
Your Business & 
Objectives 
Constructing Platform 
Platform Setup & 
Training 
Operationalize 
Platform 
• Define stakeholders, 
issues & materiality 
• Select of indicators 
and KPIs 
• Define of controls, 
calculations, units, 
analysis and report 
formats 
• Define data sources, 
pathways and 
validation sources 
• Configure 
management system 
for data collection 
and reporting 
• Input historical data 
• Documentation and 
training 
• System testing and 
revisions 
• Maintenance and 
upgrades 
• Produce reports for 
external stakeholders 
and support audits 
• Ongoing support 
available 
3 - 40 days 7 days 18 days Ongoing
Client Testimonials 
Tennaxia has a high level of customer satisfaction and a 97 % retention rate 
ReScoreGroup.com 
62 
“Responded to our needs, deployed the tool with a very accurate 
timing. All goals of the project were achieved”. 
- Group SEB 
Small sample of other clients:
ReScoreGroup.com 
Contact 
Deborah E Stern 
Dstern@2020Strategies.net 
39 Broadway, New York NY 
Rescoregroup.com 
http://www.trianagroup.com 
63
www.SustainableBrands.com

A New Generation of Practical Web-based Tools for Sustainability Professionals

  • 1.
    A New Generationof Practical Tools for Sustainability Professionals Daniel Aronson, Valutus @DanielAronson John Williams, Impact Infrastructure @ImpactNFSTR Emma Stewart, Autodesk Deborah Stern, 2020 Strategies Reed MacMillan, The Triana Group @MacMillianGroup
  • 2.
    Man is atool-using animal. Without tools he is nothing, with tools he is all. — Thomas Carlyle
  • 3.
    The most satisfactorydefinition of man from the scientific point of view is probably Man the Tool-maker. ― Kenneth Page Oakley
  • 4.
    We become whatwe behold. We shape our tools, and thereafter our tools shape us. ― Marshall McLuhan
  • 5.
    The stone agewas marked by man's clever use of crude tools; the information age, to date, has been marked by man's crude use of clever tools.
  • 6.
    Men have becomethe tools of their tools. — Henry David Thoreau
  • 7.
    One only needstwo tools in life: WD- 40 to make things go, and duct tape to make them stop.” — G. Weilacher
  • 8.
    The expectations oflife depend upon diligence; the mechanic that would perfect his work must first sharpen his tools. — Confucius
  • 9.
    It doesn't workto urge people to think outside the box without giving them the tools to climb out. — Laurie Dunnavant
  • 10.
    © 2013 Autodesk 1. The scientific consensus is unprecedented 2. Current practice is ripe for disruption 3. Regulatory expectations are generally increasing
  • 11.
    C-FACT (both forCorporations & Cities) is free and available for download: www.autodesk.com/sustainabilitysolutions © 2013 Autodesk
  • 12.
    © 2013 Autodesk 6% 0.006%
  • 13.
    Workshop: A NewGeneration of Practical, Web-based Tools for Sustainability Professionals What About Infrastructure and Buildings? Speaker: John F. Williams, Chairman and CEO, Impact Infrastructure, Inc. John.williams@ImpactInfrastructure.com 13
  • 14.
    Introduction Infrastructure and Building Projects  Multi-Trillion Dollar Market  Source of Massive Costs and Benefits  Pivotal position in long term Financial, Sustainability, Resilience outcomes 14
  • 15.
    ABC Tells theComplete Value Story  Financial  Economic  Social  Environmental  Resiliency 15
  • 16.
    ABC is Offeredby Impact Infrastructure and Autodesk Harvests Data from BIM allowing Economic Assessment  Calculates Financial and Sustainable Returns on Investment  Identifies Costs and Benefits by Stakeholder Group  Enables Project Sponsors and Financiers to use - a common standard - automation - planning and design professionals - addressing the cost, capacity and comparability due diligence challenges 16
  • 17.
    ABC Makes BusinessCase Analysis Practical  Reduces the Cost of Economic and Risk Analysis  Provides real time Assessment informing Planning and Design Decisions  Provides a means of Comparability between Projects  Informs project Prioritization, applications for Merit and Impact Capital funding 17
  • 18.
    Embraces the GOLDStandard for Project Valuation: CBA Building on Recent Progress  CBA under the Federal TIGER Grant (merit) Program 2008  SROI Framework introduced into the public domain 2009  Urban Sustainability Directors’ Network TBL Calculator 2010  ISI’s EnvisionTM Sustainable Rating System 2011 18
  • 19.
    Embraces the GOLDStandard for Project Analysis: BIM More Recently  Business Case Evaluator (BCE) for Envision v1.0 - economics and risk assessment tool - released at Harvard’s Graduate School of Design 2013 - V2.01 released in early 2014 - free, public domain via ISI, spread sheet, manual, documentation  BCE focuses on specific Infrastructure and Building sectors  Stormwater Management, Transit, Highway and Bridges, Energy, other environmental and social infrastructure 2014 -2016 19
  • 20.
    This Fall: ABCSolution for Infrastructure and Buildings Automated Business Case Evaluator  Portfolio of Sector Specific Metrics and a Common Analytical Engine  Harvests: - planning - design - publicly sourced data  Captures - financial - economic - social - environmental - resilience costs and benefits  Real Time Assessment 20
  • 21.
     Monte CarloSimulations to Address Uncertainty and Risk  Multiple Beneficiary CBA account for the Winners and Losers  Project specific Value for Money  Enables Decisions for Optimal Outcomes  Answers the What’s in it for me? Question 21 ABC Addresses Uncertainty and Risk Focus on Stakeholder Interests
  • 22.
    22 Applied Examples: Tucson and Pima County, AZ Monte Carlo Simulation
  • 23.
    23 Applied Examples: Tucson and Pima County, AZ Xeriscape Swale
  • 24.
    24 Applied Examples: Tucson and Pima County, AZ
  • 25.
    25 Applied Examples: Tucson and Pima County, AZ
  • 26.
    26 Applied Examples: Tucson and Pima County, AZ
  • 27.
    27 Applied Examples: Tucson and Pima County, AZ
  • 28.
    28 Applied Examples: Trinity River Vision Authority Panther Island Low Impact Development — Fort Worth, TX Benefits Analyzed Include: 1. Increased revenues, change in subsidies and avoided costs 2. Shadow wage benefit 3. Recreational use value 4. Property value benefit 5. Reduce heat stress mortality benefit 6. Water quality and habitat enhancement 7. Wetland enhancement 8. Emissions
  • 29.
    29 Applied Examples: Trinity River Vision Authority Panther Island Low Impact Development — Fort Worth, TX
  • 30.
    30 Applied Examples: Trinity River Vision Authority Panther Island Low Impact Development — Fort Worth, TX
  • 31.
    31 Applied Examples: Trinity River Vision Authority Panther Island Low Impact Development — Fort Worth, TX
  • 32.
    32 Applied Examples: Trinity River Vision Authority Panther Island Low Impact Development — Fort Worth, TX
  • 33.
    33 Applied Examples: Trinity River Vision Authority Panther Island Low Impact Development — Fort Worth, TX
  • 34.
    34 Applied Examples: Trinity River Vision Authority Panther Island Low Impact Development — Fort Worth, TX
  • 35.
    35 The UltimateShow and Tell
  • 36.
    36 150 km23D model of Manhattan – terrain, buildings, roads, waterways, transit etc. Time to build – 15 min.
  • 37.
    37 The UltimateShow and Tell
  • 38.
  • 39.
    Conclusion: Reducing the Due Diligence Burden Ask for Comprehensive Business Cases Project Sponsors Will Provide Them 39
  • 40.
    Speaker: John F.Williams, Chairman and CEO, Impact Infrastructure, Inc. John.williams@ImpactInfrastructure.com 40 Workshop: A New Generation of Practical, Web-based Tools for Sustainability Professionals What About Infrastructure and Buildings?
  • 41.
    41 Sustainable Brands/MITNew Metrics ‘14 Tools for Sustainability Management Deborah Stern Founder & CEO, 2020 Strategies LLC Senior Advisor, Tennaxia ReScore Group Team Leader 2020 Strategies, LLC
  • 42.
    Researching Corporate Responsibility Using Tools to Improve CSR Data Capture & Reporting, a 2014 Market Research Study: 1. Review of existing literature 2. 57 interviews & surveys with CSR managers, stakeholders ReScoreGroup.com & experts 3. Case Studies 4. Benchmarking study of software platforms 42 Corporate Partners: Triana Group, 2020 Strategies, Tennaxia
  • 43.
    The Big “Why” Metrics are essential to build a robust, coherent market for a sustainable world. ReScoreGroup.com 43
  • 44.
    The Drivers ofCSR Reporting are Different in North America and Europe ReScoreGroup.com Stakeholders Regulation Voluntary • GRI • CDP • AccountAbility • DJSI • SASB • ISO Regulatory • Lisbon Strategy (2000-2010) • Europe 2020 (2010-2020) • EU Climate Action • European Commission adoption of The Directive (2014) 44
  • 45.
    Europe had moreearly reporters and higher reporting rates ReScoreGroup.com 45
  • 46.
    US increasing reportingrates but less focused on data quality Reporting Rates - Converging Assurance Rates – US lags behind Europe 100% 80% 60% 40% 20% ReScoreGroup.com 46 US UK France Source: KPMG Survey of Corporate Responsibility Reporting 2013 100% 80% 60% 40% 20% 0% 2008 2011 2013 0% 2008 2011 2013
  • 47.
    Use of toolsin the US ReScoreGroup.com 47 Organizational Size Small Mid-Cap Large-Cap Organizational commitment to CSR No System & No Tracking Software Solution (e.g. Tennaxia, Credit 360) Internally Customized Systems Software Solution (e.g. Tennaxia, Credit 360) (e.g. Oracle, SAP)
  • 48.
    Companies are settlingfor inferior solutions to tracking and reporting sustainability data Features Excel ReScoreGroup.com Sustainability Software Solutions Cloud-based, multi-user interface Customized to track specific company KPIs and strategies Ability to attach supporting documents Ability to manage workflows (e.g. assign tasks, send reminders) Customized end user training Integration with other corporate systems System in place for validating data and flag data inconsistencies Easily export data into high level and auditable reports 48
  • 49.
    Tennaxia CSR DataManagement Solution ReScoreGroup.com 49
  • 50.
    Data Management withTennaxia 3 - 40 days 7 days 18 days Ongoing ReScoreGroup.com 50 Collect Control Analyze & Produce Verify & Configure Report Understanding Clients’ Business & Objectives Constructing Platform Platform Setup & Training Operationalize Platform Fast Implementation and Delivery Process:
  • 51.
    A few Keyfeatures of the Software tool ReScoreGroup.com 51 Fully Customizable Features Streamlined Documentation Management Data Verification
  • 52.
    Case Study: GroupGeoPost ReScoreGroup.com 52 Background: • Private Express Delivery: 24,000 employees providing express delivery of 814 million parcels annually between 230 countries • Manages 830 operational sites and uses 26,000 vehicles Business needs: • Integrate data into parent company (La Poste Group) CSR report • Pilot a new corporate-wide initiative to build environmental management ISO 14001 program, including measuring GHG Emission Reductions • Support External Communications, Compliance, Audit Before Tennaxia CSR Tool: • Costly: 2 weeks FTE min. collecting and verifying data • Stressful, time-consuming process • Challenging to assure data quality
  • 53.
    Case Study: GroupGeoPost After Tennaxia CSR Tool • Cost Savings: 5-10 minutes vs. 2 weeks every quarter • Efficiently avoid mistakes, gain peace of mind • More motivated data providers • Improved HQ – Subsidiary relationship • Allows for bigger picture to granular analysis • Measure and compensate for reduced GHG Emissions Overall Business Value: • A true tool: Liberates team for mission-critical work • Drives performance; Guides decisions • Mitigates reputational and operating risks – verified data • “It helped to have an IT tool designed by environmental experts, in contrast to just IT experts” ReScoreGroup.com 53
  • 54.
    ReScoreGroup.com What’s Possible • Our case studies have shown that implementing a CSR tool can have real value to companies • Also, good CSR tools drive the momentum of investment and action to achieve a sustainable world • Unfortunately, several gaps exist that are delaying adoption 2020: Flourishing markets to achieve a sustainable world. 54
  • 55.
    ReScoreGroup.com Thank you For research project and more information on Tennaxia Solution: ReScoregroup.com Deborah Stern Rescore Group Team Leader 2020 Strategies, LLC dstern@2020Strategies.net 212-838-7678 55
  • 56.
  • 57.
    Tennaxia at aglance ReScoreGroup.com 57 European company founded in 2001 Platform utilized at over 3,000 client sites Accessed in over 70 countries in multiple languages Compatible with CDP, GRI, ISO & other Reporting Frameworks Nearly 100% client retention rate
  • 58.
    Flexible Integrated CSRService Offering Strategic Consulting CSR Report Blueprint Planning, benchmarking & communication strategy Data Management ReScoreGroup.com 58 SaaS (Software as a Service) Customized Settings Deployment in partnership with client Training of key staff Monitoring & on-going support Materiality analysis, indicators & KPIs Ability to take on client data management
  • 59.
    Data Management withTennaxia ReScoreGroup.com 59 Collect Control Analyze & Produce Verify & Report •Transfer historic data •Assign users to collect data •Set up automatic data entry •Track progress •Validate data and flag inconsistencies •Management verification •Simple data export • Ability to visualize data •Multi-dimensional analysis •Audit ready •Reportable data for internal and external stakeholders •View project history Configure •Adapt software to processes and standards •Set indicators and scope •Workflow validation
  • 60.
    Key features ofthe Software tool ReScoreGroup.com 60 Fully Customizable Features Streamlined Documentation Management Data Verification
  • 61.
    Working Together: OurBusiness Process ReScoreGroup.com 61 Understanding Your Business & Objectives Constructing Platform Platform Setup & Training Operationalize Platform • Define stakeholders, issues & materiality • Select of indicators and KPIs • Define of controls, calculations, units, analysis and report formats • Define data sources, pathways and validation sources • Configure management system for data collection and reporting • Input historical data • Documentation and training • System testing and revisions • Maintenance and upgrades • Produce reports for external stakeholders and support audits • Ongoing support available 3 - 40 days 7 days 18 days Ongoing
  • 62.
    Client Testimonials Tennaxiahas a high level of customer satisfaction and a 97 % retention rate ReScoreGroup.com 62 “Responded to our needs, deployed the tool with a very accurate timing. All goals of the project were achieved”. - Group SEB Small sample of other clients:
  • 63.
    ReScoreGroup.com Contact DeborahE Stern Dstern@2020Strategies.net 39 Broadway, New York NY Rescoregroup.com http://www.trianagroup.com 63
  • 64.

Editor's Notes

  • #2 Wed Sept 24 W20-407 9:00-12:00
  • #11  1. The scientific consensus was unprecedented The level of consensus on climate change was the highest I’d seen on any topic among the scientific community. And the guidance from the Intergovernmental Panel on Climate Change on the necessary responses was unusually clear: An average global warming of 2°C is generally taken as the ‘tipping point’ beyond which there is a real risk of long-term irreversible climate change. To have a 50/50 chance of only a 2ºC Rise, CO2 concentration must be held at 450ppm 2. Current practice was ripe for disruption For all the marketing language about corporate leadership on climate change, anyone with a discerning eye could see that most companies were setting their targets based on what looked good on a press release or what was already budgeted. We suspected they were nowhere near the magnitude required. Indeed, the CDP’s “Carbon Chasm” report came out right around this time and analyzed the GHG targets of the Global 100. They found that, even when including companies currently lacking targets, at the current rate, the reductions necessary to stabilize the climate would be achieved 39 years too late to stabilize the climate. 3. Regulatory expectations were generally increasing, both for us and our customers Historically, global policies haven’t been in the right ballpark. As Climate Wedge pointed out back in 2005, even the Kyoto Protocol, the only demonstrable global agreement to reduce emissions, if it were extended to the year 2025, which hasn’t happened, would only cover 1/30th of the reductions needed by 2050. However, while it’s been slow and painfully incremental, the regulatory expectations on business with respect to climate change have increased in the aggregate. Where political momentum may be lacking at the international and national levels, sub-national governments are stepping into the void. These regulations were hitting our customers – those who design, own, and operate the built environment and industrial sectors – well before they hit a small footprint software company, so finding a novel way to set a science-based, yet business-friendly target, could help catapault our Salesforce into deeper and more strategic relationships with our customers.
  • #12 When I joined Autodesk in 2009, the initial GHG footprint had already been done by a contractor, but it needed work and no target was in place. With the help of a contractor fresh out of college, we overhauled the data collection system (which was currently essentially just emails and a spreadsheet), implemented an Enterprise Carbon Accounting software platform, and expanded the boundaries of the footprint to include all indirect emissions. With the house in order, we were now ready to set a target. I had just hired an incredibly talented fellow named Aniruddha Deodhar – who is still a key member our team. At the time, he was new to sustainability but very experienced in financial modeling as well as software development – our core business, so he and I started interviewing other companies about their experiences in goal-setting. We found that the majority of Fortune100 and half the Fortune 500, including many of our major customers like GE, Boeing, Caterpillar, and Ford, had already set GHG targets of some kind. However, a majority of our competitors had yet to publish targets. Thus, there was a strong argument for taking something ground-breaking to our CEO to help differentiate us. CLICK: We also concluded from our research that most targets were: Grounded in little more than ”guesstimates” of what looks good for marketing purposes or what seems reasonably easy to achieve in terms of sustainability investments. Despite the long-term nature of the climate challenge, 84% of the Global100’s targets were short-term (i.e. 2-3 years out). Some, like Dell, had extremely aggressive short-term targets that far exceeded what our method would derive, but there was no guarantee they would stay on that trajectory when they renewed their goals. We could only find a handful of European companies (France Telecom, Tesco, and Vodafone) with 2020 targets. Incomparable because they differ in what triggers a redrawing of the carbon footprint baseline (for example, acquisition or divestiture of a threshold size, consolidation of facilities), making it impossible to compare performance even across those companies with similar targets. Absolute targets were most meaningful climatically, easily communicated, and potentially a future requirement under new regulation. But they are inflexible and difficult to achieve in a high-growth economy. In contrast, intensity targets tend to be optically pleasing because they’re larger than absolute goals, and perhaps because of this, were becoming more and more popular. But we concluded they were being crafted poorly, with some even masking an actual increase in absolute emissions. From a prior project, I was familiar with the work at BT by Chris Tuppen and Kevin Moss with help from Professor Jorgen Randers of the Norwegian Business School on what they called a Climate Stabilization Index – which introduced the idea that corporate carbon emissions should be set relative to economic value-add -- and wondered if Autodesk could turn such a concept into a generalizable methodology that used only publicly available information and was applicable to all of the private sector – no matter what sector or geography. The real modeling would never have happened without the incredible talent Aniruddha, who was wonderfully adept at continually challenging us with questions like “how do we deal with the fact that companies have different baseline years?”, “is Gross Profit really the best proxy for a company’s value add?” and so on. I asked our consultants at Clear Carbon Consulting – who were acquired by Deloitte around that same time -- to act as a sounding board and foil – which was key – but also helped with selling C-FACT internally because Deloitte is a trusted name in corporate accounting. We wanted ADSK – and its corporate sector peers -- to reduce GHGs in line with scientific and policy climate stabilization targets (85 percent reduction by 2050 from current levels) but do so proportional to their relative contribution to global GDP - not more, not less CLICK: We had 3 key principles the method needed to abide by: Fairness: Acknowledges that corporate commitments should be proportional to their contribution to GDP and not to the corporations’ existing size and footprint. It is nondiscriminatory to companies of varying sizes, GHG footprints, and growth prospects. Verifiability: Uses generally accepted corporate financial principles, agreed upon methods of carbon measurement, enabling 100 percent verifiability of methodology and progress. Flexibility: Adapts to inaccurate financial forecasts, economic uncertainty, organic and inorganic changes in business, and inevitable deviations of real performance versus intended target. I won’t go into detail here because in the spirit of encouraging others to consider using it, we went to great lengths to create a 6-min video tutorial, white paper, and FAQ at our website, which I’ll provide in a moment. CLICK: In essence, it boils down to 4 steps.   Calculate: Calculate your base year GHG footprint, which for Autodesk was 83,000 MT. Define your company’s contribution to GDP, which is certainly not perfect but is the best universally available way to represnet a company’s value to its economy. Do this using Gross Profit, your revenue minus the Cost of Goods Sold. For Autodesk, this was $2.1B for our baseline year. Forecast growth using a combination of publicly available analyst research for the short-term and steady state assumptions for the long term. Divide the base year GHG footprint by contribution to GDP to calculate the Carbon Intensity Ratio Use the IPCC’s recommended reduction for the year 2050 (if you operate primarily in industrialized countries, this is an 85% absolute reduction by 2050) to back-calculate your company’s trajectory. In the spreadsheet we made open source, we tried to make this easy by using the Excel function “Goal seek”. Commit: Choose a target year that balances the long-term nature of climate change, common policy milestones in years like 2020, and the periodicity of your company’s strategic planning process. Annualize: Annualize the reduction goals over your timeframe through 2050, and ideally commit to reporting these derived annual targets, as well as how you performed against them, at the end of each fiscal year. Adjust: At year end, update the projection model with the latest available information your new carbon footprint and see if you’ve overshot or undershot your annualized target. Diffuse any error over a 5-year sliding window (shown here as a gray band), which aligns with common budgeting practices in corporate finance and grants you flexibility in meeting short-term targets but prevents procrastination beyond 5 years. Also update your predicted gross profit projections so as to refine your annualized target for next year. Because C-FACT is based not only on corporate accounting principles but also in macroeconomics, we know that if every private sector company were to adopt C-FACT, private sector emissions would be on track to help stabilize the climate by 2050.  
  • #13 In a recent slog through the Fortune500’s 2,000 sustainability goals, Winston Eco Strategies’ PivotGoals Initiative found that only: CLICK: 6% of these goals were equivalent to that recommended by science CLICK: and 0.006% were explicitly linked to science. CLICK: We predict this will change, as two of the top standard-setting organizations in the environmental field, WRI and CDP, have joined forces with WWF and GRI to issue guidance on science-based carbon targets. And we hope you will join at the front of the pack.
  • #44 Metrics are essential for building a robust and coherent market that can deliver a sustainable world. In order to employ metrics pervasively we need good tools – they enable accelerated adoption The better the tools the more companies will adopt data collection practice, the faster the market will accelerate to a sustainable world
  • #45 CSR reporting in Europe is a lot more developed and regulated. Companies have been well ahead on reporting for over 10 years now following the different strategies (see details below). In the US, regulations do not exist for mandatory reporting. Companies that voluntarily report are stakeholder driven, and are reporting mostly with international standards such as the GRI, CDP, UNGC, etc. Lisbon Strategy – a ten year action and development plan devised in 2000 to be adopted for a ten year period between 2000 to 2010. The Lisbon Strategy was heavily based on economic concepts to “make Europe, by 2010, the most competitive and the most dynamic knowledge-based economy in the world. The main fields included economic, social, and environmental renewal and sustainability Europe 2020 – 10 year strategy plan proposed by the European Commission that follows the Lisbon Strategy for the period 2000-2010. The strategy identified five main targets for the EU to boost growth and employment: - To raise the employment rate of the population aged 20–64 from the current 69% to at least 75%. - To achieve the target of investing 3% of GDP in R&D in particular by improving the conditions for R&D investment by the private sector, and develop a new indicator to track innovation. - To reduce greenhouse gas emissions by at least 20% compared to 1990 levels or by 30% if the conditions are right, increase the share of renewable energy in final energy consumption to 20%, and achieve a 20% increase in energy efficiency. - To reduce the share of early school leavers to 10% from the current 15% and increase the share of the population aged 30–34 having completed tertiary from 31% to at least 40%. To reduce the number of Europeans living below national poverty lines by 25%, lifting 20 million people out of poverty. EU Action on Climate – policy developed for adaptation strategies to help strengthen Europe’s resilience to the inevitable impacts of climate change. Targets up to 2050. Directive on disclosure of non-financial and diversity information by large companies and groups – adopted by the European Parliament on April 15, 2014. Large public-interest entities with more than 500 employees will now be required to disclose certain non-financial information in their management report.
  • #46 …by a long shot….
  • #47 Reporting is becoming more prolific. But in US, quality of data is still voluntary and questionable. Market is not yet at the tipping point from the standard objective being=report something, to standard objective=report quality data [for benefit of company performance & building robust market for sustainability]. It is surprising that so many companies are settling for inferior such as Excel when there are many high performing systems out there
  • #48 …But in the US….still over-reliant on weak tools such as excel instead of investing in valuable solutions
  • #49 Sustainability Software Solutions, such as Credit360, Enablon and Tennaxia Another point is that even though Excel appears to be the “free” option it is more costly in cumulative administrative time and inaccuracy in data entry --Now I want to look at a tool, specifically, that addresses the need to not only disclose but collect, report and manage based on quality csr/sustainability data
  • #50 Tennaxia:Tennaxia provides customized cloud-based software and services to help companies manage EHS Compliance and Sustainability Data. Over 5,000 locations in 70 countries rely on Tennaxia to streamline business processes, reducing costs and risks. Configurable to any framework or KPI, Tennaxia’s turnkey solution achieves nearly 100% client retention. Users connect from anywhere, multi-users at a time Real-time data validation Allows users to add attachments to support data Managers are able to review and verify data Ability to export into multiple reporting formats Software supports multiple languages Software can integrate earlier company data Platform highly customizable to meet any specific needs
  • #51 This graph gives an overview of the implementation process for Tennaxia Fast implementation (faster than most competitors in the EU)
  • #52 Here is a view at the Tennaxia software platform.
  • #53 Costly: collecting and verifying data Due to highly complex, multiple spreadsheets, challenge in verifying data – results in stressful time-consuming work flow
  • #54 Cost Savings: Software + Consulting solution – strategic advice without “nickel and diming” Reporting is not a pain with less resistance, and actually motivated because contributors see that data is being used Better internal communication and transparency Adopted by additional departments- PR/Auditors/Finance Credibility: Proves that their operations are properly managed We have a true tool! It liberates our time and mindshare, gives us valuable information, allows us to deliver value. We can now focus on the “real work” of reducing our footprint and operating a responsible, high-performing business to benefit our customers, shareholders, and all stakeholders Additional Benefits: Guide strategic investment decisions
  • #55 Not only good for the company because they are reporting but because it is delivering management People have the perspective that reporting is just a headache, too cumbersome, too complicated and an unproductive task that has to be done without having business value. But actually we now have enough evidence that tracking and report is value add for running effective, efficient business. Allows your company to manage multiple data points and work towards goals Gaps: --data acquisition, hard to collect data from individuals, lack of buy-in from management (Megan Farrell) There is usually push back – facility managers tend to get defensive, think tracking will affect their job etc. It really comes down to successful change management. Need to communicate and help people understand how tracking rolls up into larger reporting. (might be a good point in talking about the benefits of consulting service) --between the available tools and their perceived value --The need for the tools and their adoption --Awareness of the existing tools available – this is lay-up for Daniel’s Tool-Marketplace (AppStore)
  • #57 https://www.flickr.com/photos/marfis75/3346889975/in/pool-creative_commons-_free_pictures