A Hybrid Method for Pothole Depth Estimation ppt-6-2.pptx
1.
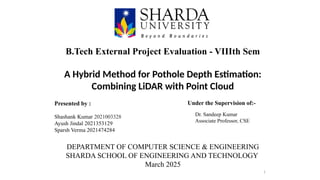
B.Tech External ProjectEvaluation - VIIIth Sem
A Hybrid Method for Pothole Depth Estimation:
Combining LiDAR with Point Cloud
DEPARTMENT OF COMPUTER SCIENCE & ENGINEERING
SHARDA SCHOOL OF ENGINEERING AND TECHNOLOGY
March 2025
Presented by :
Shashank Kumar 2021003328
Ayush Jindal 2021353129
Sparsh Verma 2021474284
Under the Supervision of:-
Dr. Sandeep Kumar
Associate Professor, CSE
1
2.
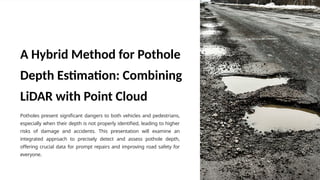
A Hybrid Methodfor Pothole
Depth Estimation: Combining
LiDAR with Point Cloud
Potholes present significant dangers to both vehicles and pedestrians,
especially when their depth is not properly identified, leading to higher
risks of damage and accidents. This presentation will examine an
integrated approach to precisely detect and assess pothole depth,
offering crucial data for prompt repairs and improving road safety for
everyone.
3.
Problem Statement
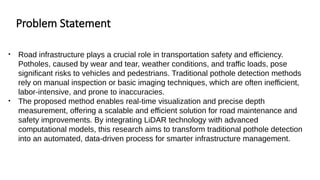
• Roadinfrastructure plays a crucial role in transportation safety and efficiency.
Potholes, caused by wear and tear, weather conditions, and traffic loads, pose
significant risks to vehicles and pedestrians. Traditional pothole detection methods
rely on manual inspection or basic imaging techniques, which are often inefficient,
labor-intensive, and prone to inaccuracies.
• The proposed method enables real-time visualization and precise depth
measurement, offering a scalable and efficient solution for road maintenance and
safety improvements. By integrating LiDAR technology with advanced
computational models, this research aims to transform traditional pothole detection
into an automated, data-driven process for smarter infrastructure management.
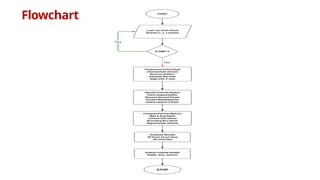
4.
Introduction
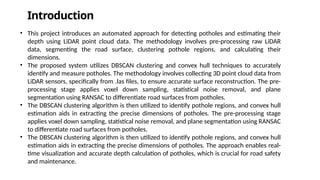
• This projectintroduces an automated approach for detecting potholes and estimating their
depth using LiDAR point cloud data. The methodology involves pre-processing raw LiDAR
data, segmenting the road surface, clustering pothole regions, and calculating their
dimensions.
• The proposed system utilizes DBSCAN clustering and convex hull techniques to accurately
identify and measure potholes. The methodology involves collecting 3D point cloud data from
LiDAR sensors, specifically from .las files, to ensure accurate surface reconstruction. The pre-
processing stage applies voxel down sampling, statistical noise removal, and plane
segmentation using RANSAC to differentiate road surfaces from potholes.
• The DBSCAN clustering algorithm is then utilized to identify pothole regions, and convex hull
estimation aids in extracting the precise dimensions of potholes. The pre-processing stage
applies voxel down sampling, statistical noise removal, and plane segmentation using RANSAC
to differentiate road surfaces from potholes.
• The DBSCAN clustering algorithm is then utilized to identify pothole regions, and convex hull
estimation aids in extracting the precise dimensions of potholes. The approach enables real-
time visualization and accurate depth calculation of potholes, which is crucial for road safety
and maintenance.
5.
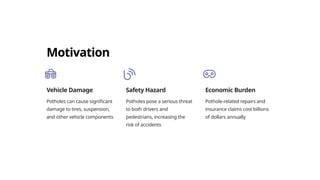
Motivation
Vehicle Damage
Potholes cancause significant
damage to tires, suspension,
and other vehicle components
Safety Hazard
Potholes pose a serious threat
to both drivers and
pedestrians, increasing the
risk of accidents
Economic Burden
Pothole-related repairs and
insurance claims cost billions
of dollars annually
6.
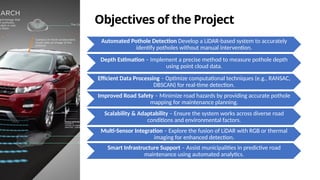
Objectives of theProject
Automated Pothole Detection Develop a LiDAR-based system to accurately
identify potholes without manual intervention.
Depth Estimation – Implement a precise method to measure pothole depth
using point cloud data.
Efficient Data Processing – Optimize computational techniques (e.g., RANSAC,
DBSCAN) for real-time detection.
Improved Road Safety – Minimize road hazards by providing accurate pothole
mapping for maintenance planning.
Scalability & Adaptability – Ensure the system works across diverse road
conditions and environmental factors.
Multi-Sensor Integration – Explore the fusion of LiDAR with RGB or thermal
imaging for enhanced detection.
Smart Infrastructure Support – Assist municipalities in predictive road
maintenance using automated analytics.
7.
Literature Survey
S.N
o.
Name ofPaper Ye ar Author Objectives Algorithms Advantages Limitations Outcome
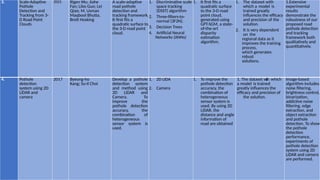
1. Road pothole
extraction and
safety evaluation by
integration of point
cloud and images
derived from
mobile mapping
sensors
2019 Hangbin Wu, Lianbi Yao,
Zeran Xu , Yayun Li, Xinra
n Ao, Qichao Chen, Zhen
gning Li, Bin Meng
Road pothole
detection and safety
evaluation by mobile
sensors.
1. Mobile laser
scanning (MLS)
2. Computer Vision
3. Naïve Bayes
algorithm
4. Deep neural
network
1. Computer vision
technologies based on
low-cost, high-quality,
and easy-to-use digital
camera.
2. The outcome s
make room for further
research and
the develop ment
of new approach es.
1. The most recent dataset
was not available which
could have resulted in
better accuracy than
achieved.
A new algorithm
that integrates the
mobile point cloud
and images is
proposed for the
detection of road
potholes. The
algorithm includes
three steps: 2D
candidate pothole
extraction from the
images using a deep
learning method, 3D
candidate pothole
extraction via a
point cloud, and
pothole
determination by
depth analysis.
2. A pothole detection
method based on
3D point cloud
segmentation
2020 Ying Du, Zuofeng
Zhou, Qingquan,
Wu, Huimin
Huang, Mingming
Xu, Jianzhong
Cao, Guoliang Hu
Proposed a simple and
effective pothole
detection method
based on 3D point
cloud segmentation.
Using binocular stereo
vision to acquire 3D
point clouds, fitting
the pavement plane
and then eliminating it
from the 3D point
clouds of road scene,
we could roughly
extract the pothole.
1. K-means
clustering and
region growing
algorithms were
adopted to
extract the
potholes
precisely
1. Accurately detecting
these potholes is vital for
assessing the degree of
pavement distress and
developing road
maintenance plan
accordingly.
2. Good segmentation effect
on scenes involving plane
and target object.
The most recent dataset was
not available which could
have resulted in better
accuracy than achieved.
K-means clustering
and region growing
algorithms were
adopted to extract
the potholes
precisely. The
experimental results
demonstrate that
our proposed
method has a very
good segmentation
effect on scenes
involving plane and
target object.
8.
3. Scale-Adaptive
Pothole
Detection and
Trackingfrom 3-
D Road Point
Clouds
2021 Rigen Wu; Jiahe
Fan; Libo Guo; Lei
Qiao; M. Usman
Maqbool Bhutta,
Brett Hosking
A scale-adaptive
road pothole
detection and
tracking framework.
It first fits a
quadratic surface to
the 3-D road point
cloud.
1. Discriminative scale
space tracking
(DSST) algorithm
2. Three-filters-to-
normal (3F2N).
3. Decision Trees
4. Artificial Neural
Networks (ANNs)
1. It first fits a
quadratic surface
to the 3-D road
point cloud,
generated using
GPT-SGM, a state-
of-the-art
disparity
estimation
algorithm.
1. The dataset with
which a model is
trained greatly
influences the efficacy
and precision of the
solution.
2. It is very dependent
on the
regional data as it
improves the training
process,
which generates
robust
solutions.
1.Extensive
experimental
results
demonstrate the
robustness of our
proposed road
pothole detection
and tracking
framework both
qualitatively and
quantitatively.
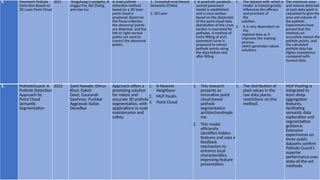
4. Pothole
detection
system using 2D
LiDAR and
camera
2017 Byeong-ho
Kang; Su-il Choi
Develop a pothole
detection system
and method using
2D LiDAR and
Camera. To
improve the
pothole detection
accuracy, the
combination of
heterogeneous
sensor system is
used.
1. 2D LIDA
2. Camera
1. To improve the
pothole detection
accuracy, the
combination of
heterogeneous
sensor system is
used. By using 2D
LiDAR, the
distance and angle
information of
road are obtained
1. The dataset with which
a model is trained
greatly influences the
efficacy and precision of
the solution.
Image-based
algorithm includes
noise filtering,
brightness control,
binarization,
addictive noise
filtering, edge
extraction, and
object extraction
and pothole
detection. To show
the pothole
detection
performance,
experiments of
pothole detection
system using 2D
LiDAR and camera
are performed.
9.
5. PotholeGuard: A
PotholeDetection
Approach by
Point Cloud
Semantic
Segmentation
2023 Sahil Nawale; Dhruv
Khut; Daksh
Dave; Gauransh
Sawhney; Pushkar
Aggrawal; Kailas
Devadkar
Approach offers a
promising solution
for robust and
accurate 3D pothole
segmentation, with
applications in road
maintenance and
safety.
1. K-Nearest
Neighbour
2. MLP Poolin
3. Point Cloud
1. This research
presents an
innovative point
cloud-based
pothole
segmentation
architectureImple
me.
2. This model
efficiently
identifies hidden
features and uses a
feedback
mechanism to
enhance local
characteristics,
improving feature
presentation.
1. The distribution of
pixel values in the
raw data places
restrictions on this
method.
MLP Pooling is
integrated to
learn deep
aggregation
features,
facilitating
semantic data
exploration and
segmentation
guidance.
Extensive
experiments on
three public
datasets confirm
Pothole Guard's
superior
performance over
state-of-the-art
methods.
6. Pavement Pothole
Detection Based on
3D Laser Point Cloud
2021 Yongshang Li yongsha, R
onggui Ma, Bei Zhang,
and Han Liu
A road pothole
detection method
based on a 3D laser
point cloud is
proposed. Based on
the Pauta criterion,
the abnormal points
are detected, and the
left or right normal
points are used to
correct the abnormal
points.
1. Convoluti onal Neural
Networks (CNNs)
2. 3D Laser
1. A quadratic parabolic
arched pavement
model is established,
and a cross-section
based on the dispersion
of the point cloud data
distribution of the cross
section is examined for
potholes. A method of
twice fitting of arch
pavement curve is
proposed to extract
pothole points using
the data before and
after fitting
1. The dataset with which a
model is trained greatly
influences the efficacy
and precision of
the
solution.
2. It is very dependent on
the
regional data as it
improves the training
process,
which generates robust
solutions.
The minimum area
and volume detected
at each data point is
calculated to give the
area and volume of
the pothole.
Experiments have
proved that the
method can
accurately extract the
pothole points, and
the calculated
pothole data has
higher consistency
compared with
manual data.
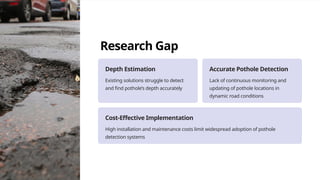
10.
Research Gap
Depth Estimation
Existingsolutions struggle to detect
and find pothole’s depth accurately
Accurate Pothole Detection
Lack of continuous monitoring and
updating of pothole locations in
dynamic road conditions
Cost-Effective Implementation
High installation and maintenance costs limit widespread adoption of pothole
detection systems
11.
Methodology
Data Collection
The datasetconsists of LiDAR-generated .las files containing 3D point clouds of road surfaces. These files are collected using LiDAR-equipped
vehicles or the iPhone 13 Pro’s built-in LiDAR sensor, providing high-resolution depth mapping. The iPhone’s LiDAR scanner enables efficient,
portable, and cost-effective data collection, eliminating the need for expensive UAV-based LiDAR mapping.
Load Point Cloud Data
Point cloud data is a crucial representation format in 3D spatial analysis, commonly used in LiDAR-based applications.
Reading .LAS Files Using the laspy Library
The laspy library is a Python-based tool specifically designed for reading, writing, and manipulating .las files. It provides raw point cloud data, structured as
an array containing x, y, and z coordinates along with intensity, return number, and classification labels.
Extracting (x, y, z) Coordinates
Once the .las file is loaded, the primary interest is the spatial positioning of each point. The extracted x, y, and z coordinates define the topology
of objects in the LiDAR scan.
Converting to an Open3D Point Cloud Object
After extraction, the x, y, and z coordinates are formatted into a structured NumPy array and mapped to an Open3D.PointCloud object, enabling
efficient visualization and further processing.
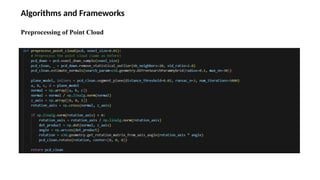
Pre-processing of the Point Cloud
• Voxel Down sampling
Voxel down sampling reduces point cloud density for faster processing without significant information loss. The method groups nearby
points into smaller representative points using a 3D grid.
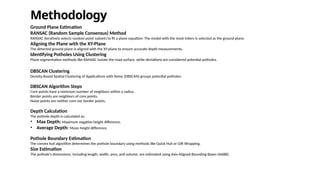
12.
Methodology
Ground Plane Estimation
RANSAC(Random Sample Consensus) Method
RANSAC iteratively selects random point subsets to fit a plane equation: The model with the most inliers is selected as the ground plane.
Aligning the Plane with the XY-Plane
The detected ground plane is aligned with the XY-plane to ensure accurate depth measurements.
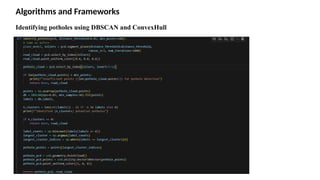
Identifying Potholes Using Clustering
Plane segmentation methods like RANSAC isolate the road surface, while deviations are considered potential potholes.
DBSCAN Clustering
Density-Based Spatial Clustering of Applications with Noise (DBSCAN) groups potential potholes.
DBSCAN Algorithm Steps
Core points have a minimum number of neighbors within a radius.
Border points are neighbors of core points.
Noise points are neither core nor border points.
Depth Calculation
The pothole depth is calculated as:
• Max Depth: Maximum negative height difference.
• Average Depth: Mean height difference.
Pothole Boundary Estimation
The convex hull algorithm determines the pothole boundary using methods like Quick Hull or Gift Wrapping.
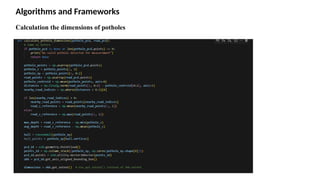
Size Estimation
The pothole’s dimensions, including length, width, area, and volume, are estimated using Axis-Aligned Bounding Boxes (AABB).
13.
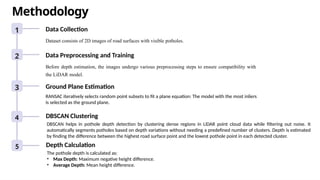
1 Data Collection
Datasetconsists of 2D images of road surfaces with visible potholes.
2 Data Preprocessing and Training
Before depth estimation, the images undergo various preprocessing steps to ensure compatibility with
the LiDAR model.
3 Ground Plane Estimation
RANSAC iteratively selects random point subsets to fit a plane equation: The model with the most inliers
is selected as the ground plane.
3
4 DBSCAN Clustering
DBSCAN helps in pothole depth detection by clustering dense regions in LiDAR point cloud data while filtering out noise. It
automatically segments potholes based on depth variations without needing a predefined number of clusters. Depth is estimated
by finding the difference between the highest road surface point and the lowest pothole point in each detected cluster.
3
5 Depth Calculation
The pothole depth is calculated as:
• Max Depth: Maximum negative height difference.
• Average Depth: Mean height difference.
Methodology
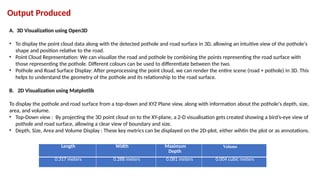
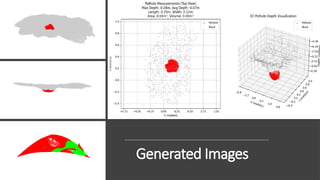
Output Produced
Length WidthMaximum
Depth
Volume
0.317 meters 0.288 meters 0.081 meters 0.004 cubic meters
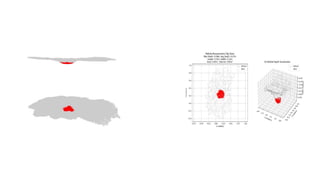
A. 3D Visualization using Open3D
• To display the point cloud data along with the detected pothole and road surface in 3D, allowing an intuitive view of the pothole's
shape and position relative to the road.
• Point Cloud Representation: We can visualize the road and pothole by combining the points representing the road surface with
those representing the pothole. Different colours can be used to differentiate between the two.
• Pothole and Road Surface Display: After preprocessing the point cloud, we can render the entire scene (road + pothole) in 3D. This
helps to understand the geometry of the pothole and its relationship to the road surface.
B. 2D Visualization using Matplotlib
To display the pothole and road surface from a top-down and XYZ Plane view, along with information about the pothole's depth, size,
area, and volume.
• Top-Down view : By projecting the 3D point cloud on to the XY-plane, a 2-D visualisation gets created showing a bird’s-eye view of
pothole and road surface, allowing a clear view of boundary and size.
• Depth, Size, Area and Volume Display : These key metrics can be displayed on the 2D-plot, either wihtin the plot or as annotations.
20.
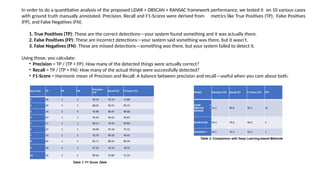
Test Case TPFP FN
Precision
(%)
Recall (%) F1-Score (%)
1 28 3 2 90.32 93.33 91.80
2 30 4 3 88.24 90.91 89.55
3 26 2 4 92.86 86.67 89.66
4 29 3 3 90.63 90.63 90.63
5 31 5 2 86.11 93.94 89.83
6 27 3 2 90.00 93.10 91.52
7 25 2 3 92.59 89.29 90.91
8 30 5 4 85.71 88.24 86.96
9 28 4 2 87.50 93.33 90.32
10 26 3 2 89.66 92.86 91.24
Model Precision (%) Recall (%) F1-Score (%) FPS
LiDAR +
DBSCAN +
RANSAC
91.2 89.8 90.5 12
RandLA-Net 96.4 95.6 96.0 4
PointNet++ 94.1 92.3 93.2 2
In order to do a quantitative analysis of the proposed LiDAR + DBSCAN + RANSAC framework performance, we tested it on 10 various cases
with ground truth manually annotated. Precision, Recall and F1-Scores were derived from metrics like True Positives (TP), False Positives
(FP), and False Negatives (FN).
1. True Positives (TP): These are the correct detections—your system found something and it was actually there.
2. False Positives (FP): These are incorrect detections—your system said something was there, but it wasn’t.
3. False Negatives (FN): These are missed detections—something was there, but your system failed to detect it.
Using those, you calculate:
• Precision = TP / (TP + FP): How many of the detected things were actually correct?
• Recall = TP / (TP + FN): How many of the actual things were successfully detected?
• F1-Score = Harmonic mean of Precision and Recall: A balance between precision and recall—useful when you care about both.
Table 1: F1 Score Table
Table 2: Comparison with Deep Learning-based Methods
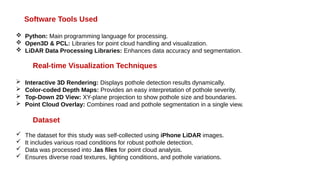
Software Tools Used
Python: Main programming language for processing.
Open3D & PCL: Libraries for point cloud handling and visualization.
LiDAR Data Processing Libraries: Enhances data accuracy and segmentation.
Real-time Visualization Techniques
Interactive 3D Rendering: Displays pothole detection results dynamically.
Color-coded Depth Maps: Provides an easy interpretation of pothole severity.
Top-Down 2D View: XY-plane projection to show pothole size and boundaries.
Point Cloud Overlay: Combines road and pothole segmentation in a single view.
Dataset
The dataset for this study was self-collected using iPhone LiDAR images.
It includes various road conditions for robust pothole detection.
Data was processed into .las files for point cloud analysis.
Ensures diverse road textures, lighting conditions, and pothole variations.
24.
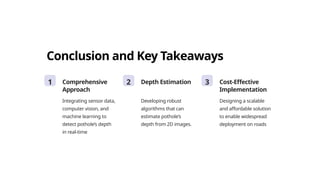
Conclusion and KeyTakeaways
1 Comprehensive
Approach
Integrating sensor data,
computer vision, and
machine learning to
detect pothole’s depth
in real-time
2 Depth Estimation
Developing robust
algorithms that can
estimate pothole’s
depth from 2D images.
3 Cost-Effective
Implementation
Designing a scalable
and affordable solution
to enable widespread
deployment on roads
25.
References
1.
N. Wang, J.Dong, H. Fang, et al., “3D reconstruction and segmentation system for pavement potholes based on
improved structure-from-motion (SfM) and deep learning,” Construction and Building Materials, vol. 398, p. 132499,
2023.
2.
M. Cheng, L. Hui, J. Xie, et al., “SSPC-Net: Semi-supervised semantic 3D point cloud segmentation network,” in
Proceedings of the AAAI Conference on Artificial Intelligence, vol. 35, no. 2, 2021, pp. 1140–1147.
3.
R. Fan, U. Ozgunalp, B. Hosking, et al., “Pothole detection based on disparity transformation and road surface
modeling,” IEEE Transactions on Image Processing, vol. 29, pp. 897–908, 2019.
4.
J. Xu, R. Zhang, J. Dou, et al., “RPVNet: A deep and efficient range-point-voxel fusion network for LiDAR point cloud
segmentation,” in Proceedings of the IEEE/CVF International Conference on Computer Vision, 2021, pp. 16024–
16033.
5.
S. Fan, Q. Dong, F. Zhu, et al., “SCF-Net: Learning spatial contextual features for large-scale point cloud
segmentation,” in 2021 IEEE/CVF Conference on Computer Vision and Pattern Recognition (CVPR), 2021, pp.
14499–14508.
6.
A. Akagic, E. Buza, and S. Omanovic, “Pothole detection: An efficient vision-based method using RGB color space
image segmentation,” in 2017 40th International Convention on Information and Communication Technology,
Electronics and Microelectronics (MIPRO), IEEE, 2017, pp. 1104–1109.
7.
C. Choy, J. Park, and V. Koltun, “Fully Convolutional Geometric Features,” in 2019 IEEE/CVF International
Conference on Computer Vision (ICCV), 2019, pp. 8957–8965.
8.
C. R. Qi, H. Su, K. Mo, and L. J. Guibas, “PointNet: Deep Learning on Point Sets for 3D Classification and
Segmentation,” in 2017 IEEE Conference on Computer Vision and Pattern Recognition (CVPR), 2017, pp. 77–85.


![Pothole_Depth_Estimation_LiDAR_BGIET_ppt[1].pptx](https://cdn.slidesharecdn.com/ss_thumbnails/potholedepthestimationlidarbgietppt1-250928095107-b77307ea-thumbnail.jpg?width=640&height=640&fit=bounds)


![Final_Road_Classification_Pothole_Detection_PPT[1].pptx](https://cdn.slidesharecdn.com/ss_thumbnails/finalroadclassificationpotholedetectionppt1-260106175235-72ada4c8-thumbnail.jpg?width=640&height=640&fit=bounds)