Download as PDF, PPTX

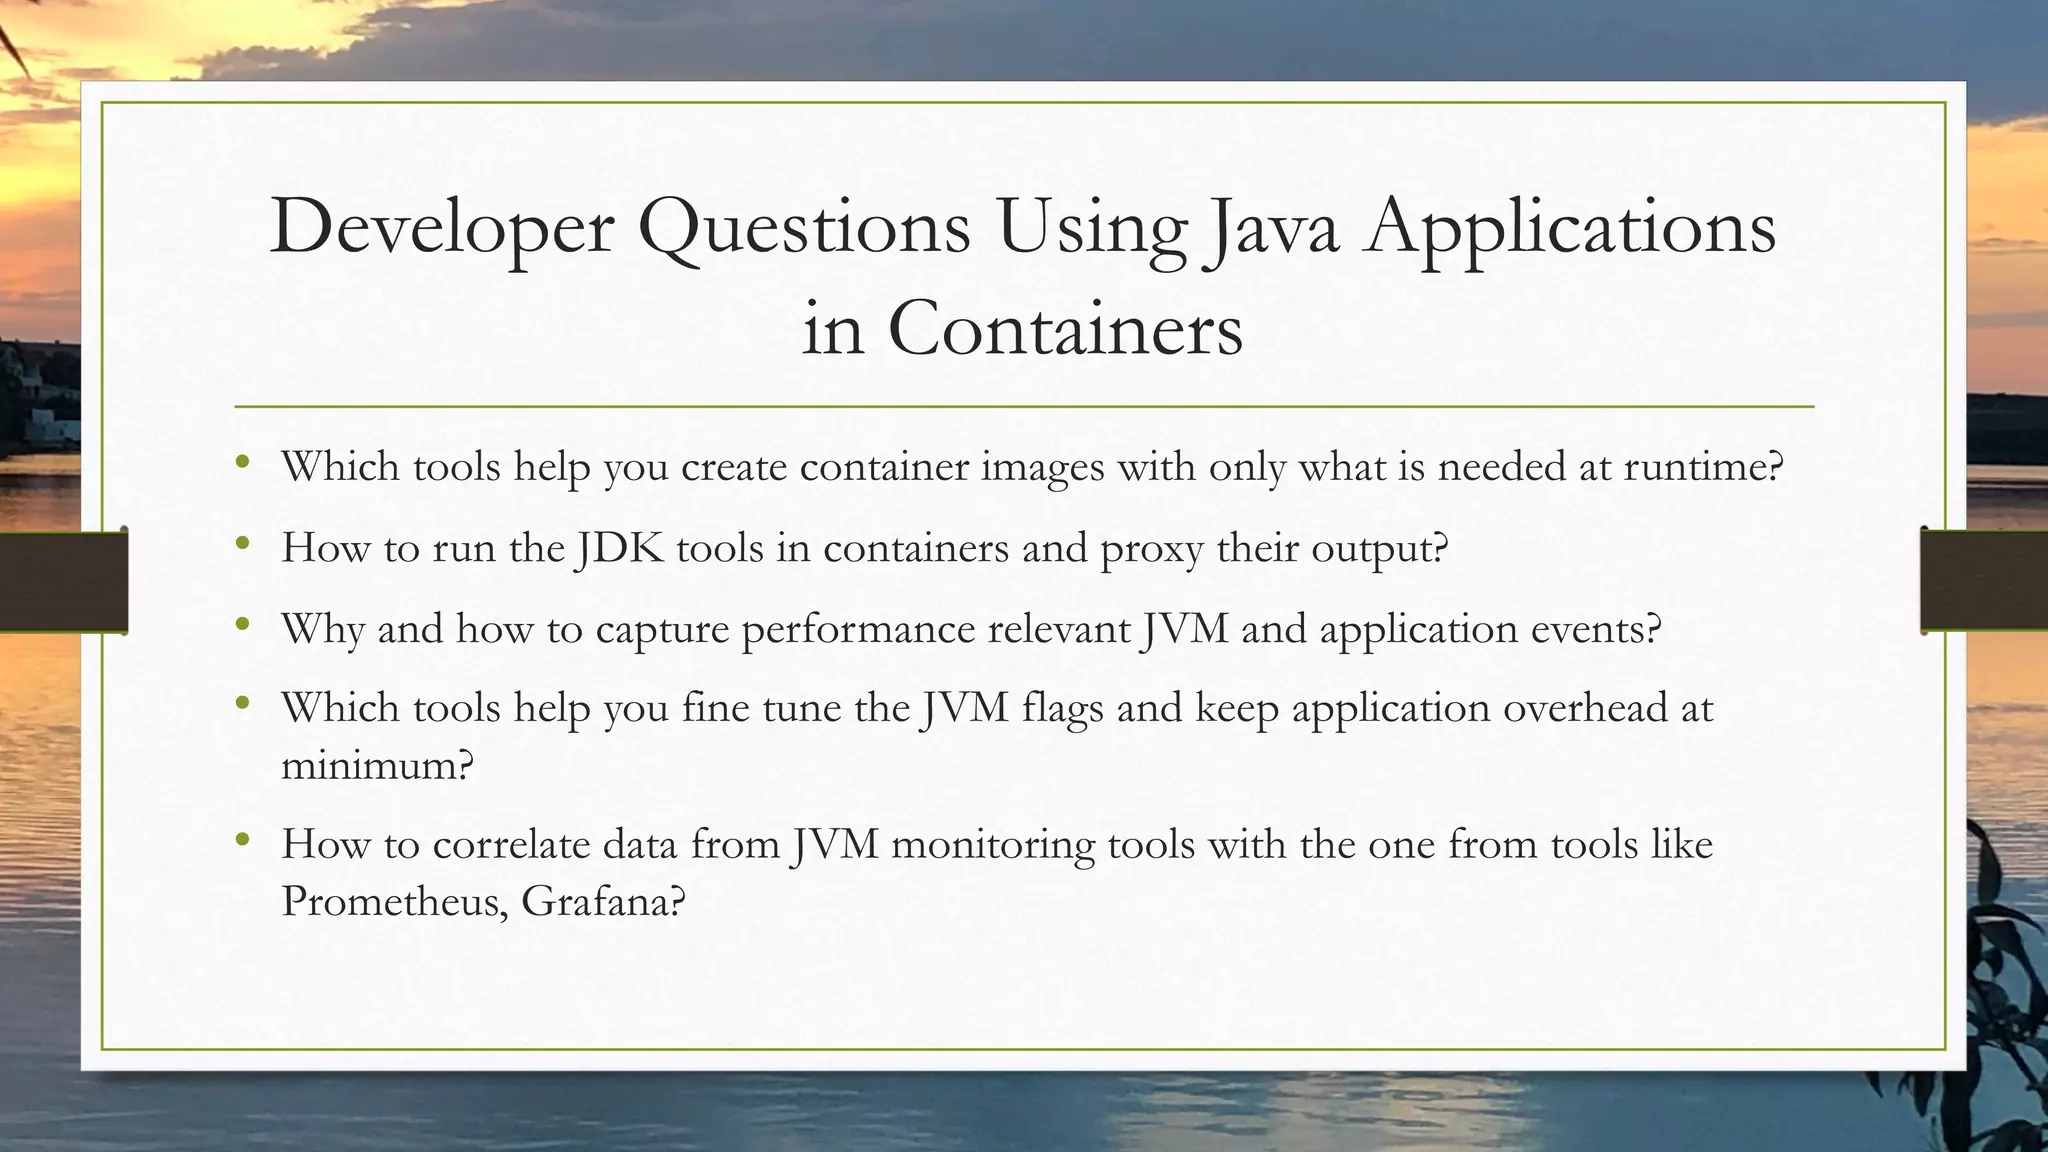
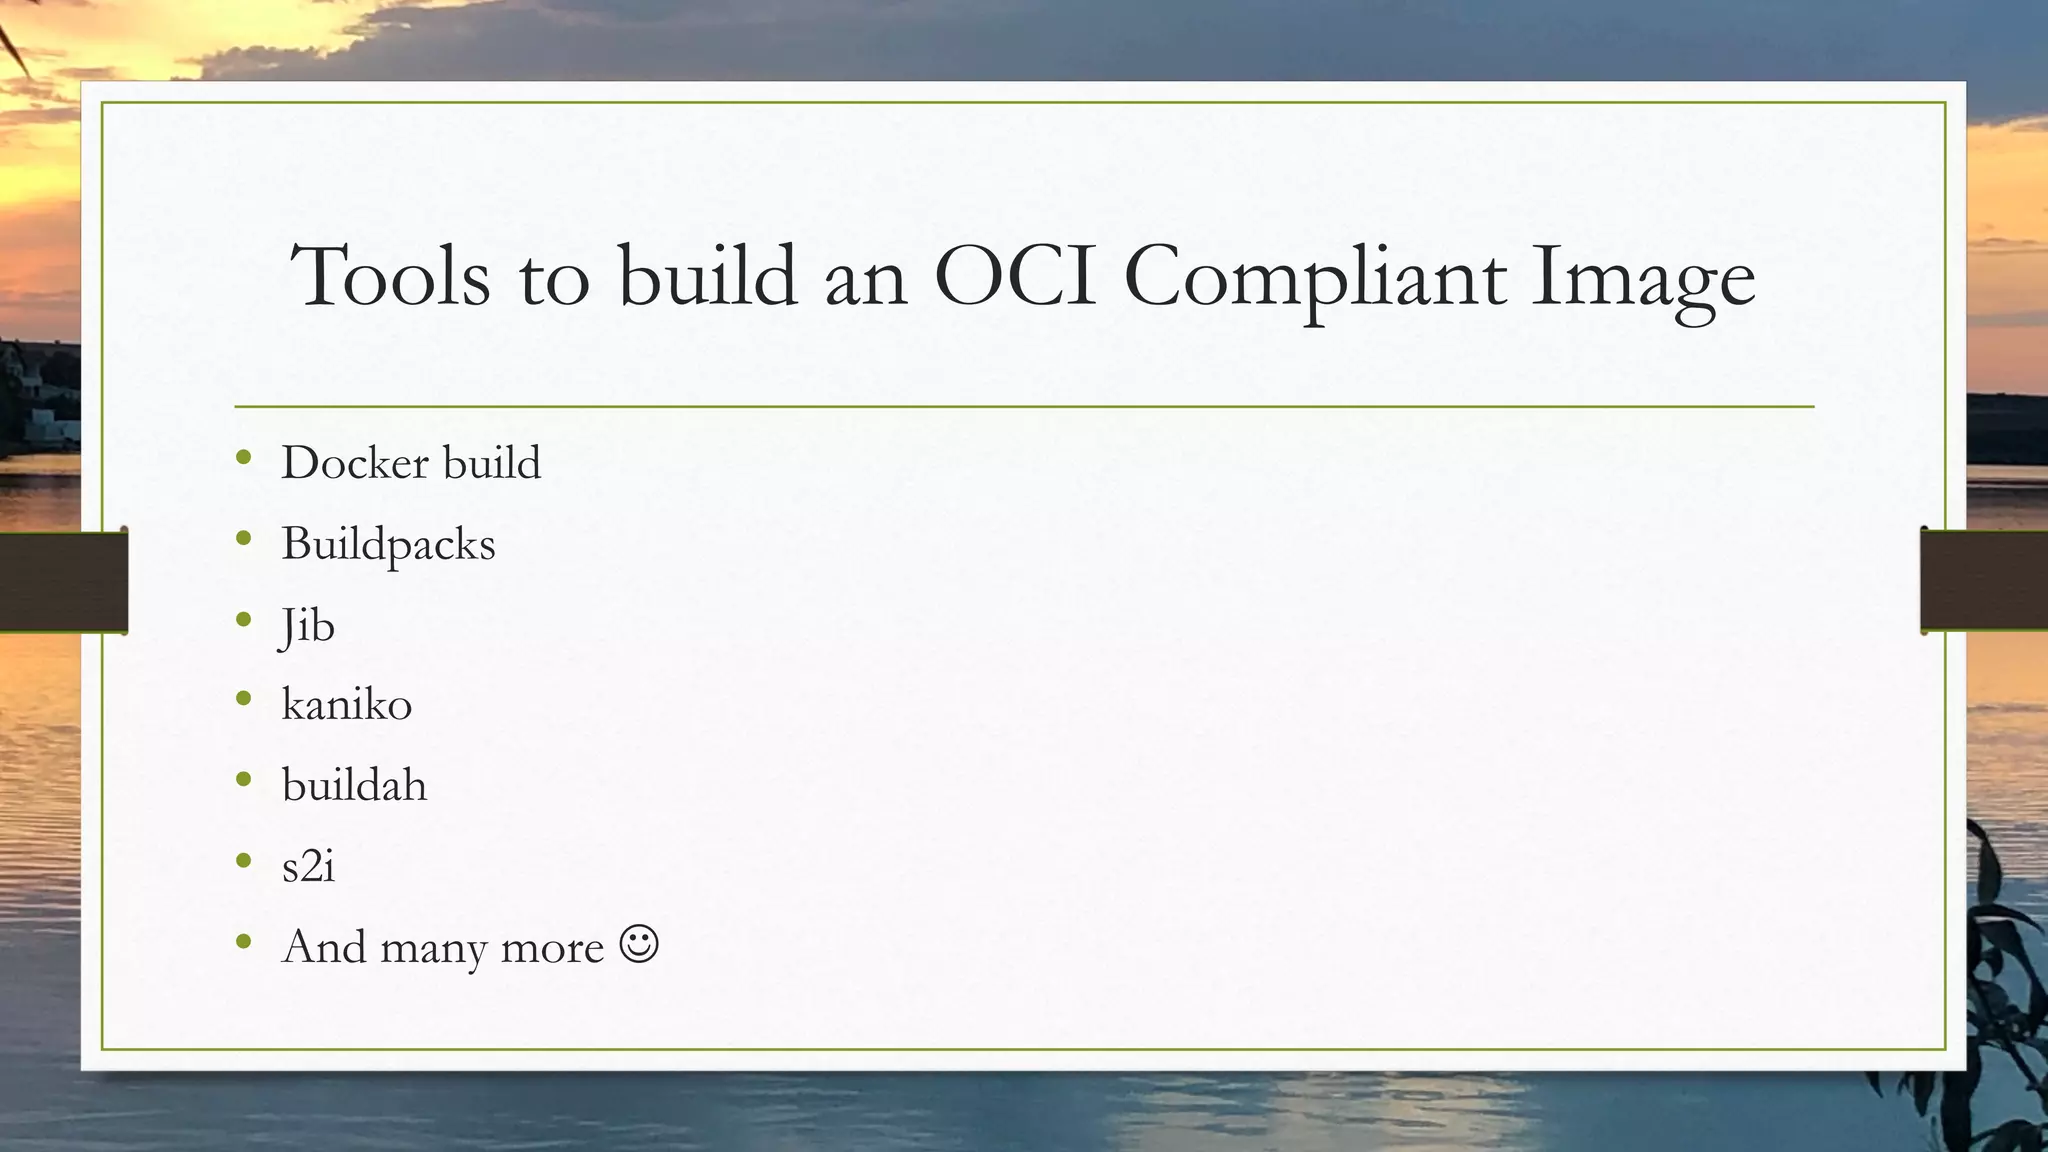
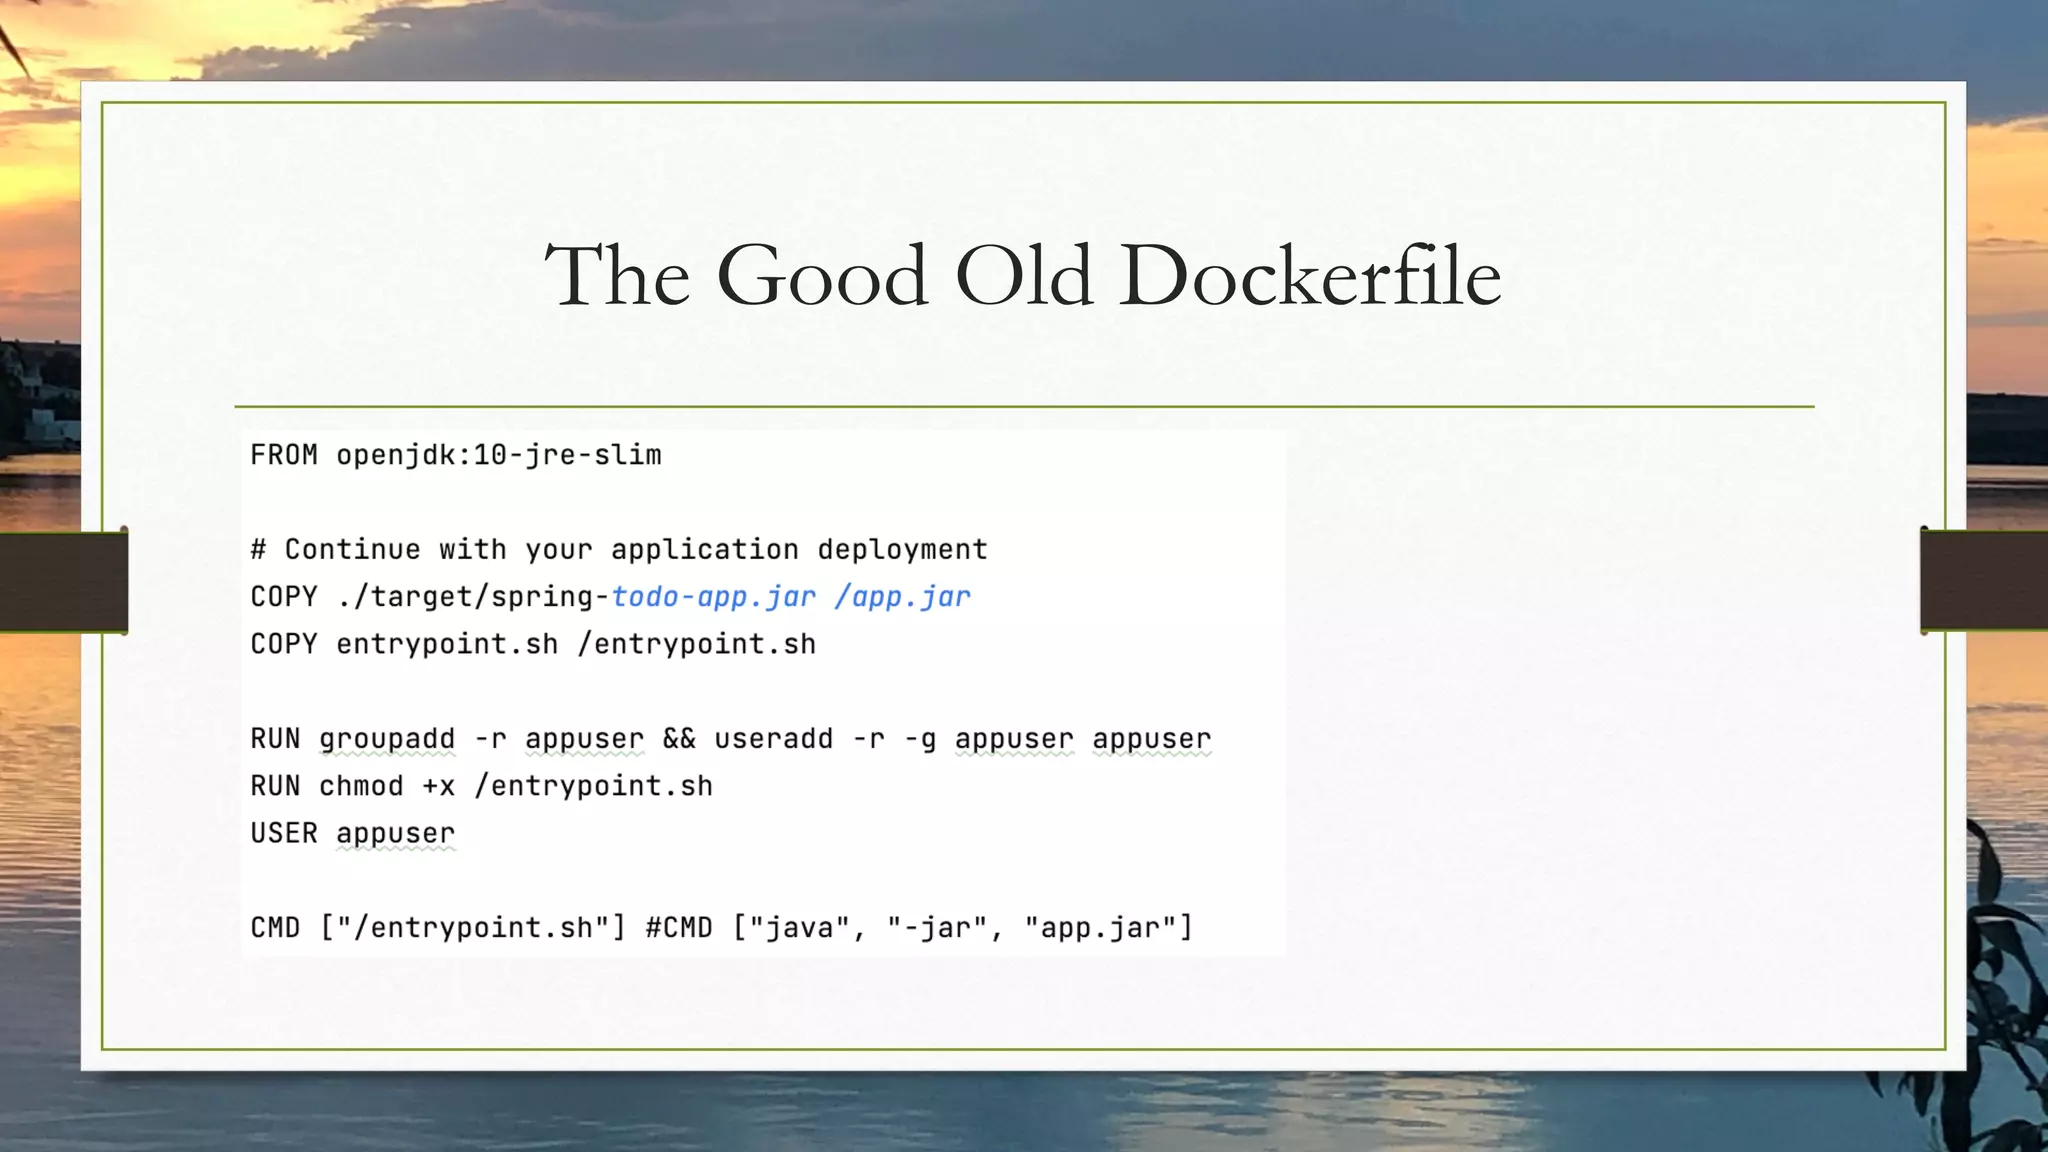
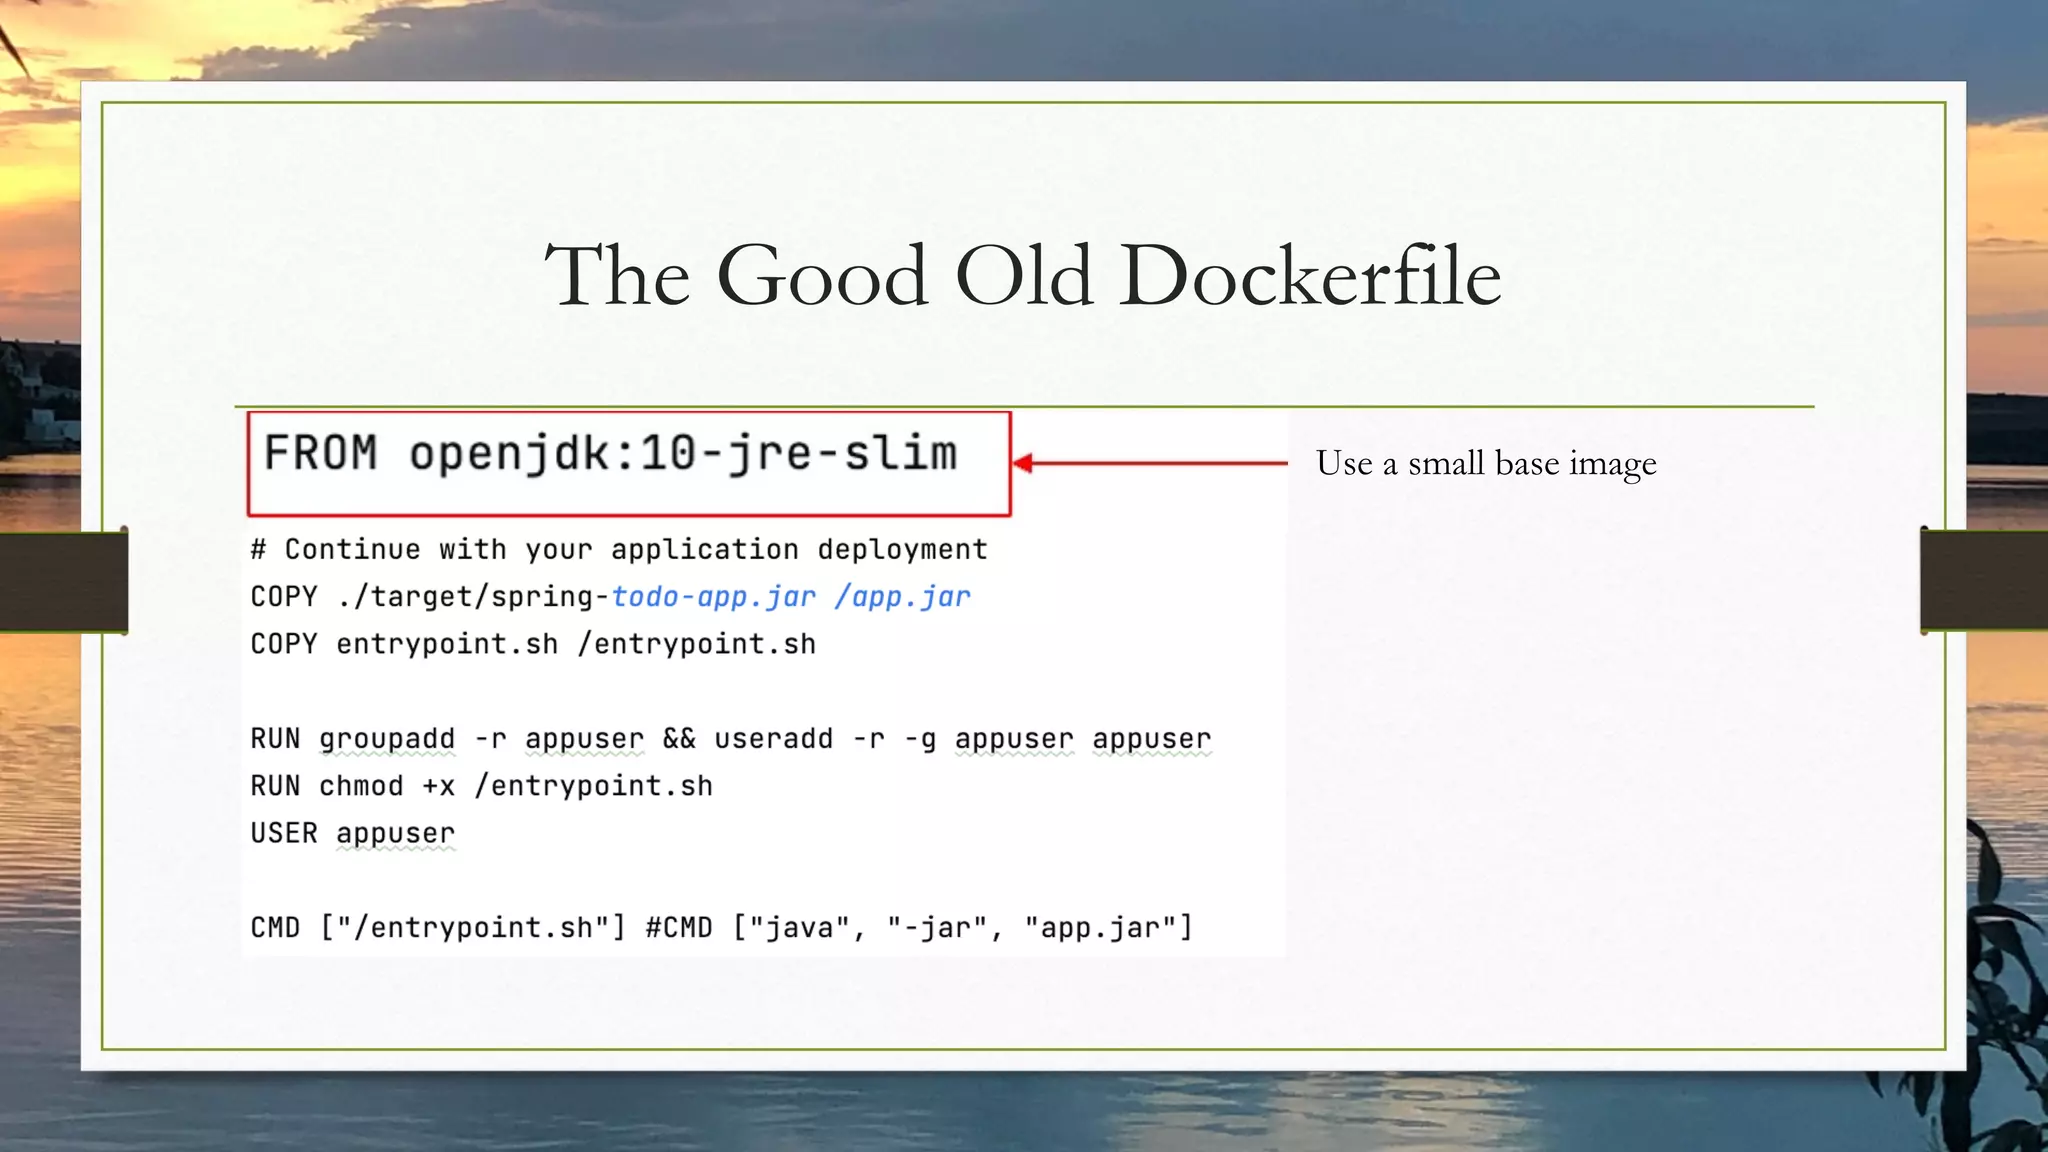
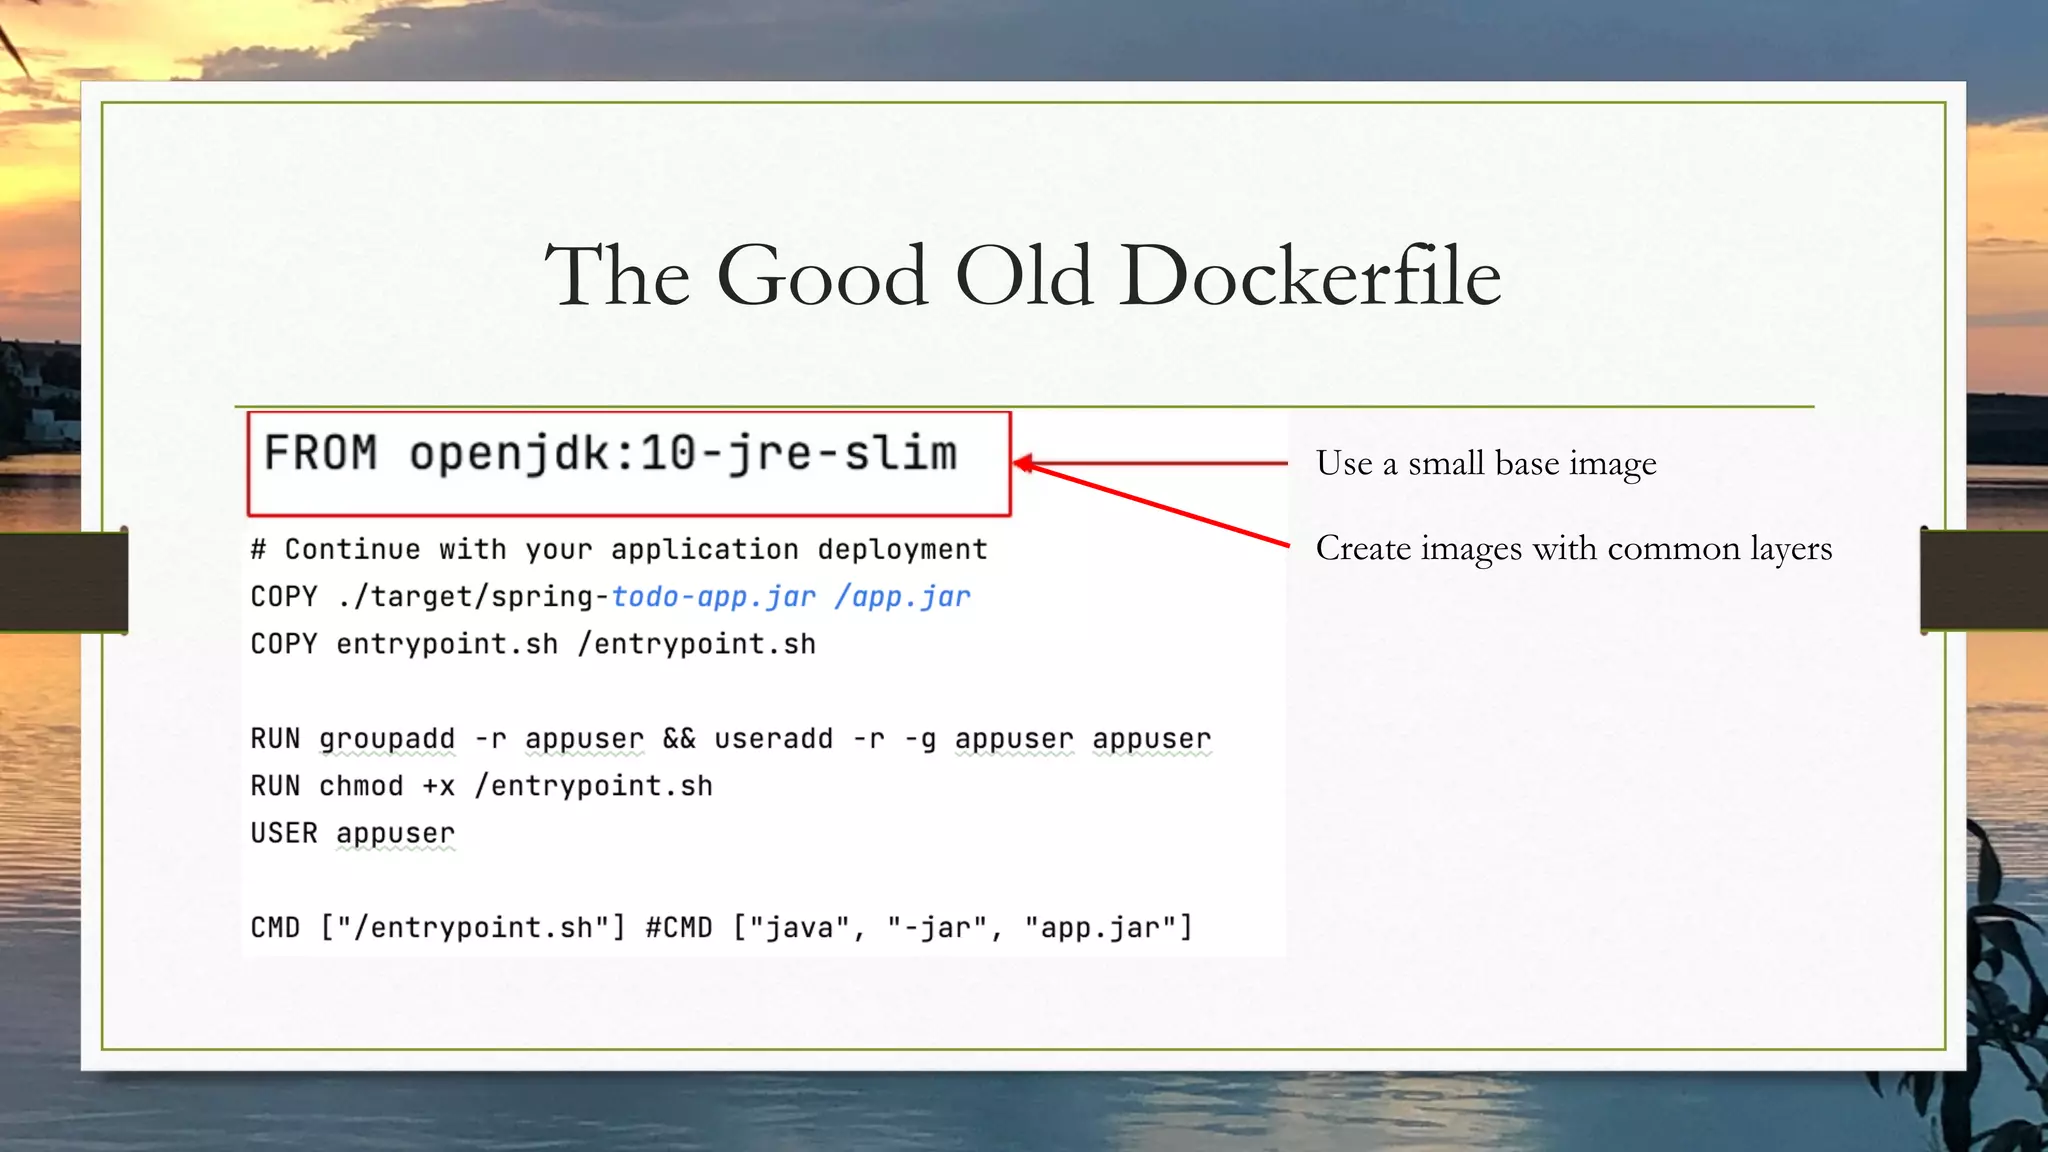
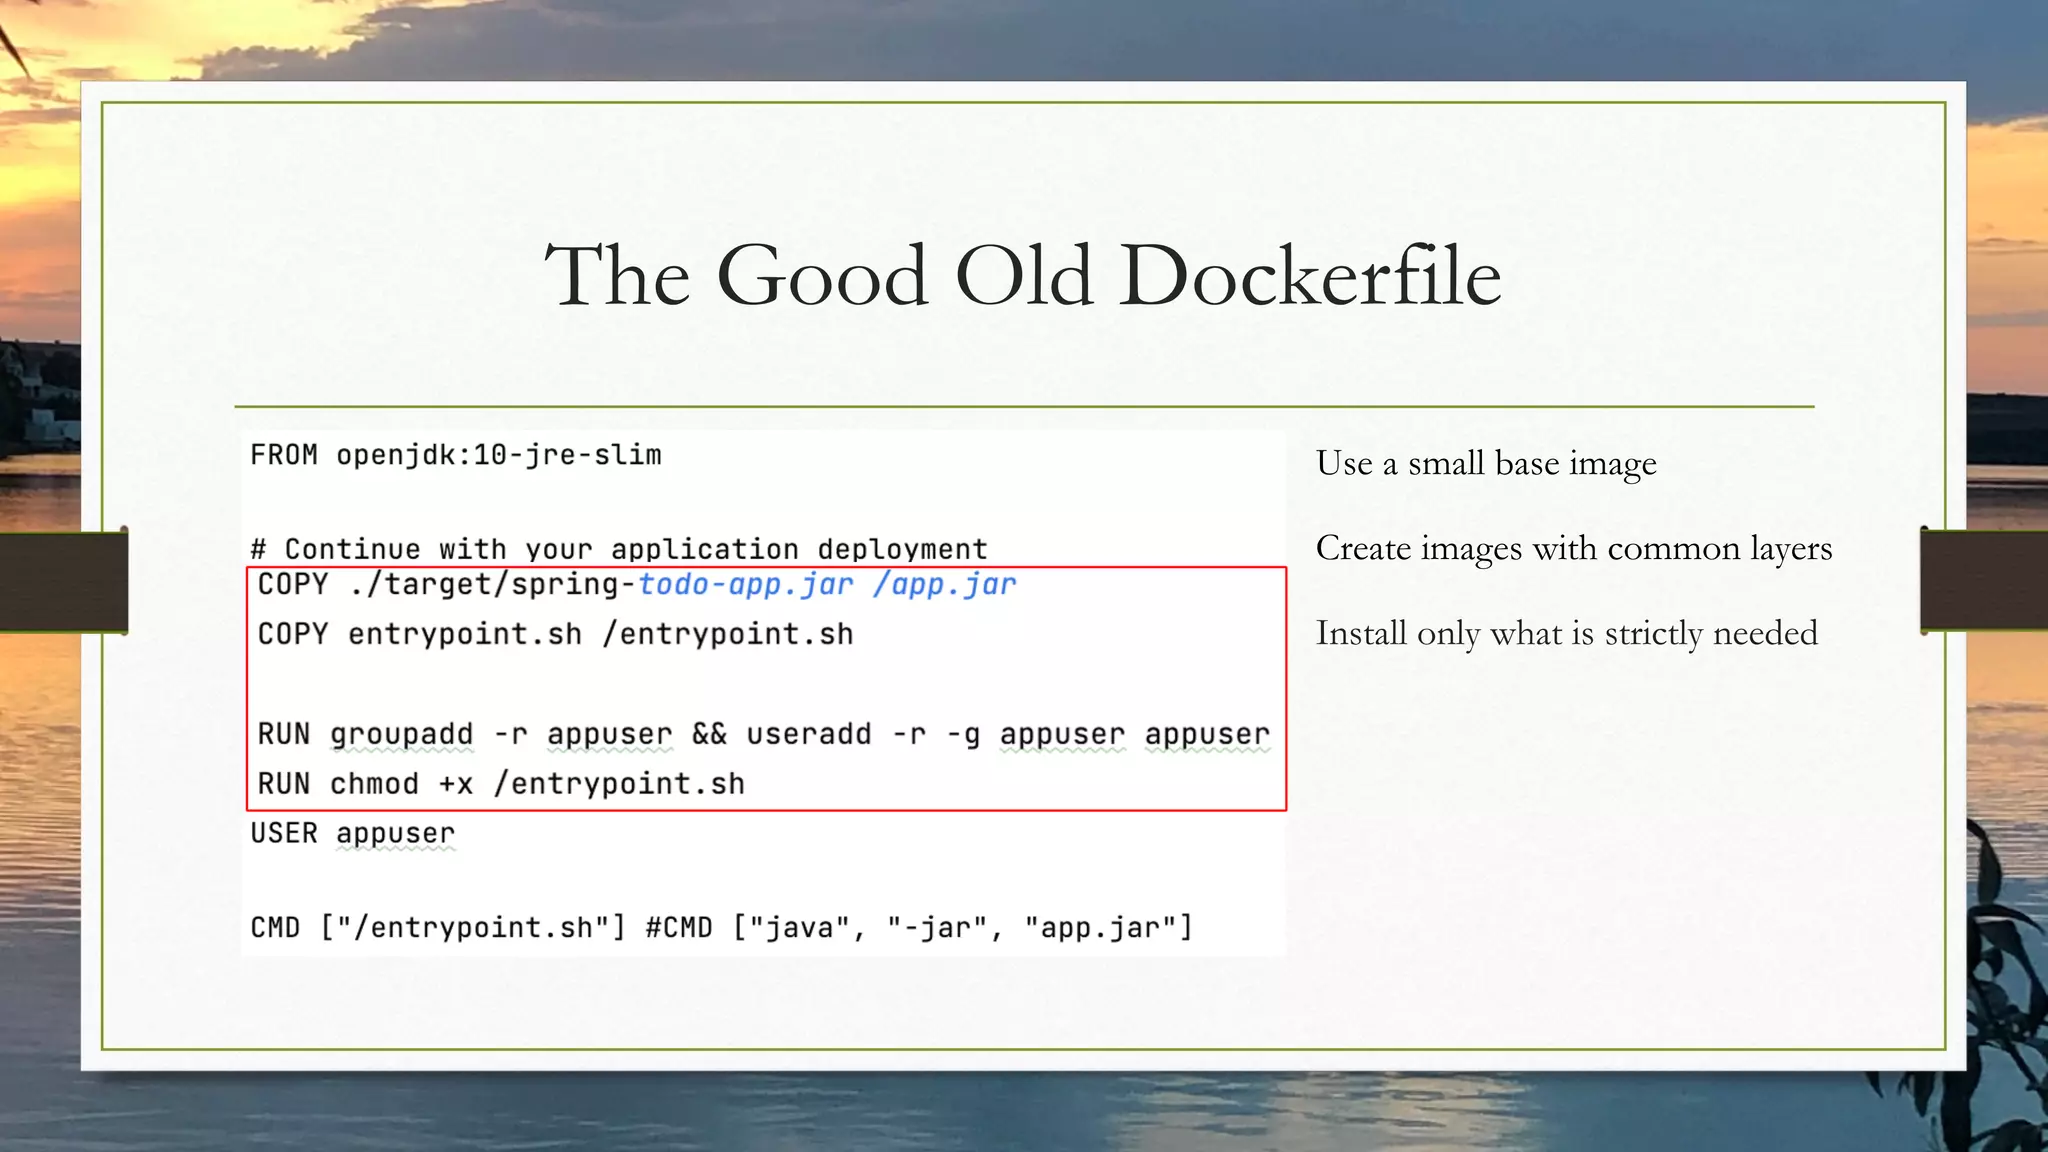
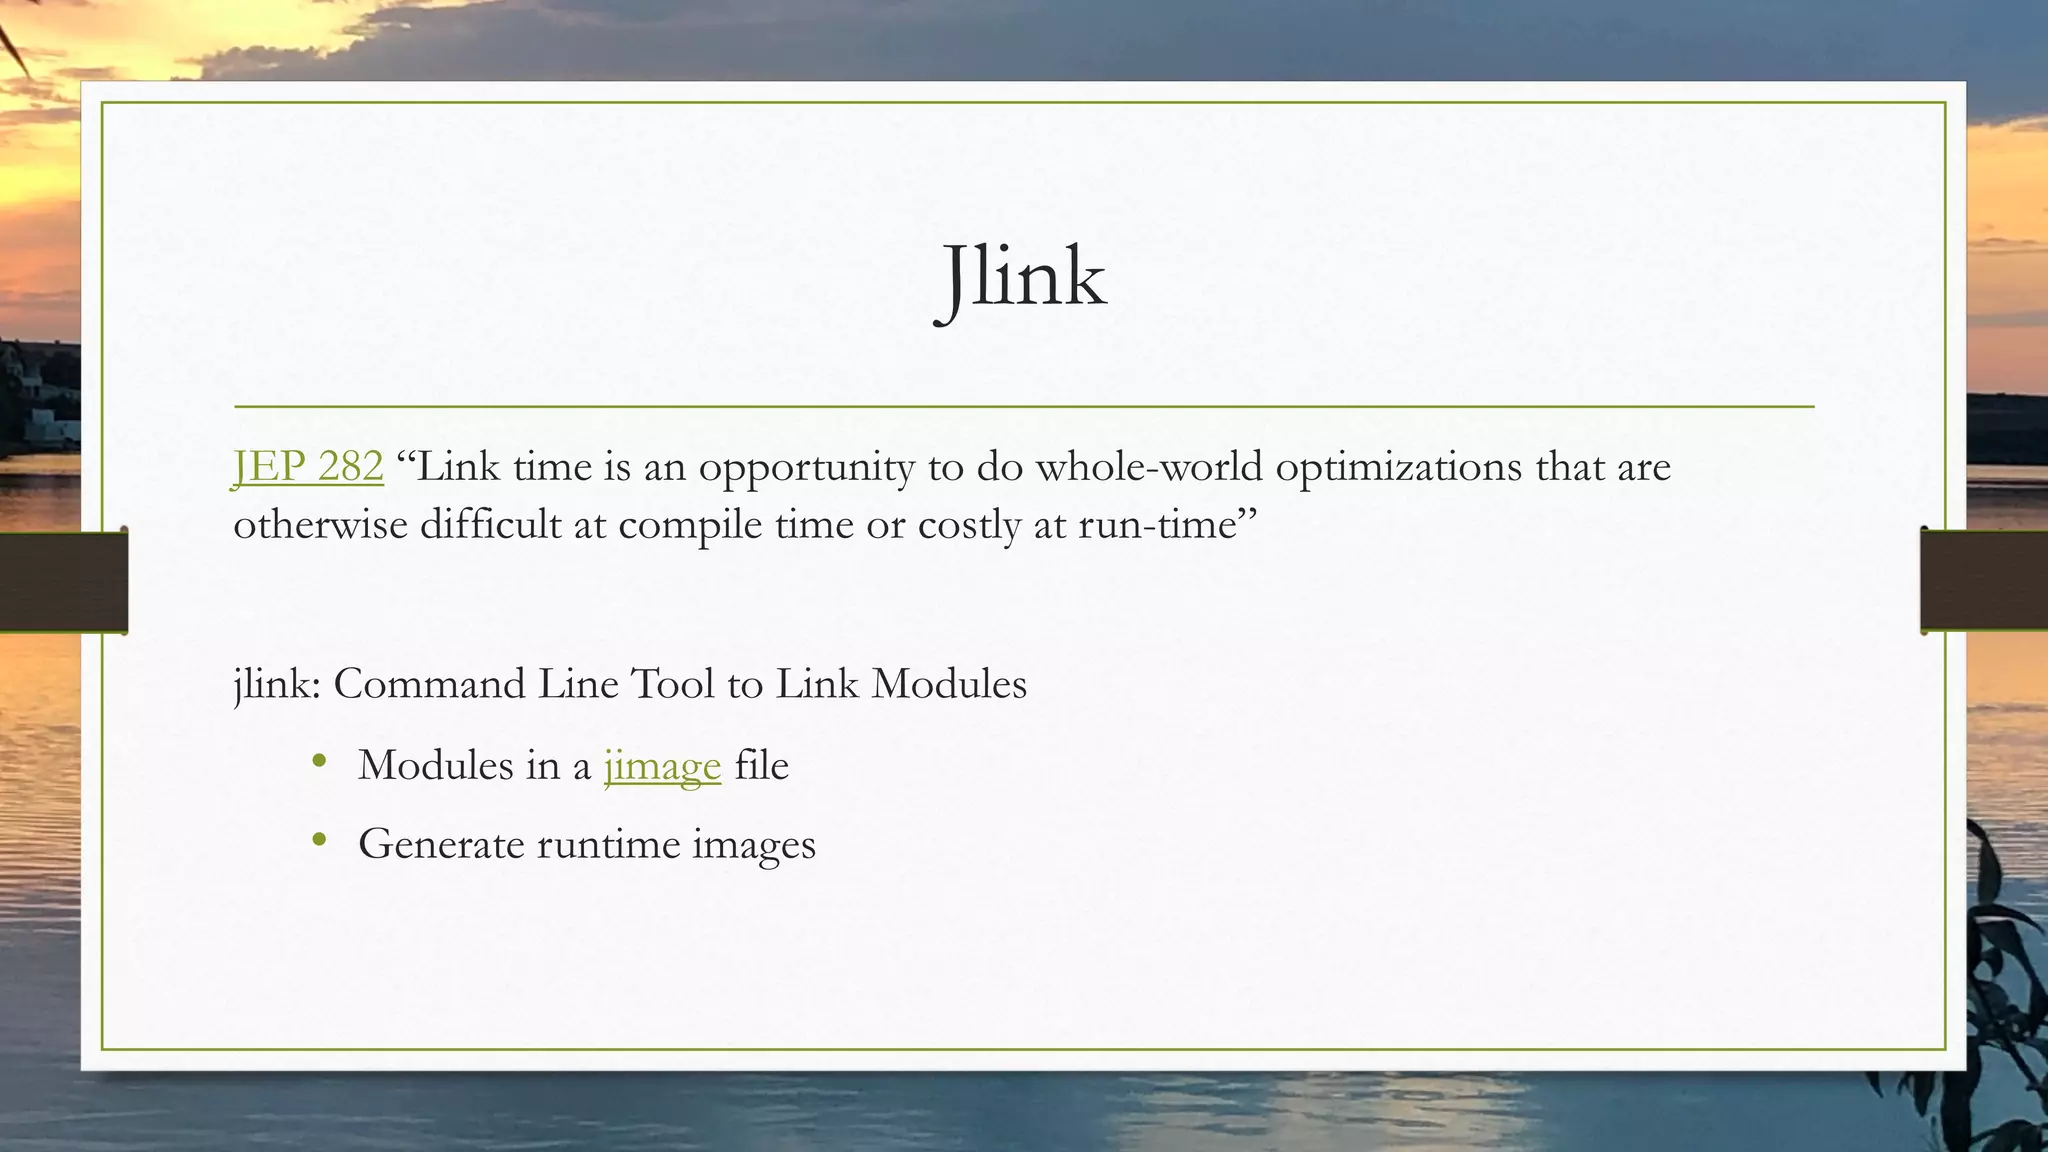
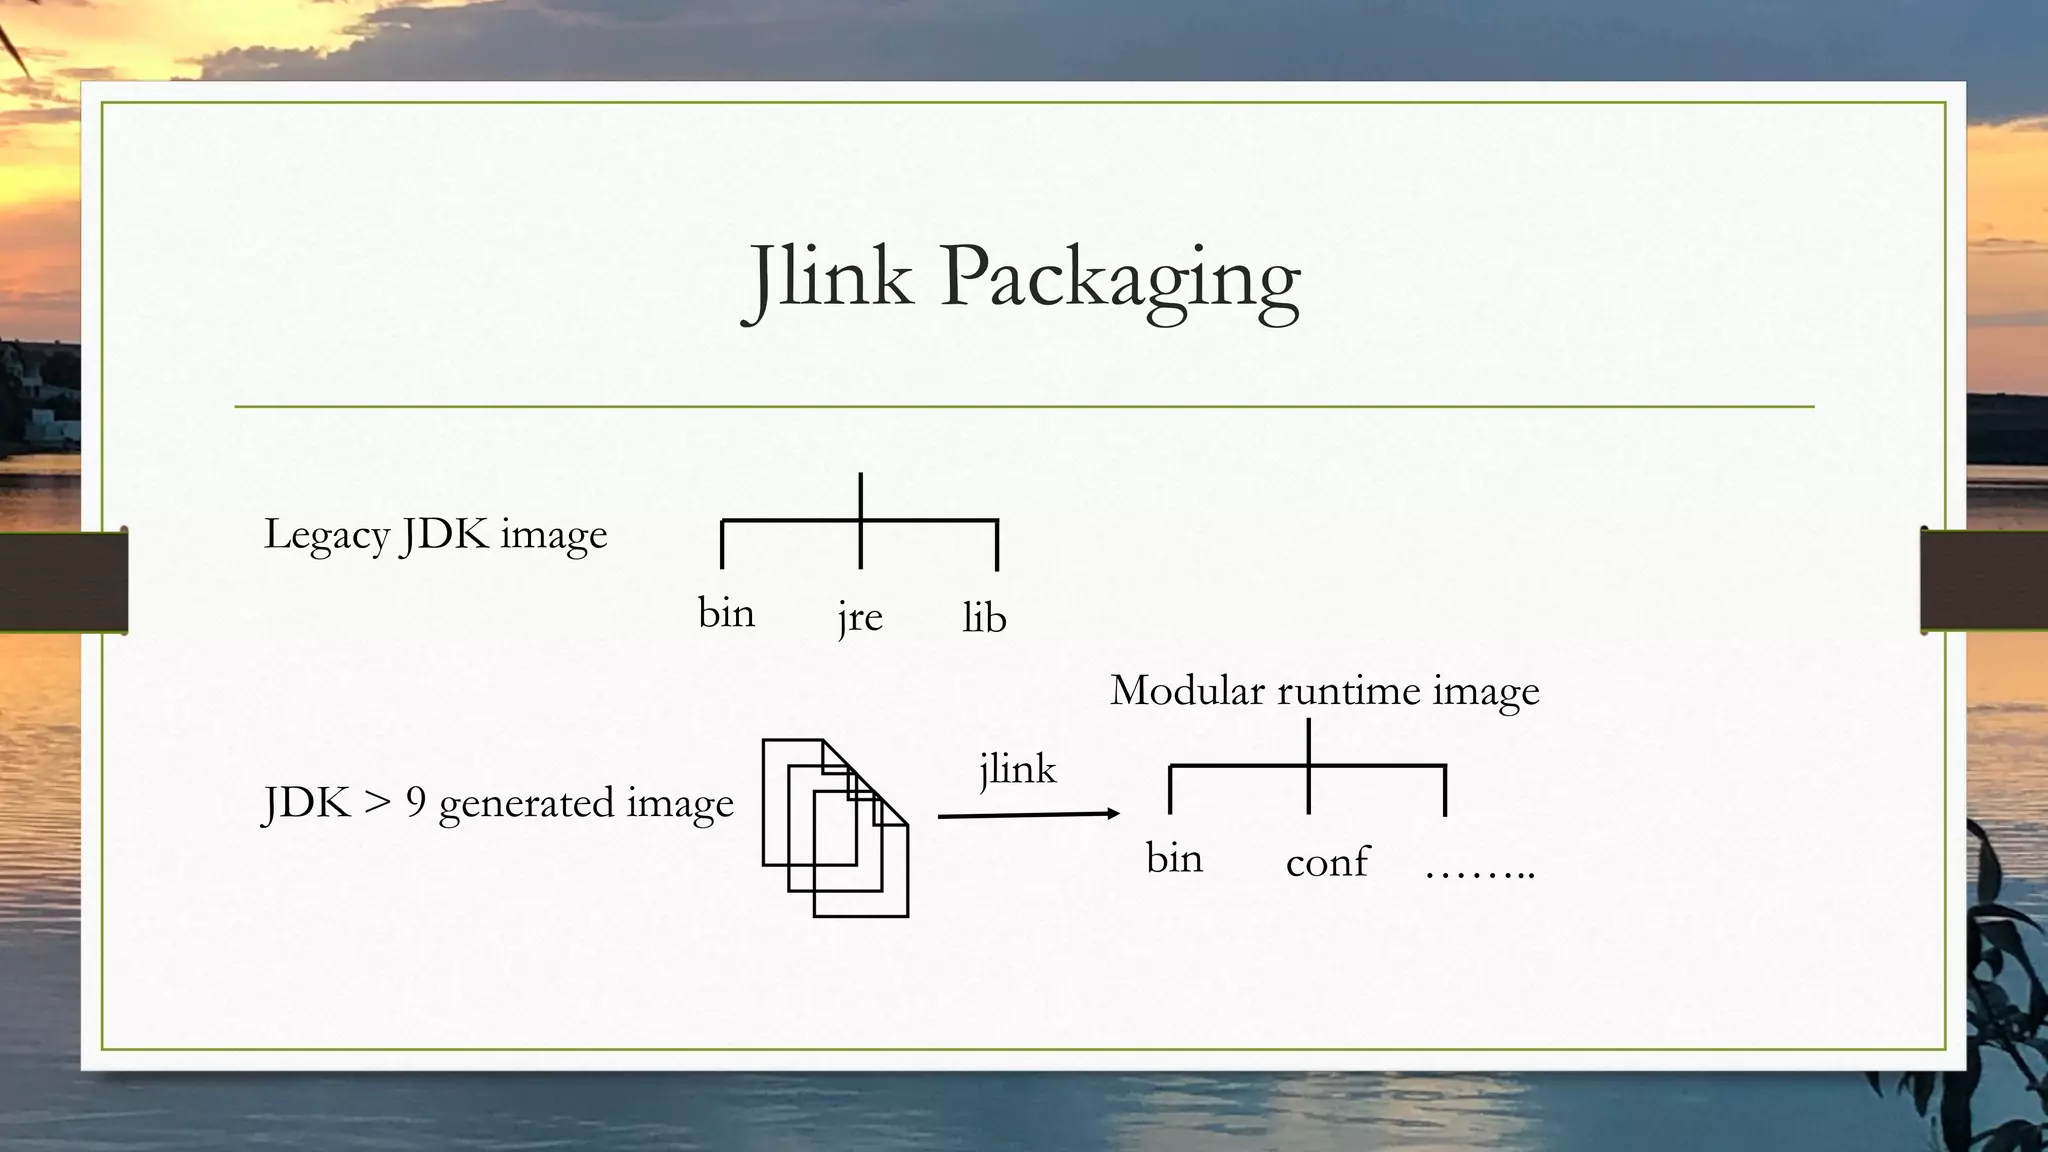
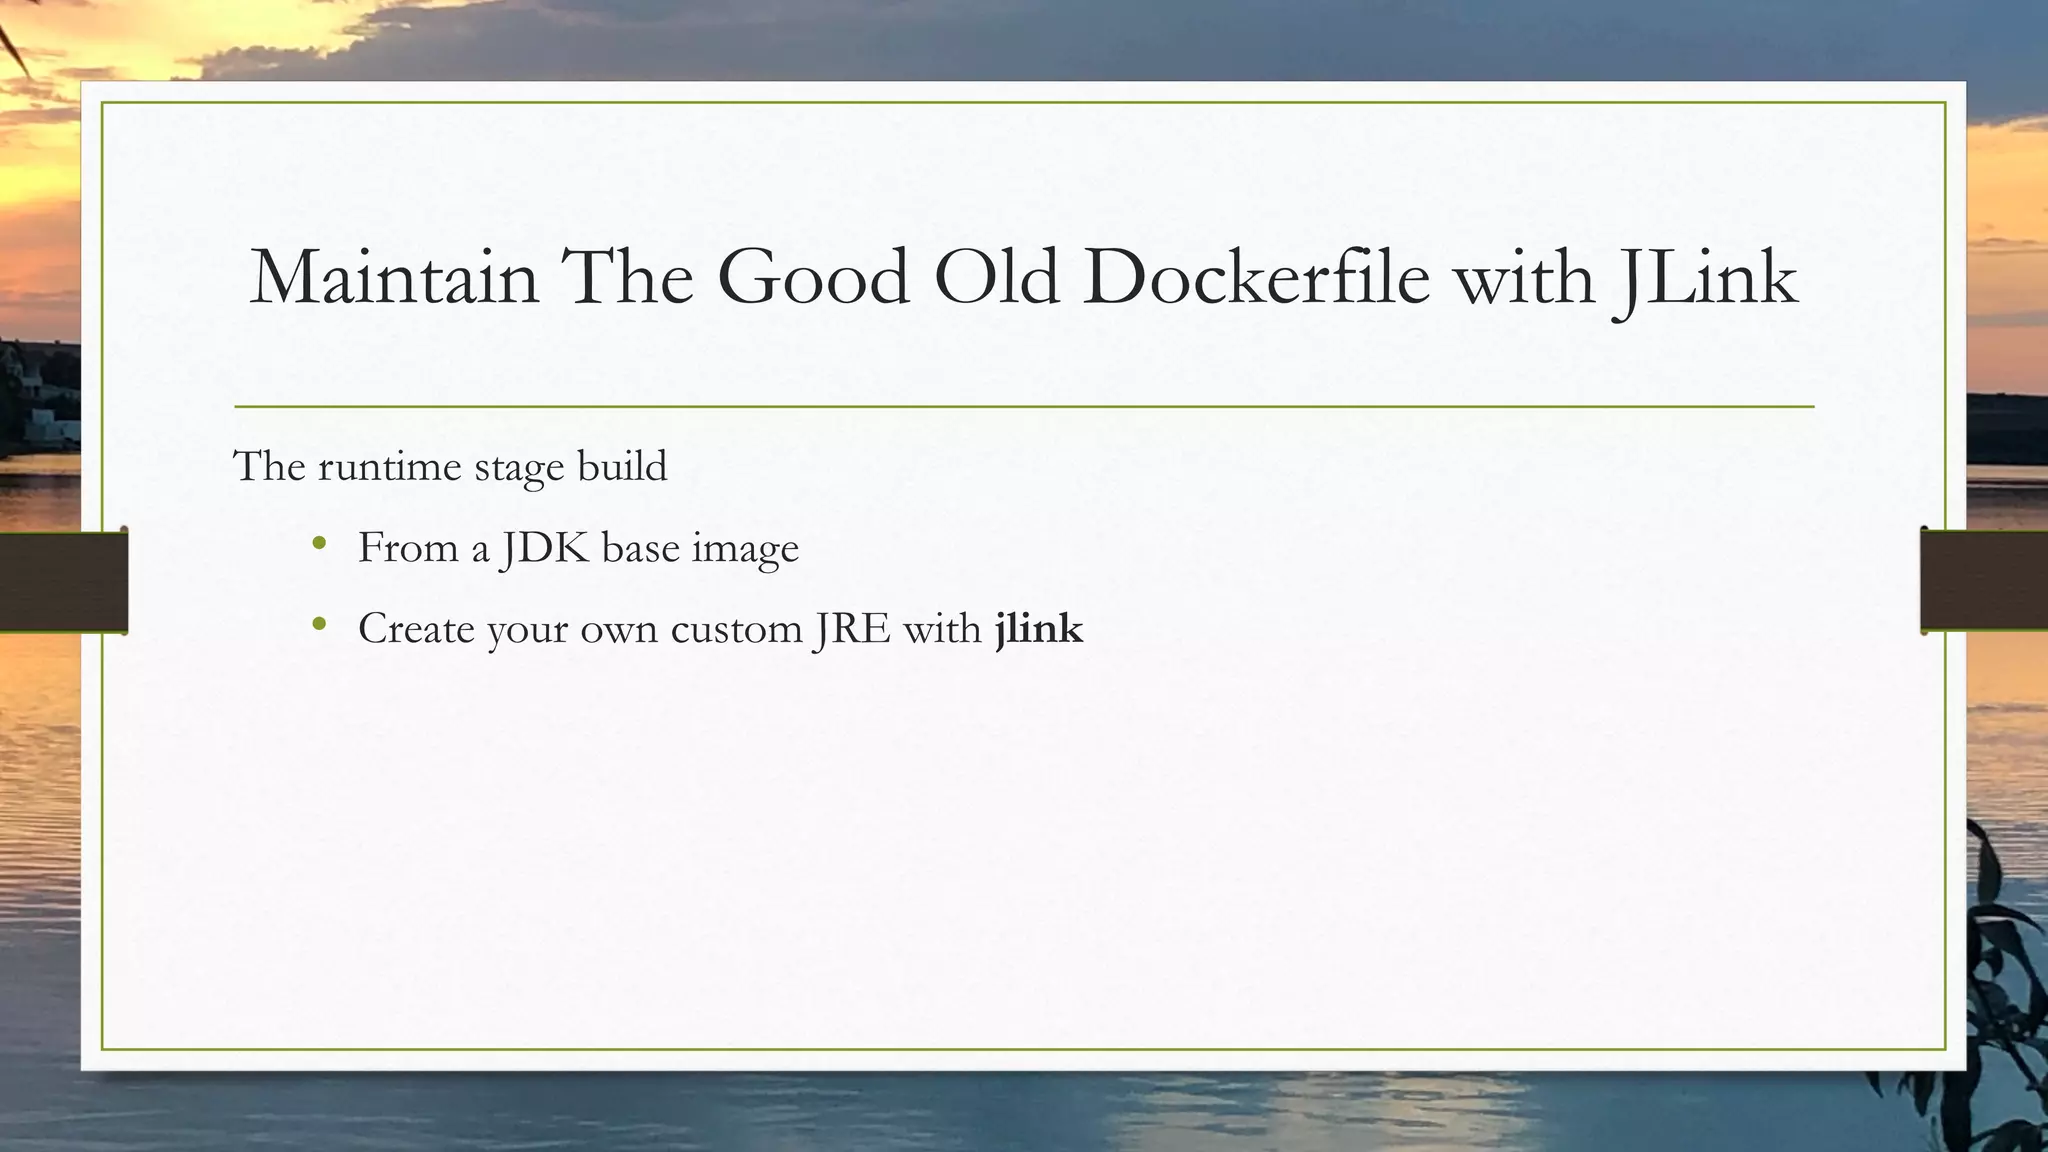
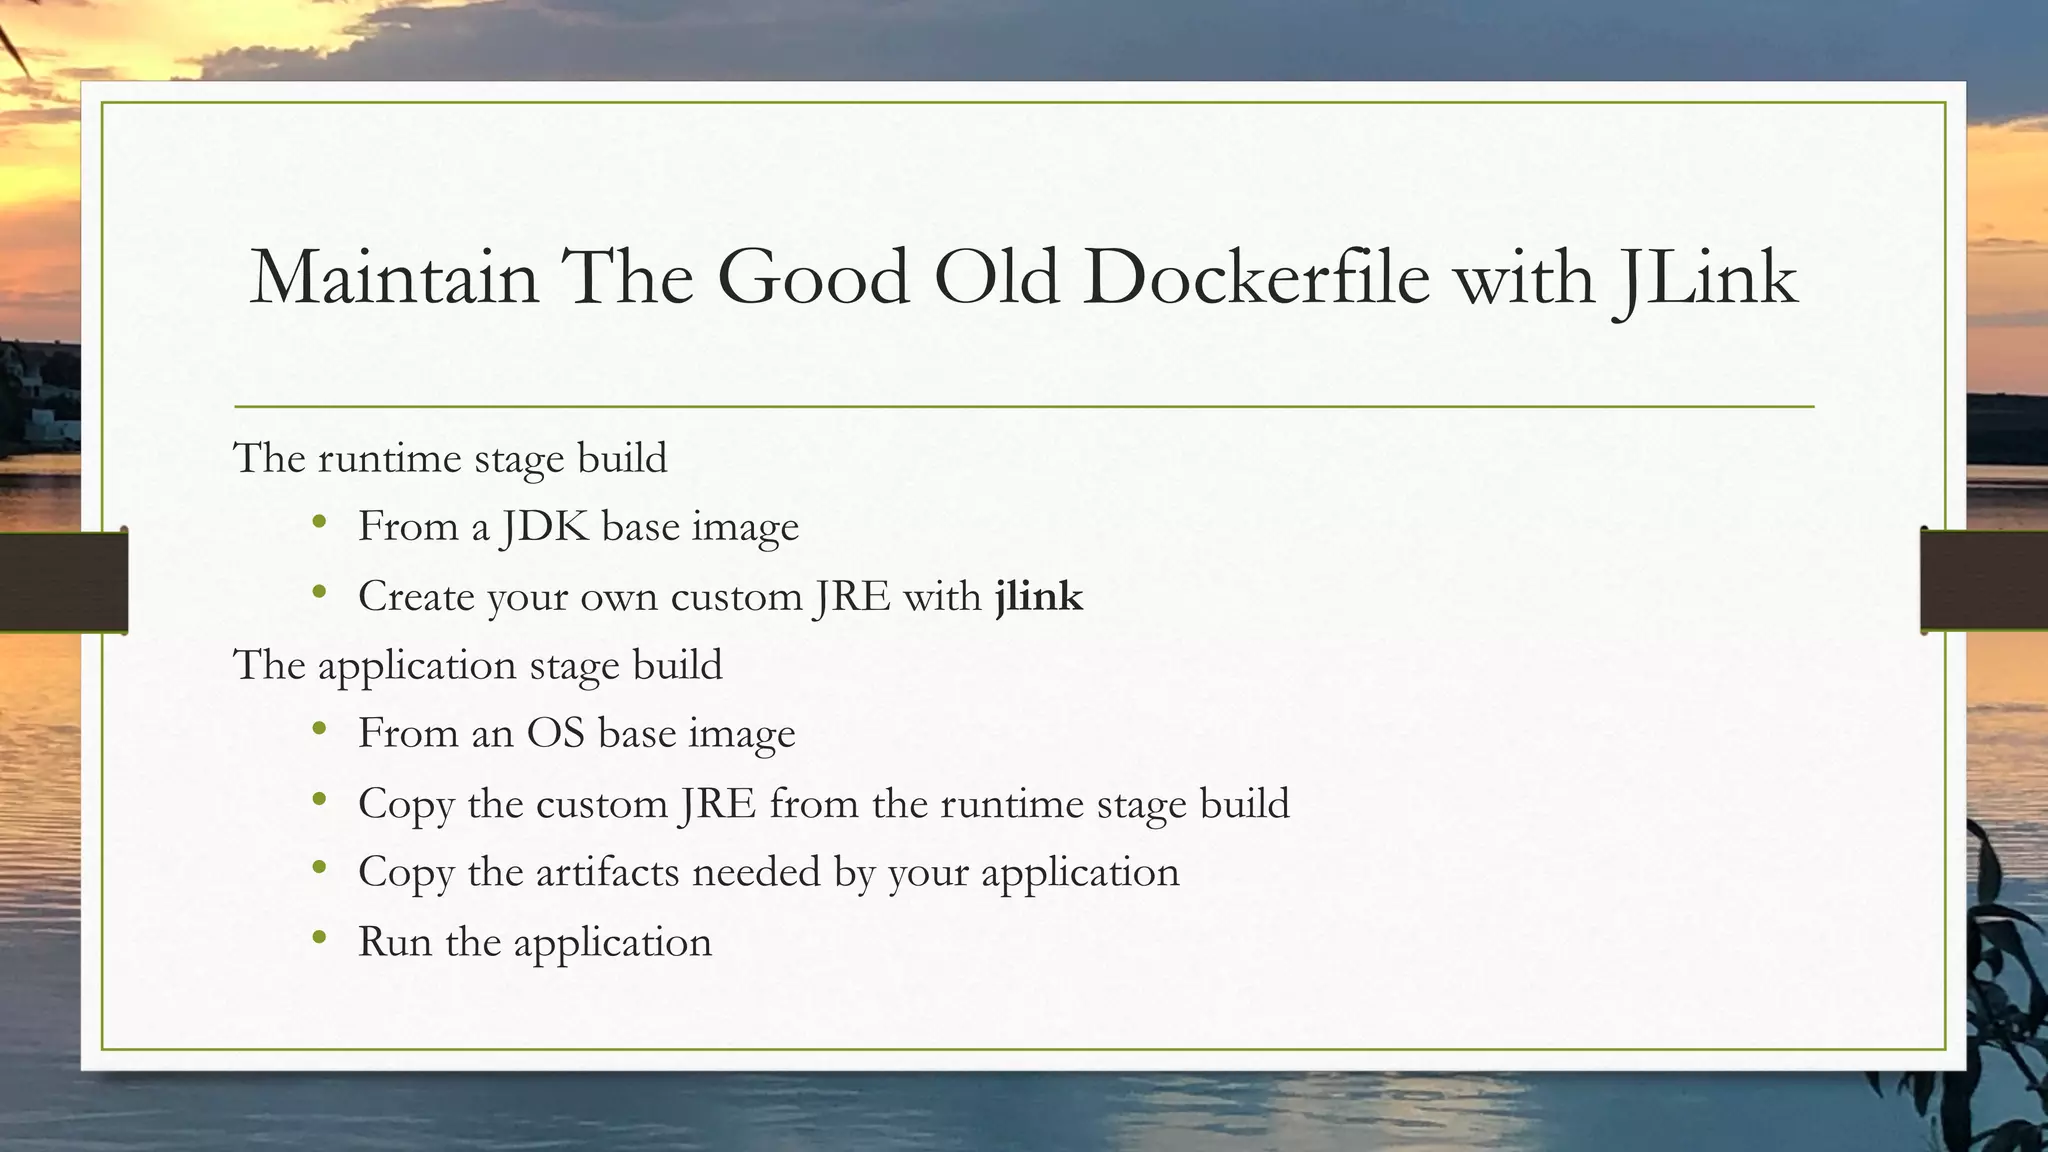
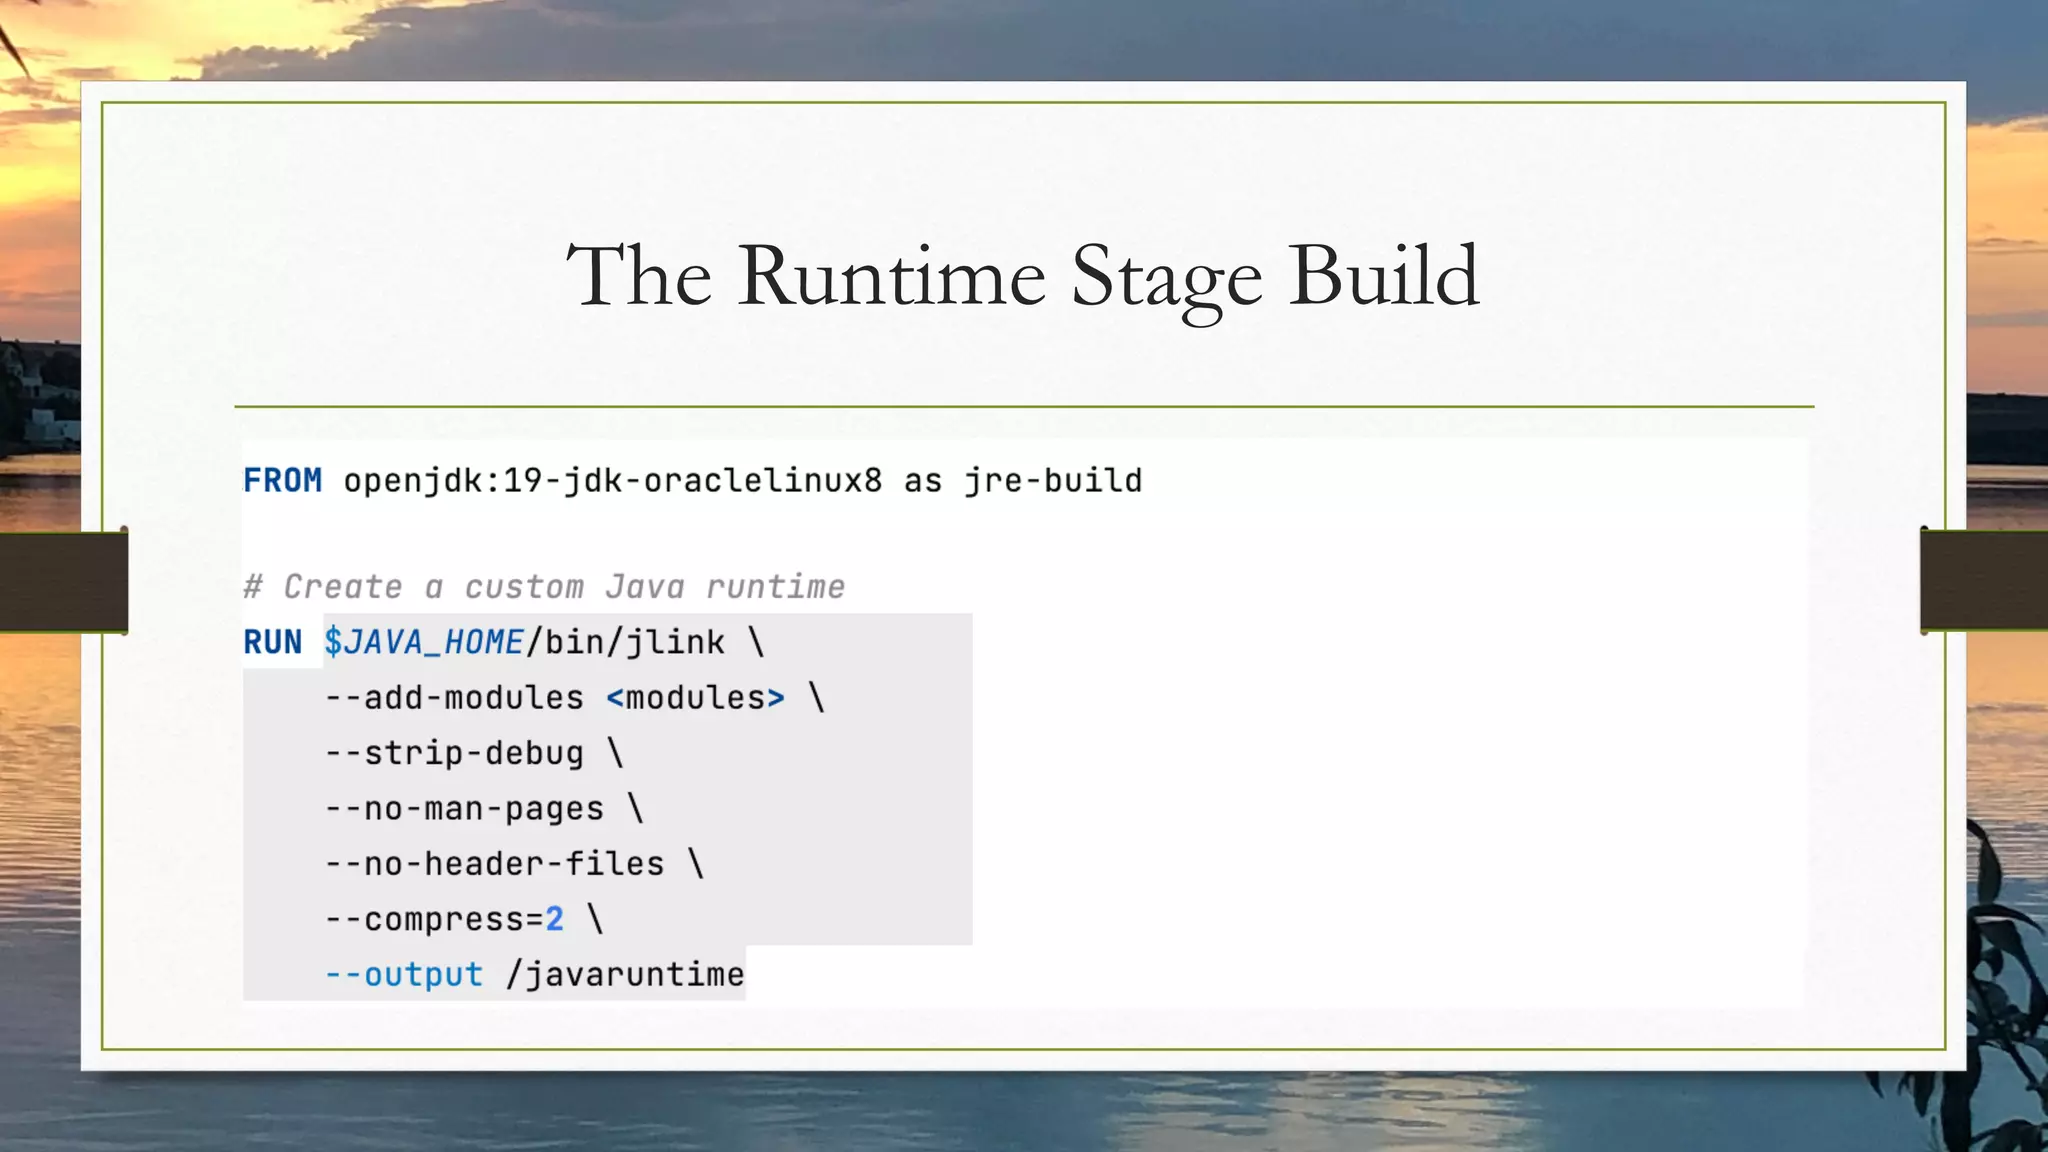
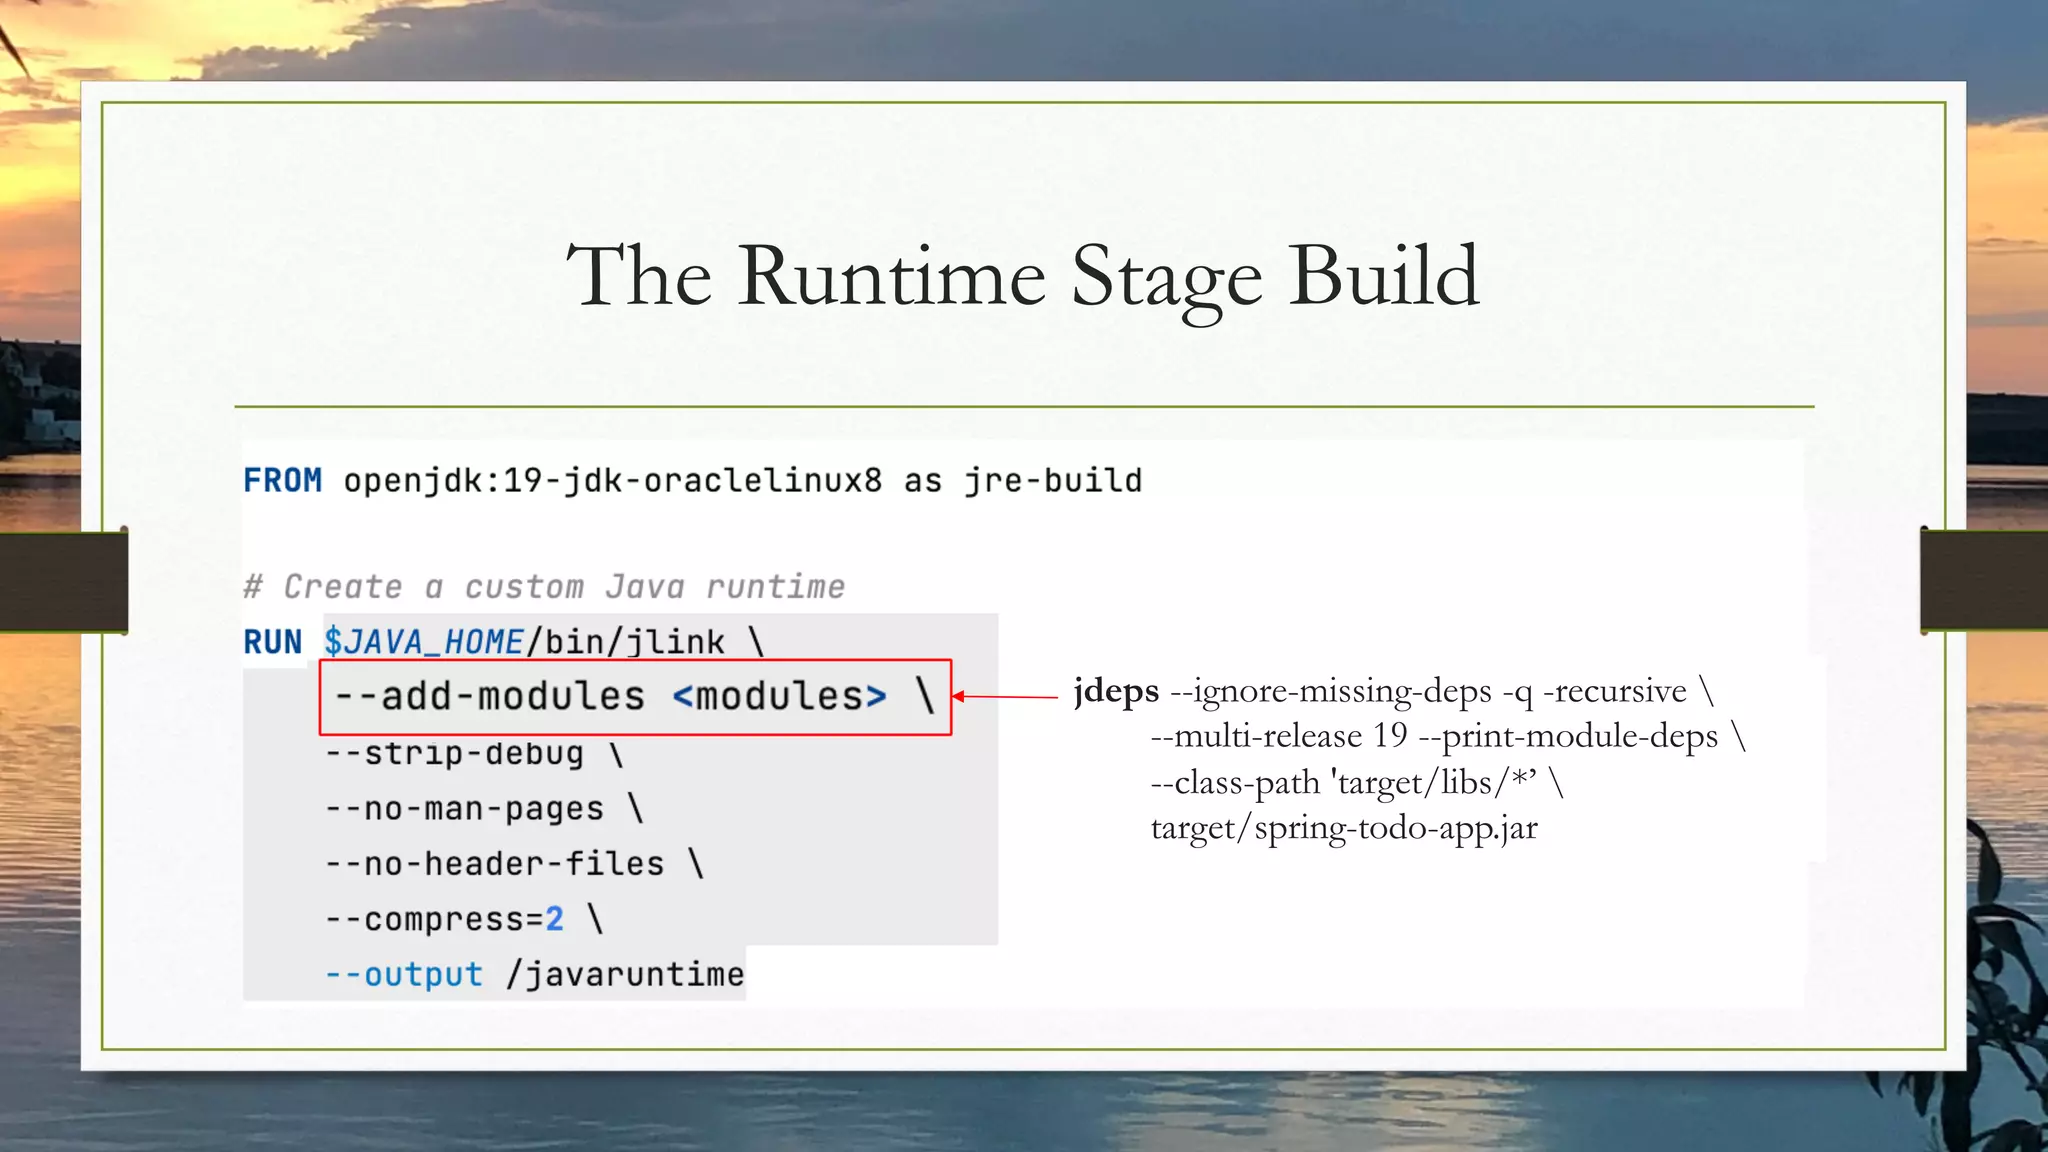
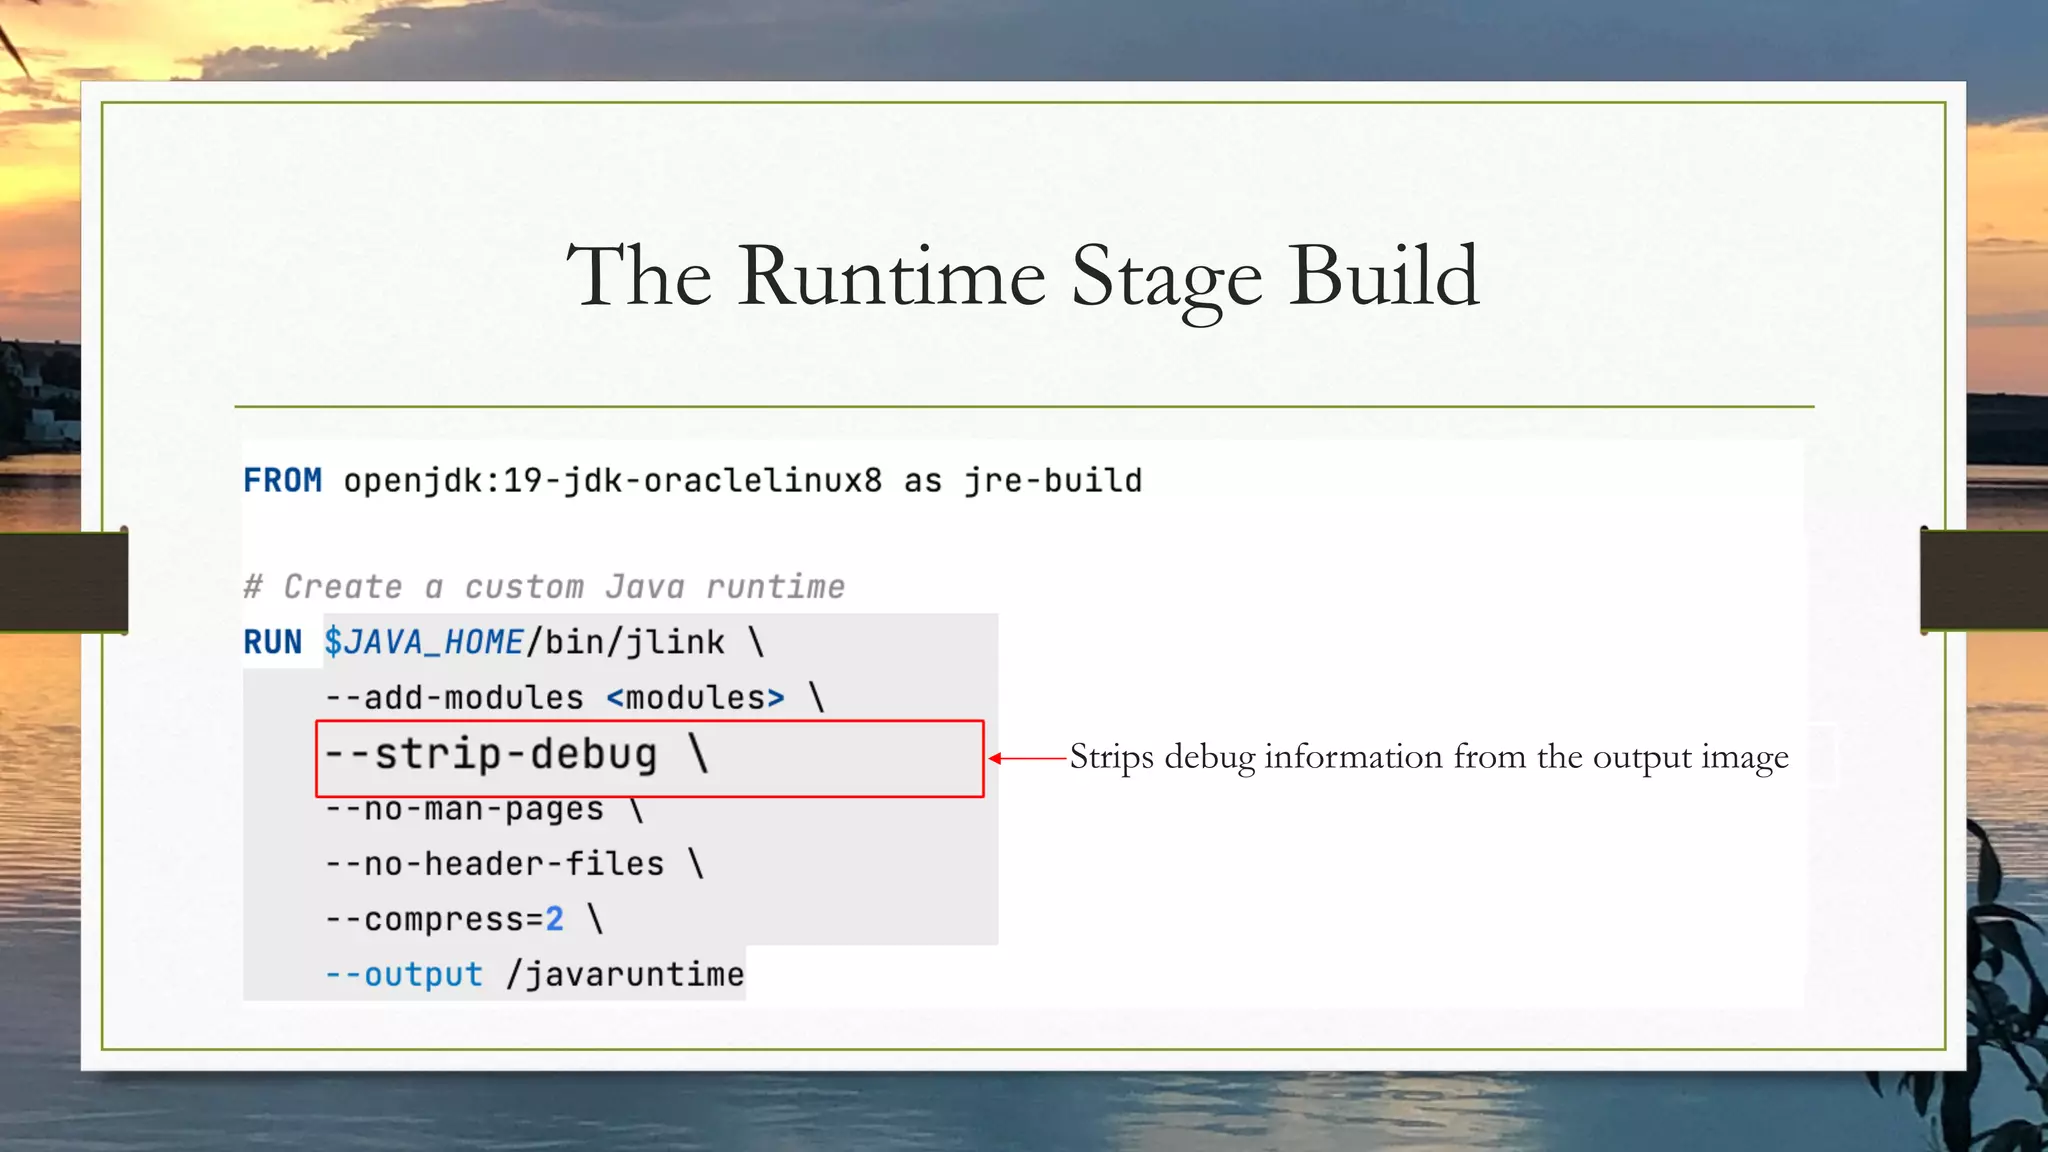
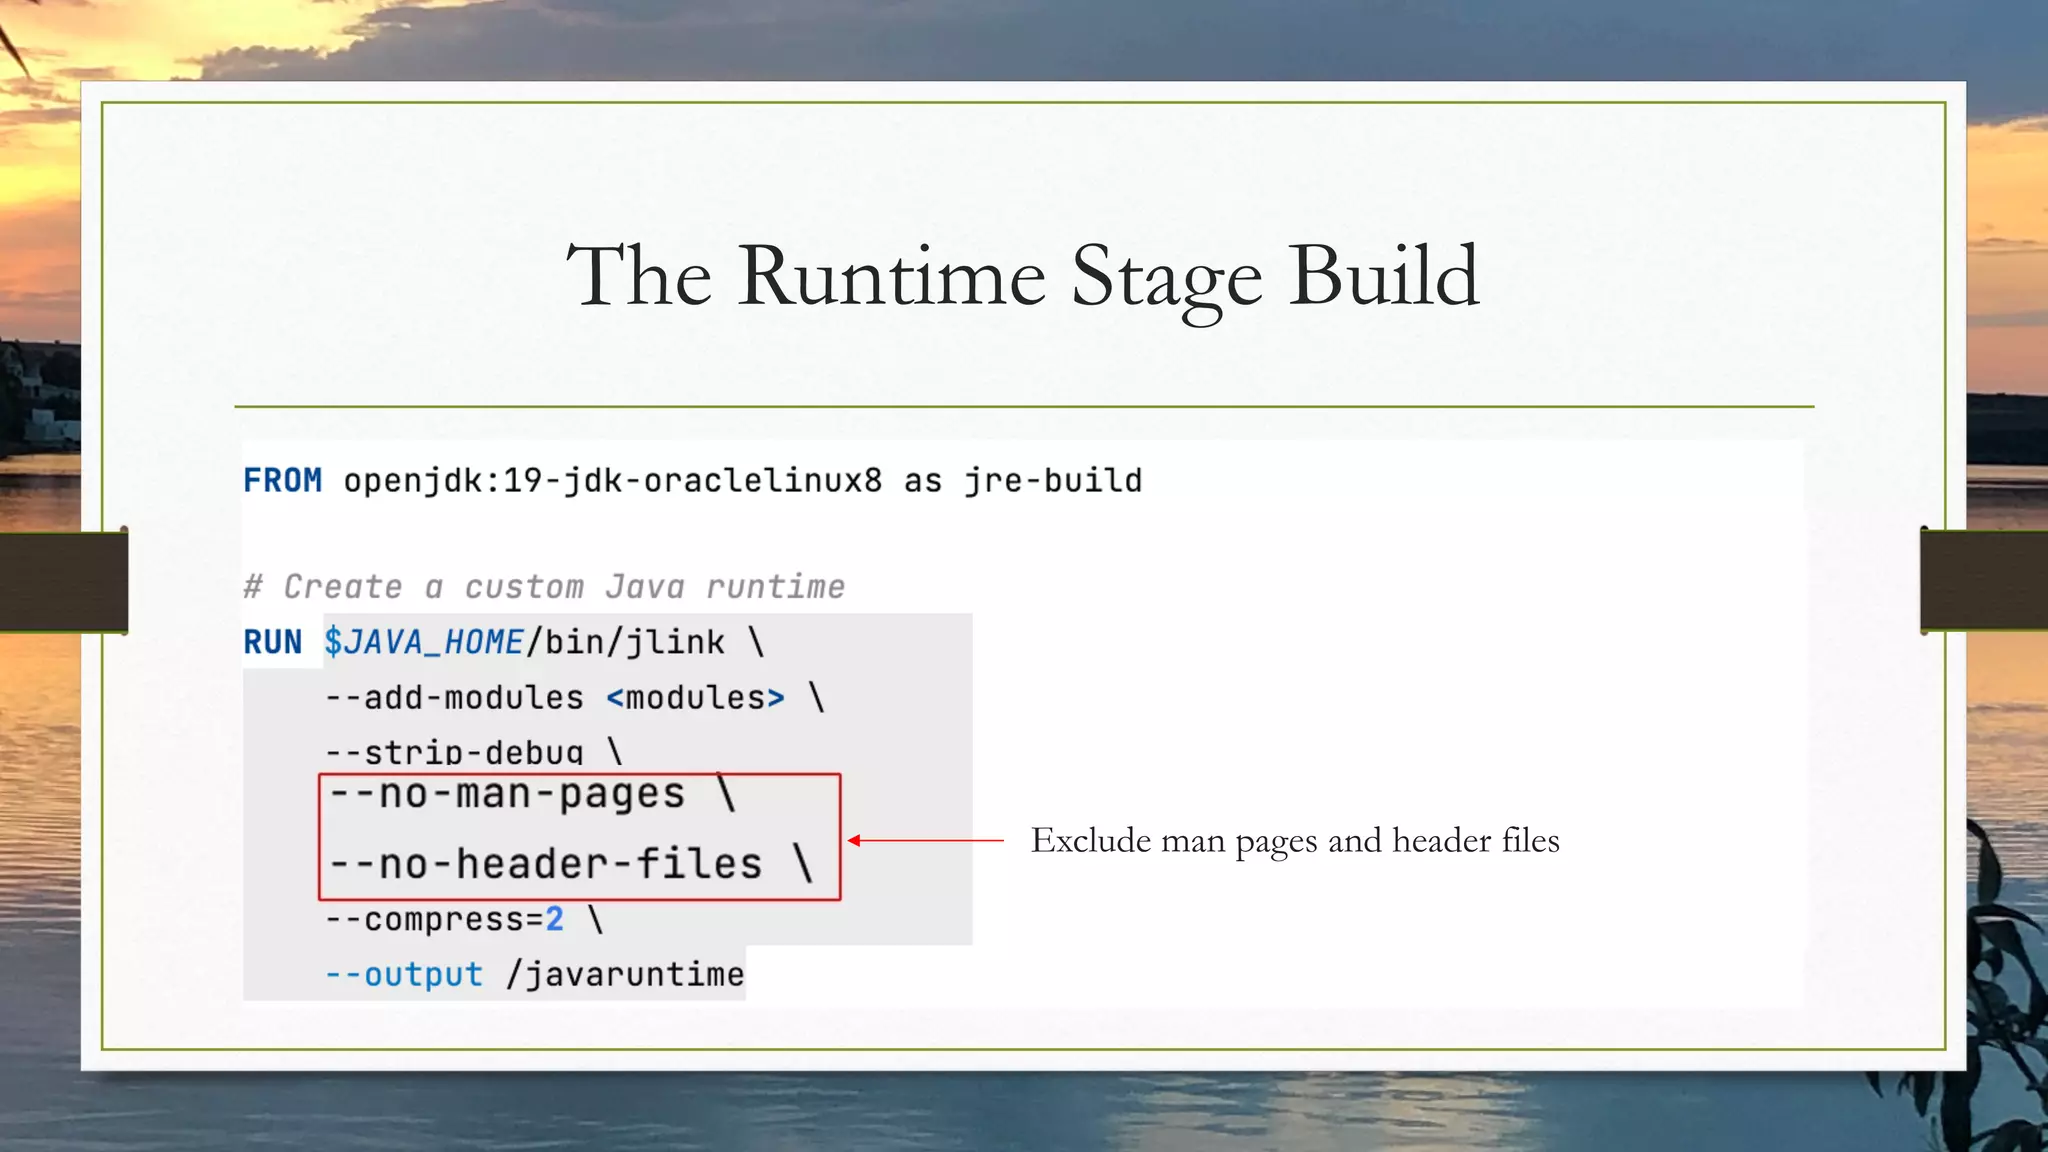
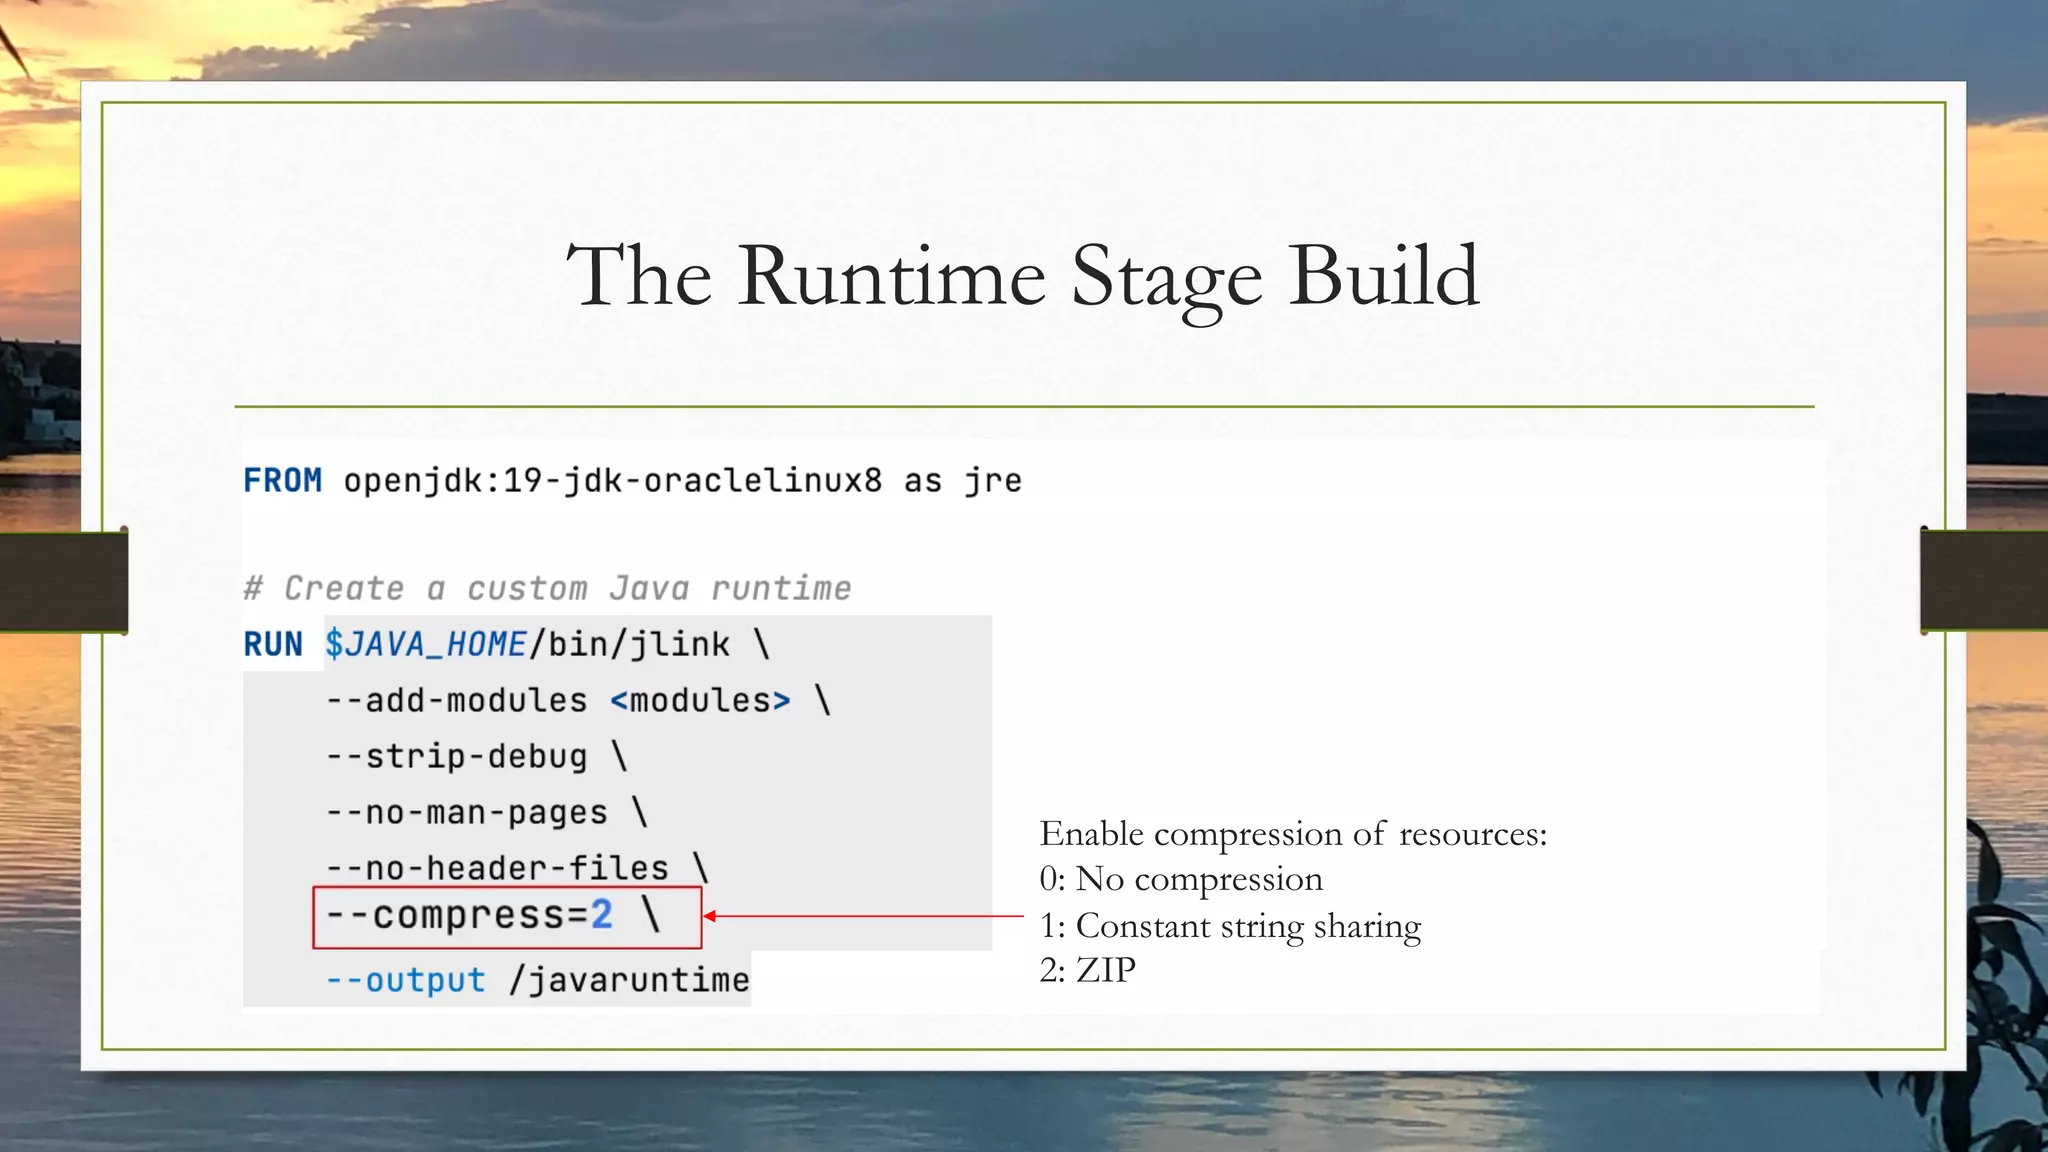
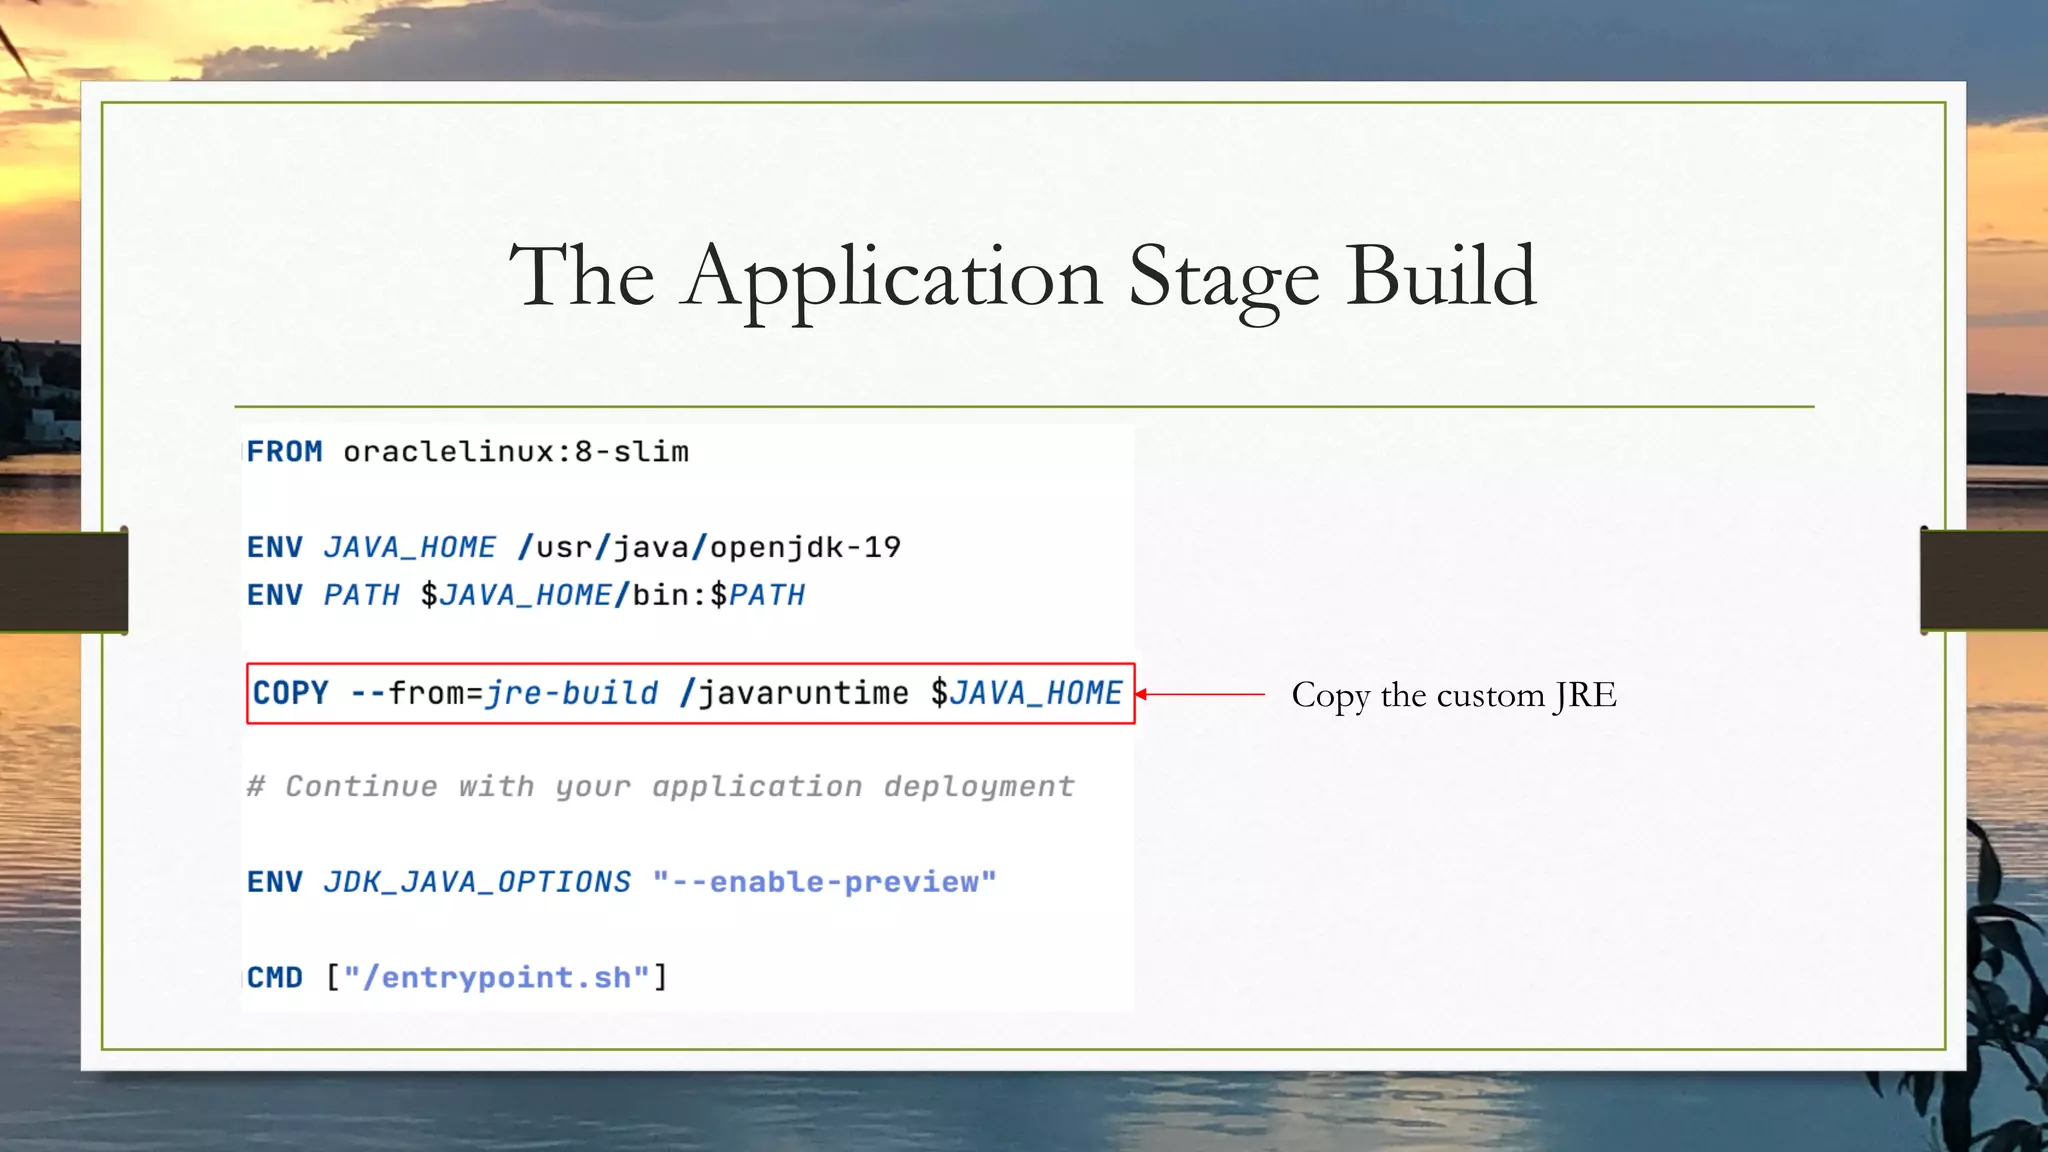
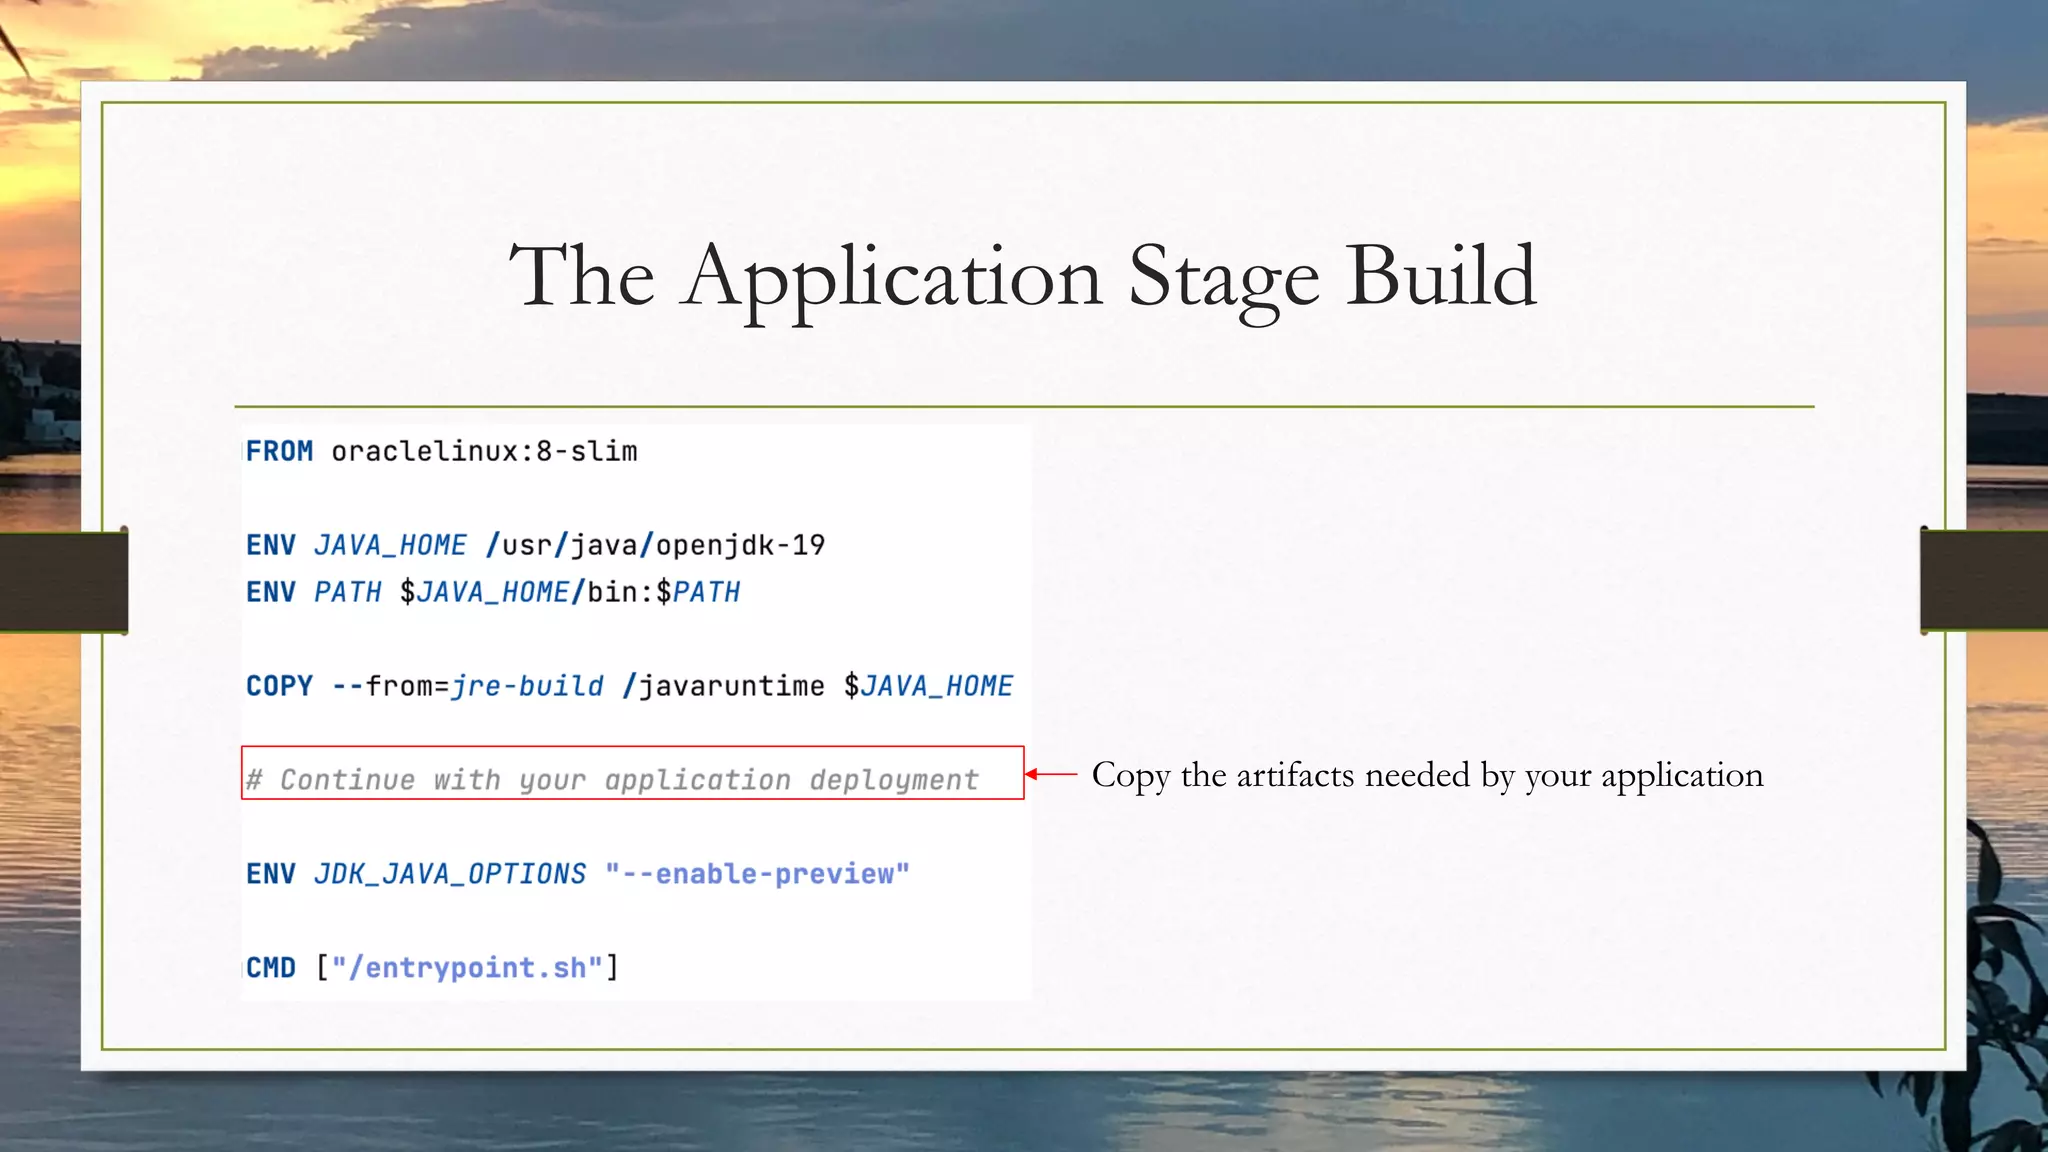
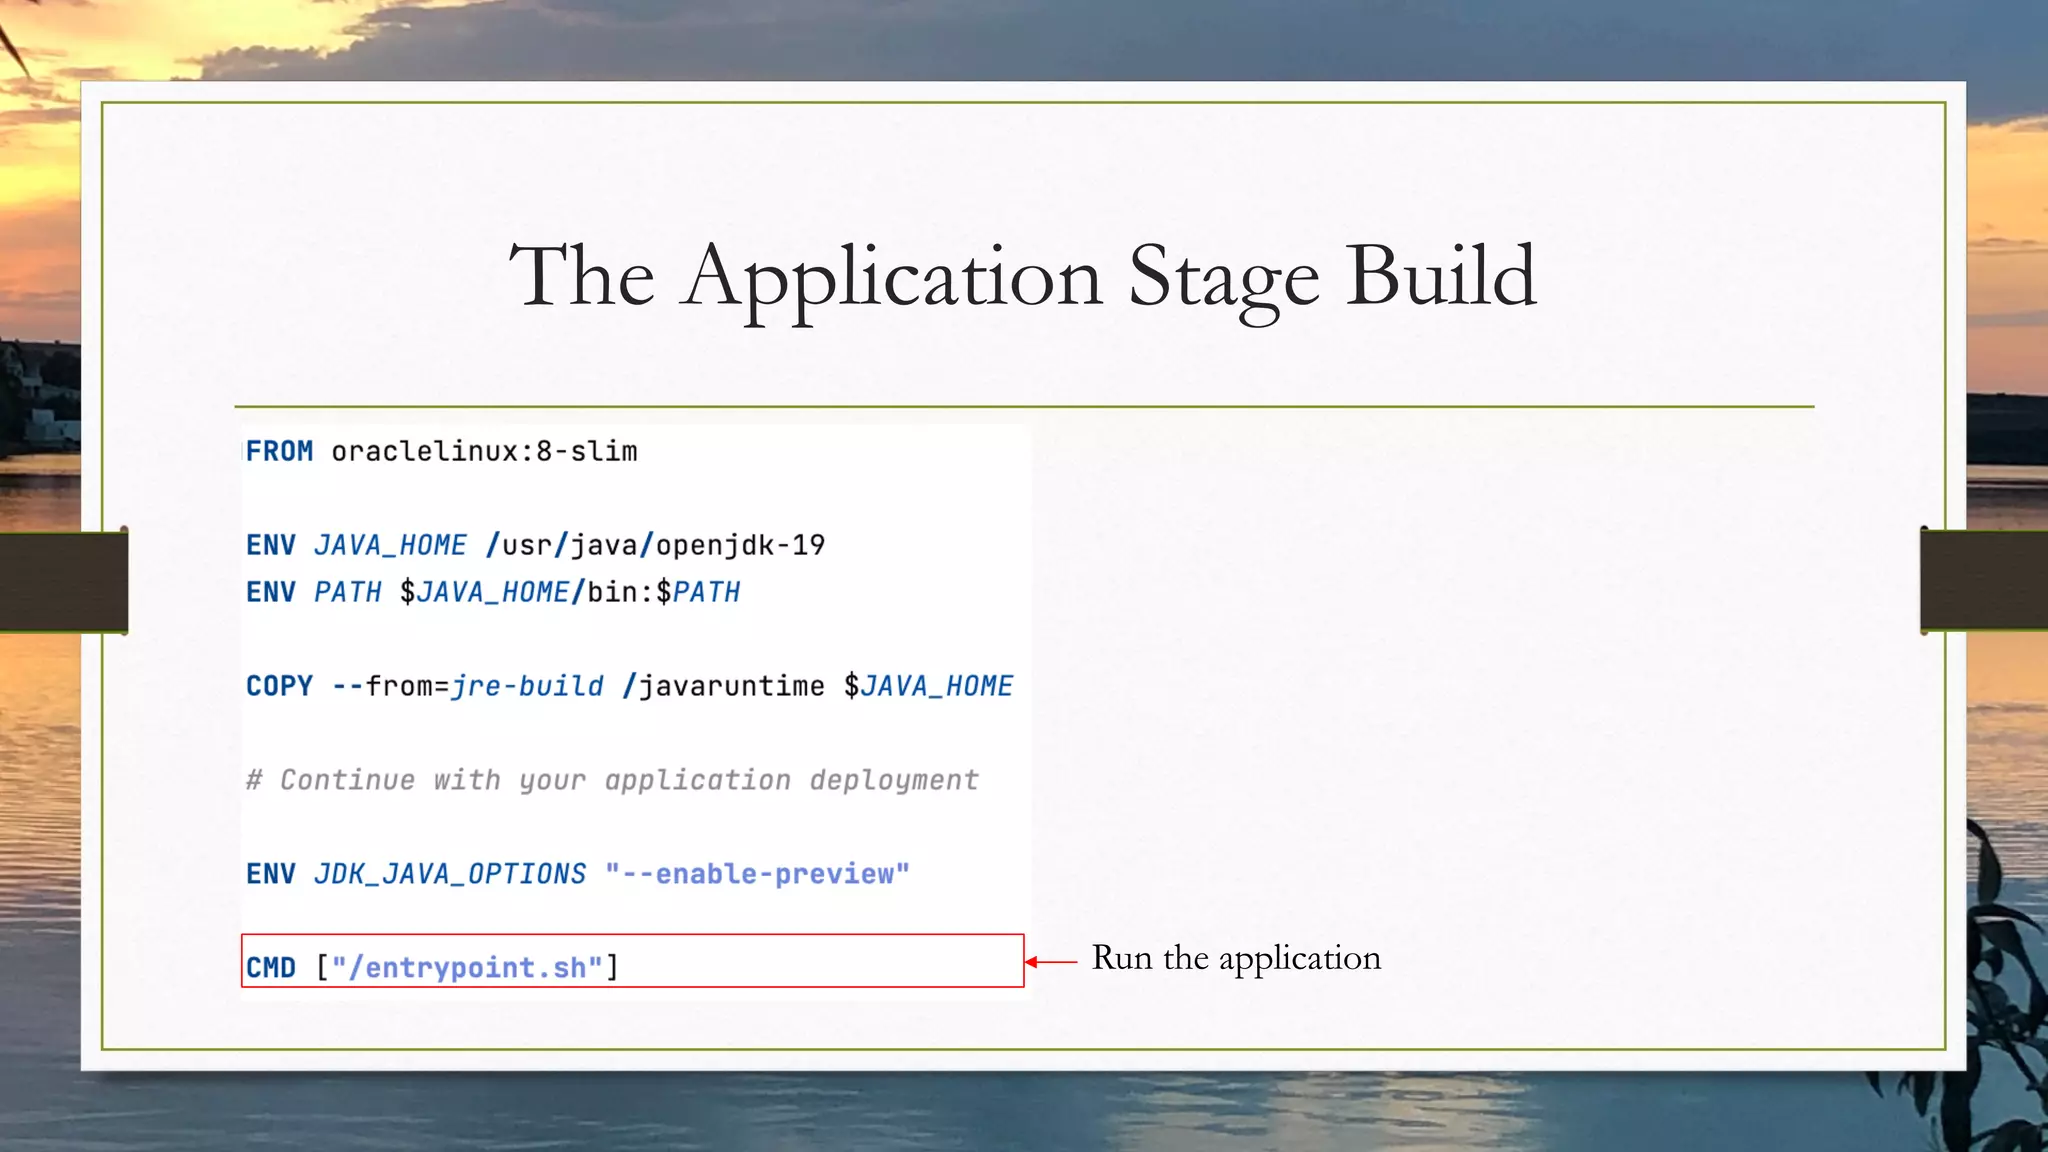

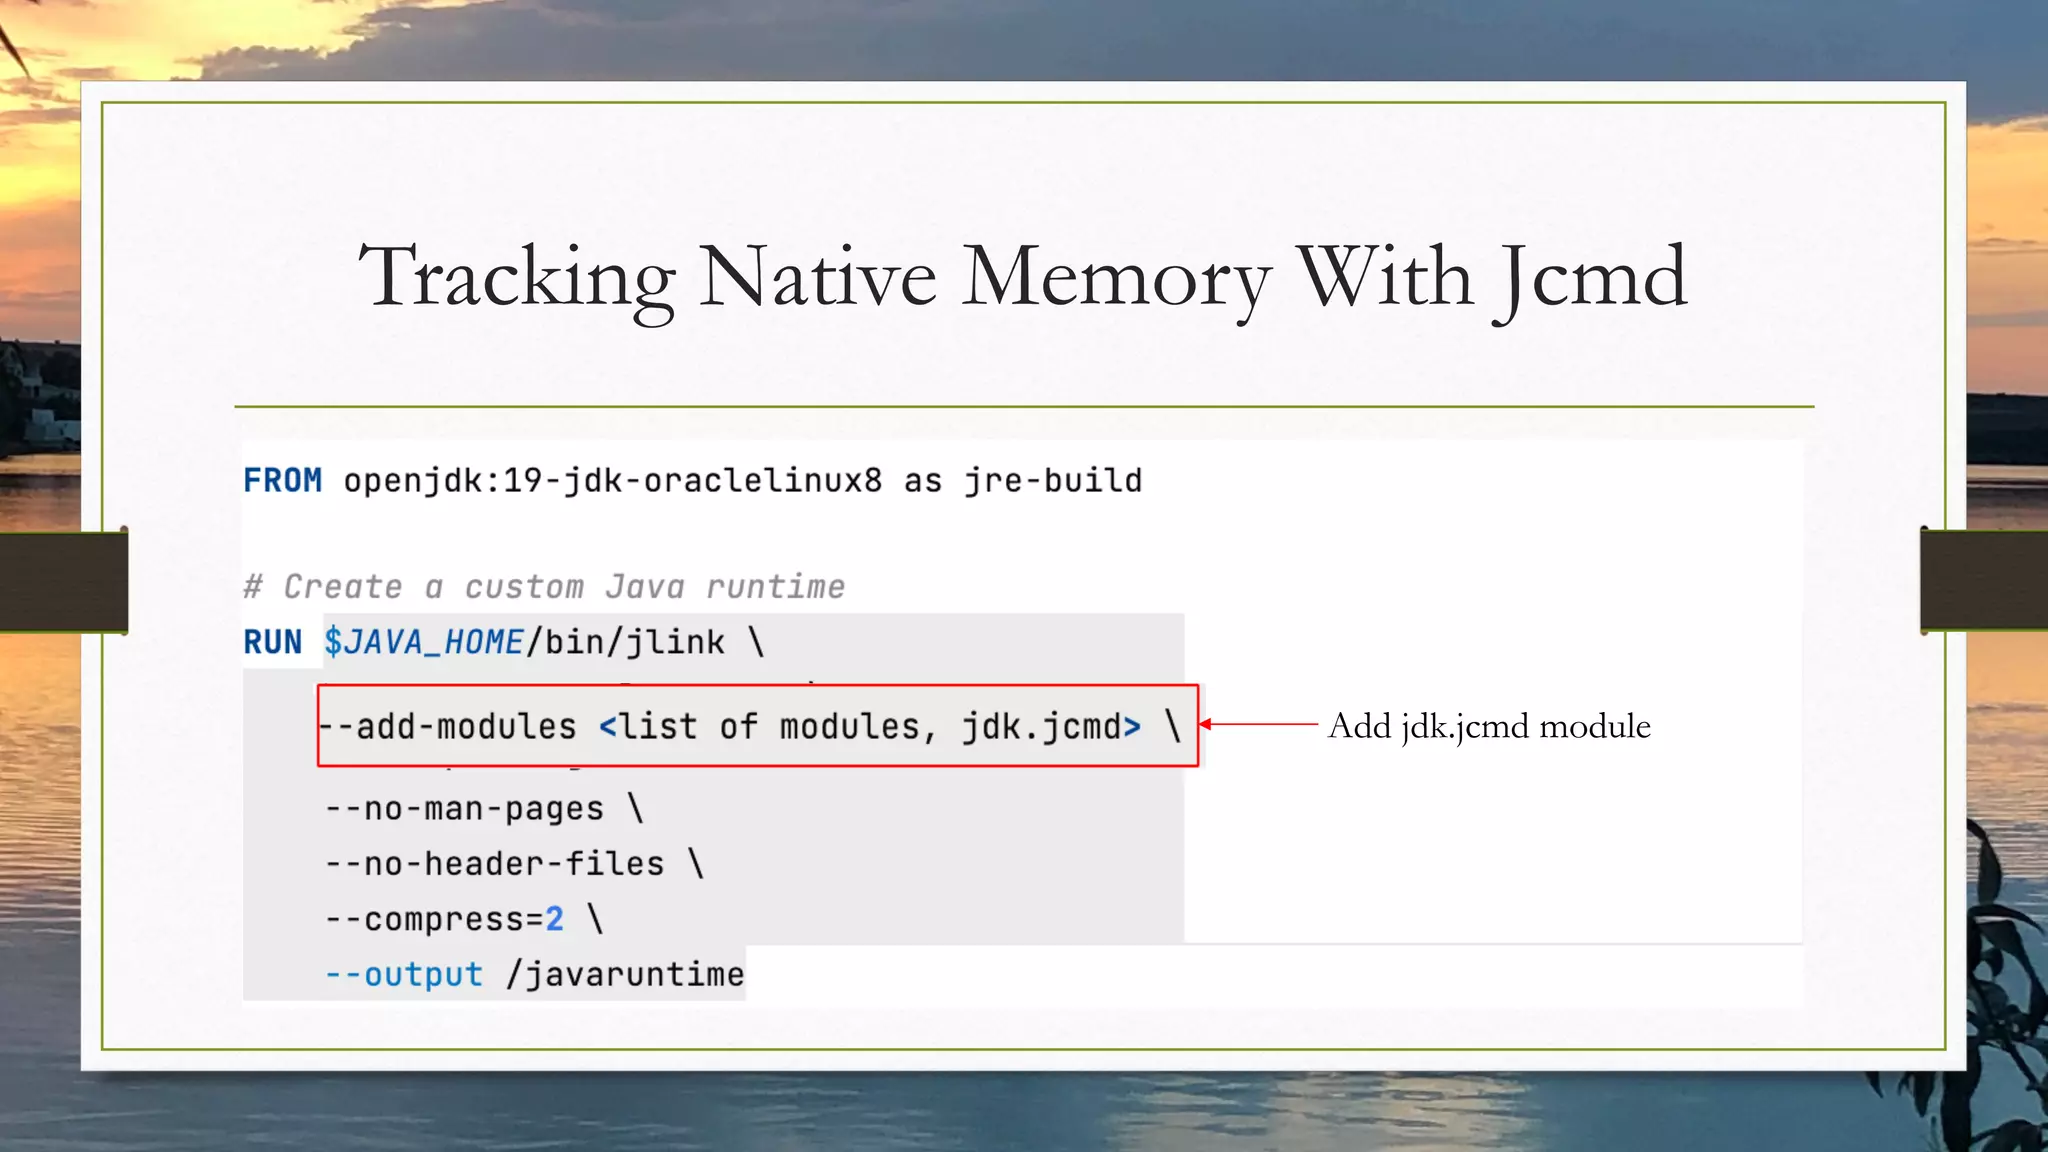
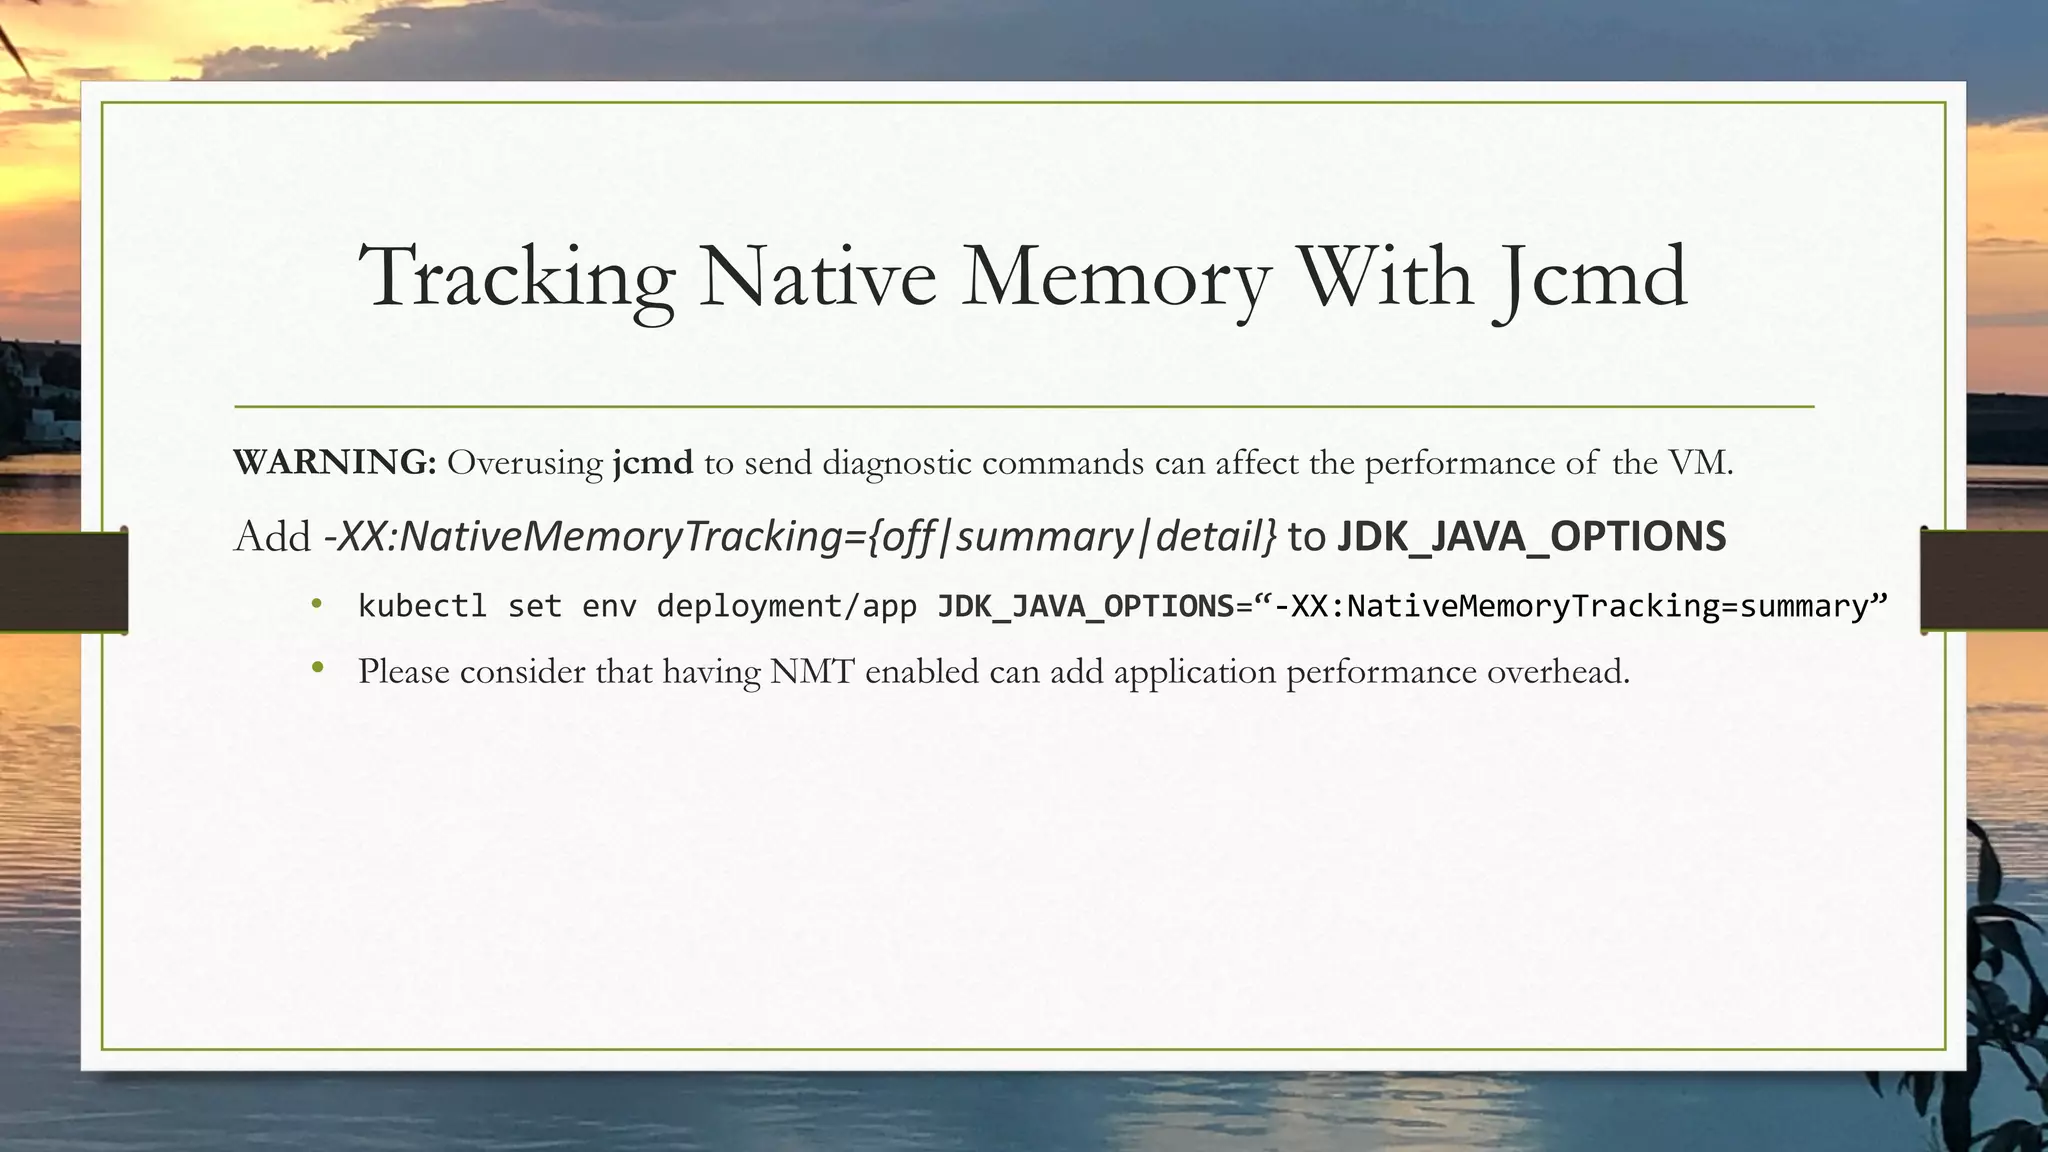

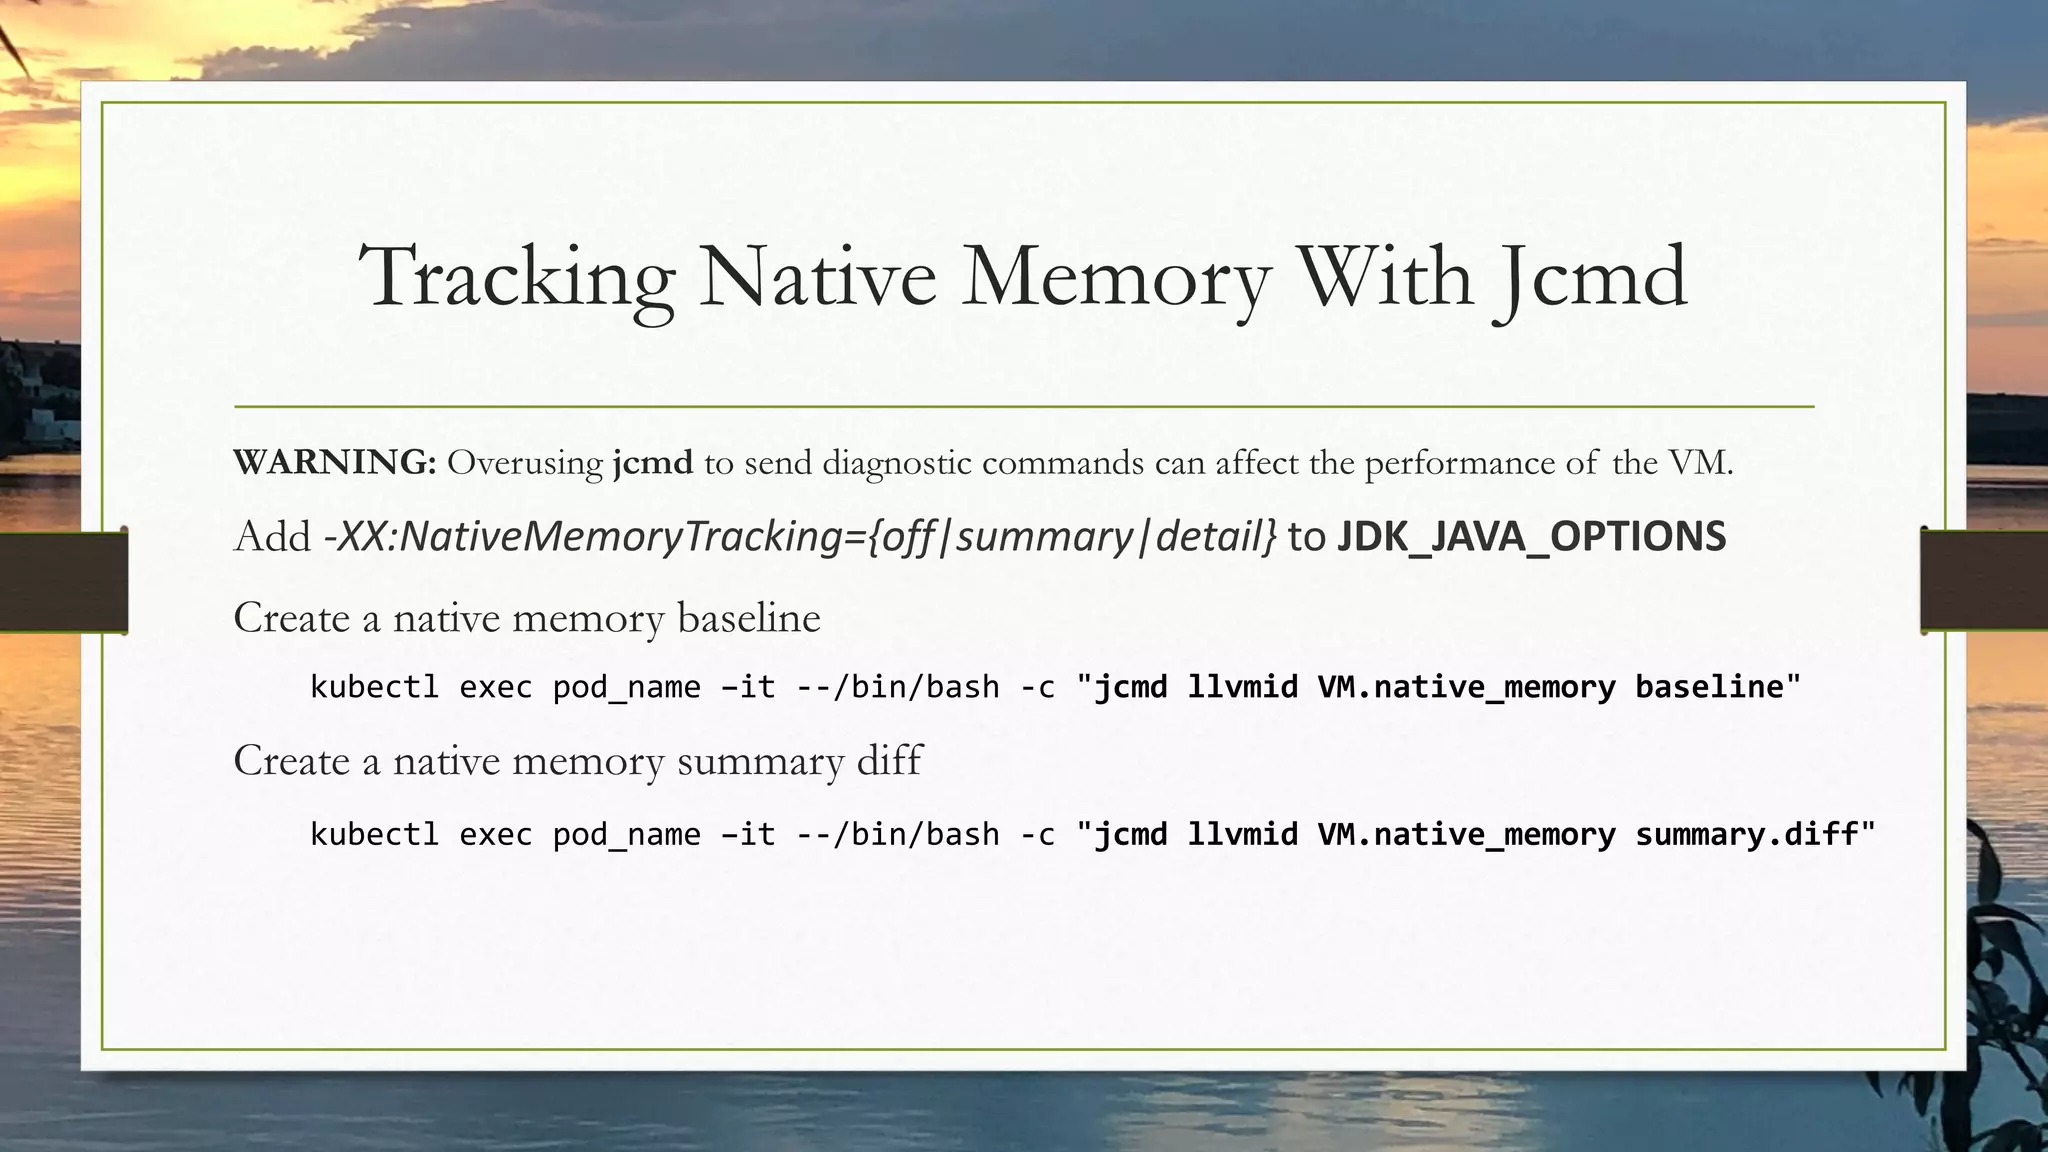
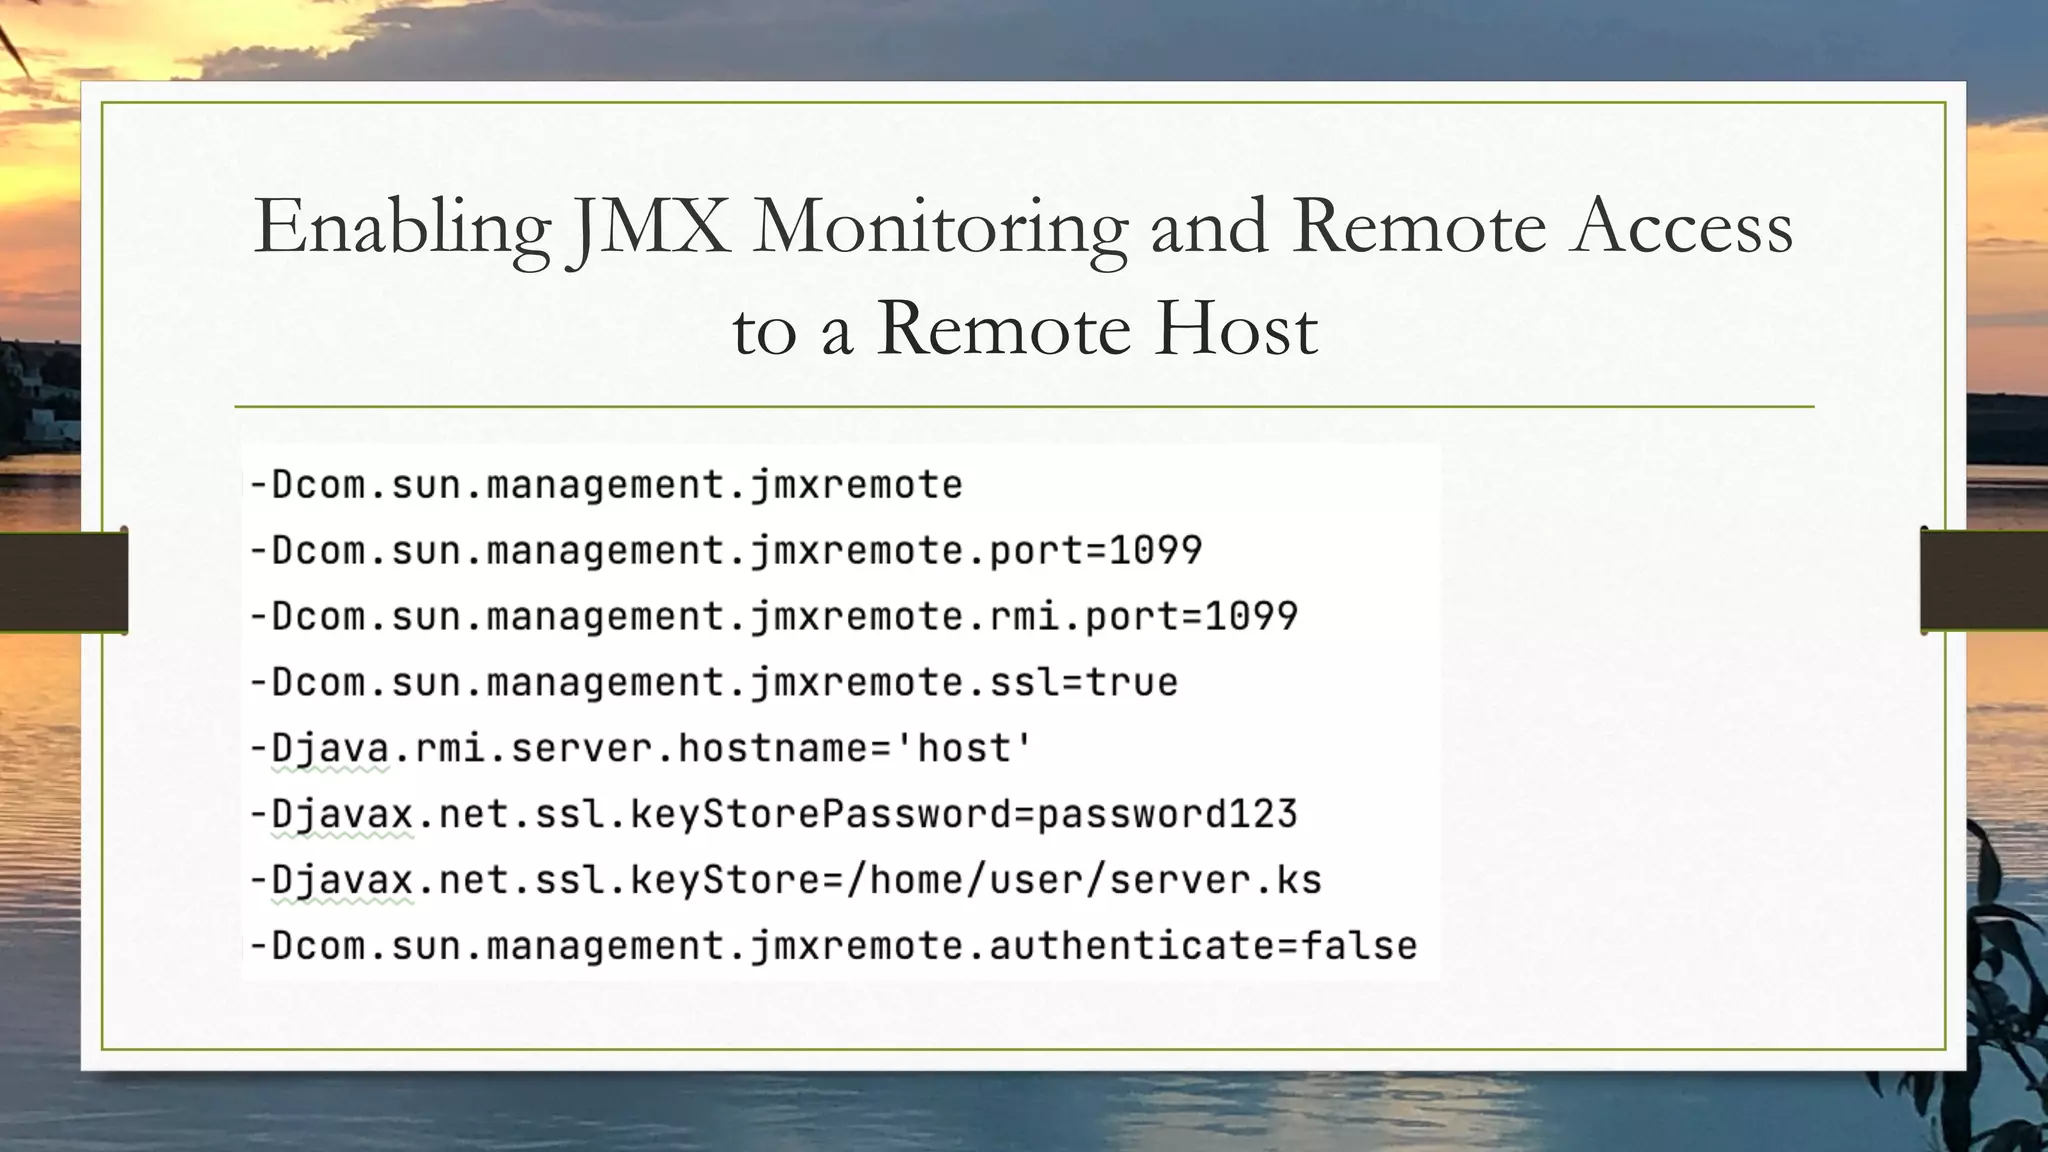

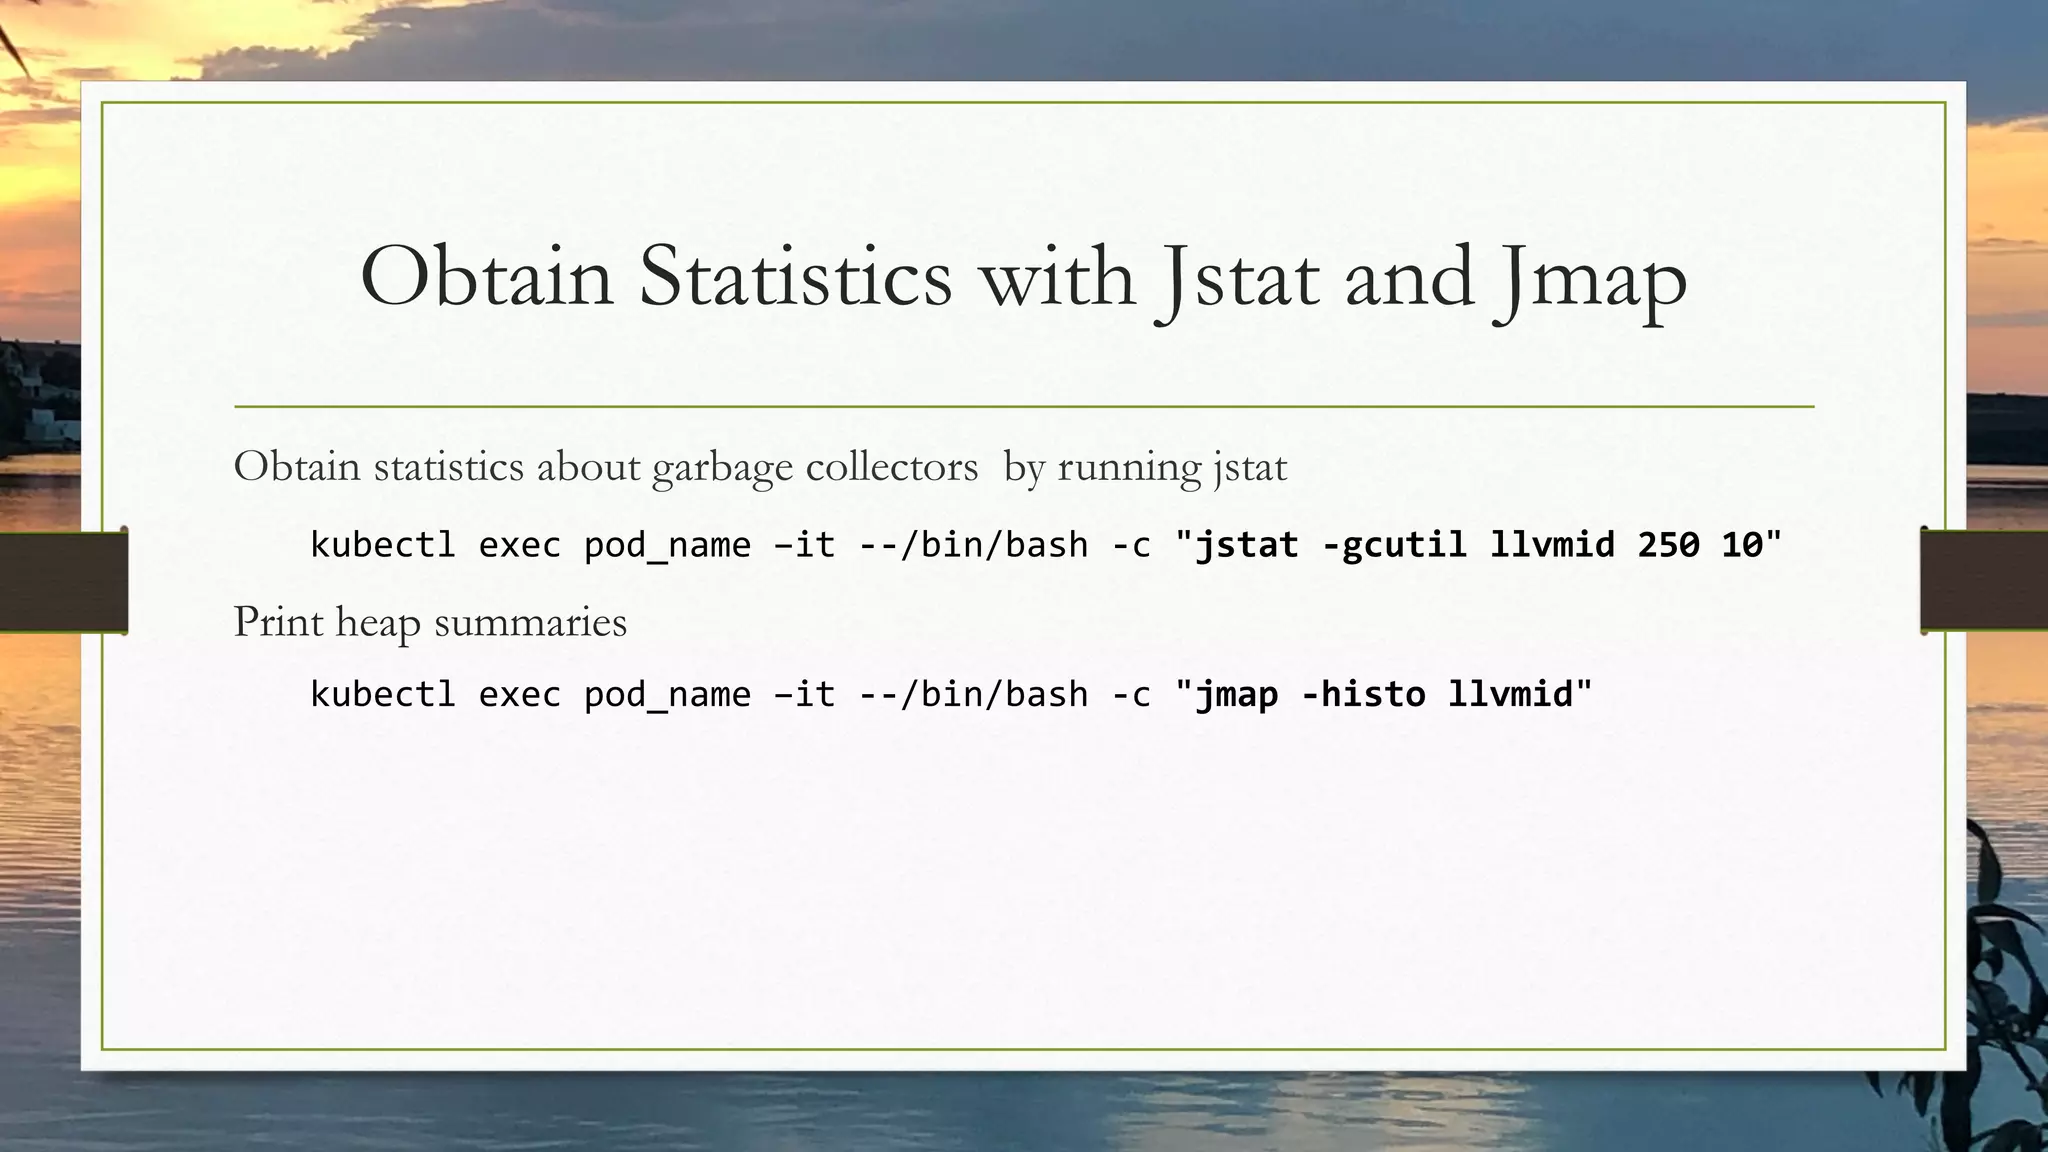

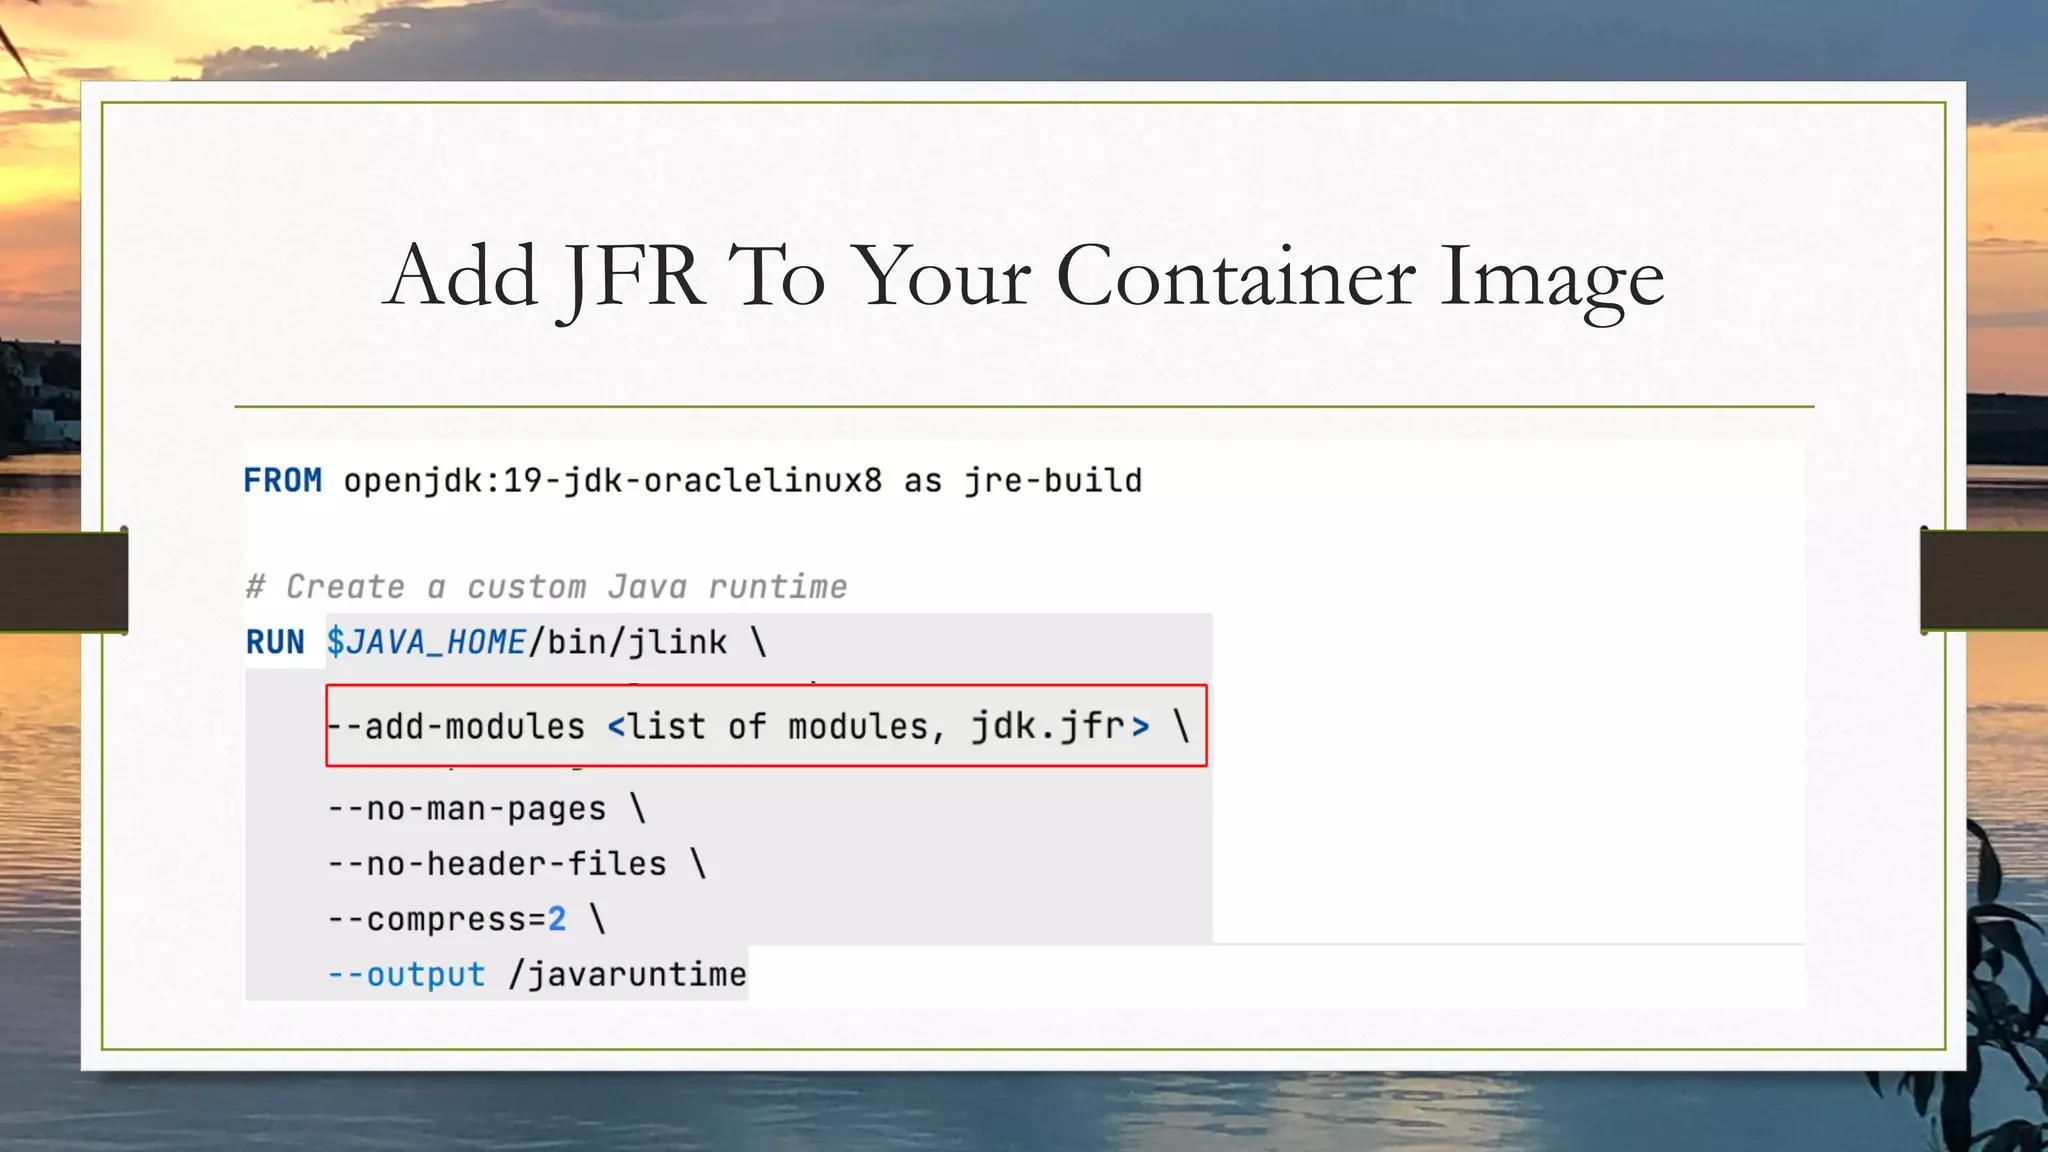
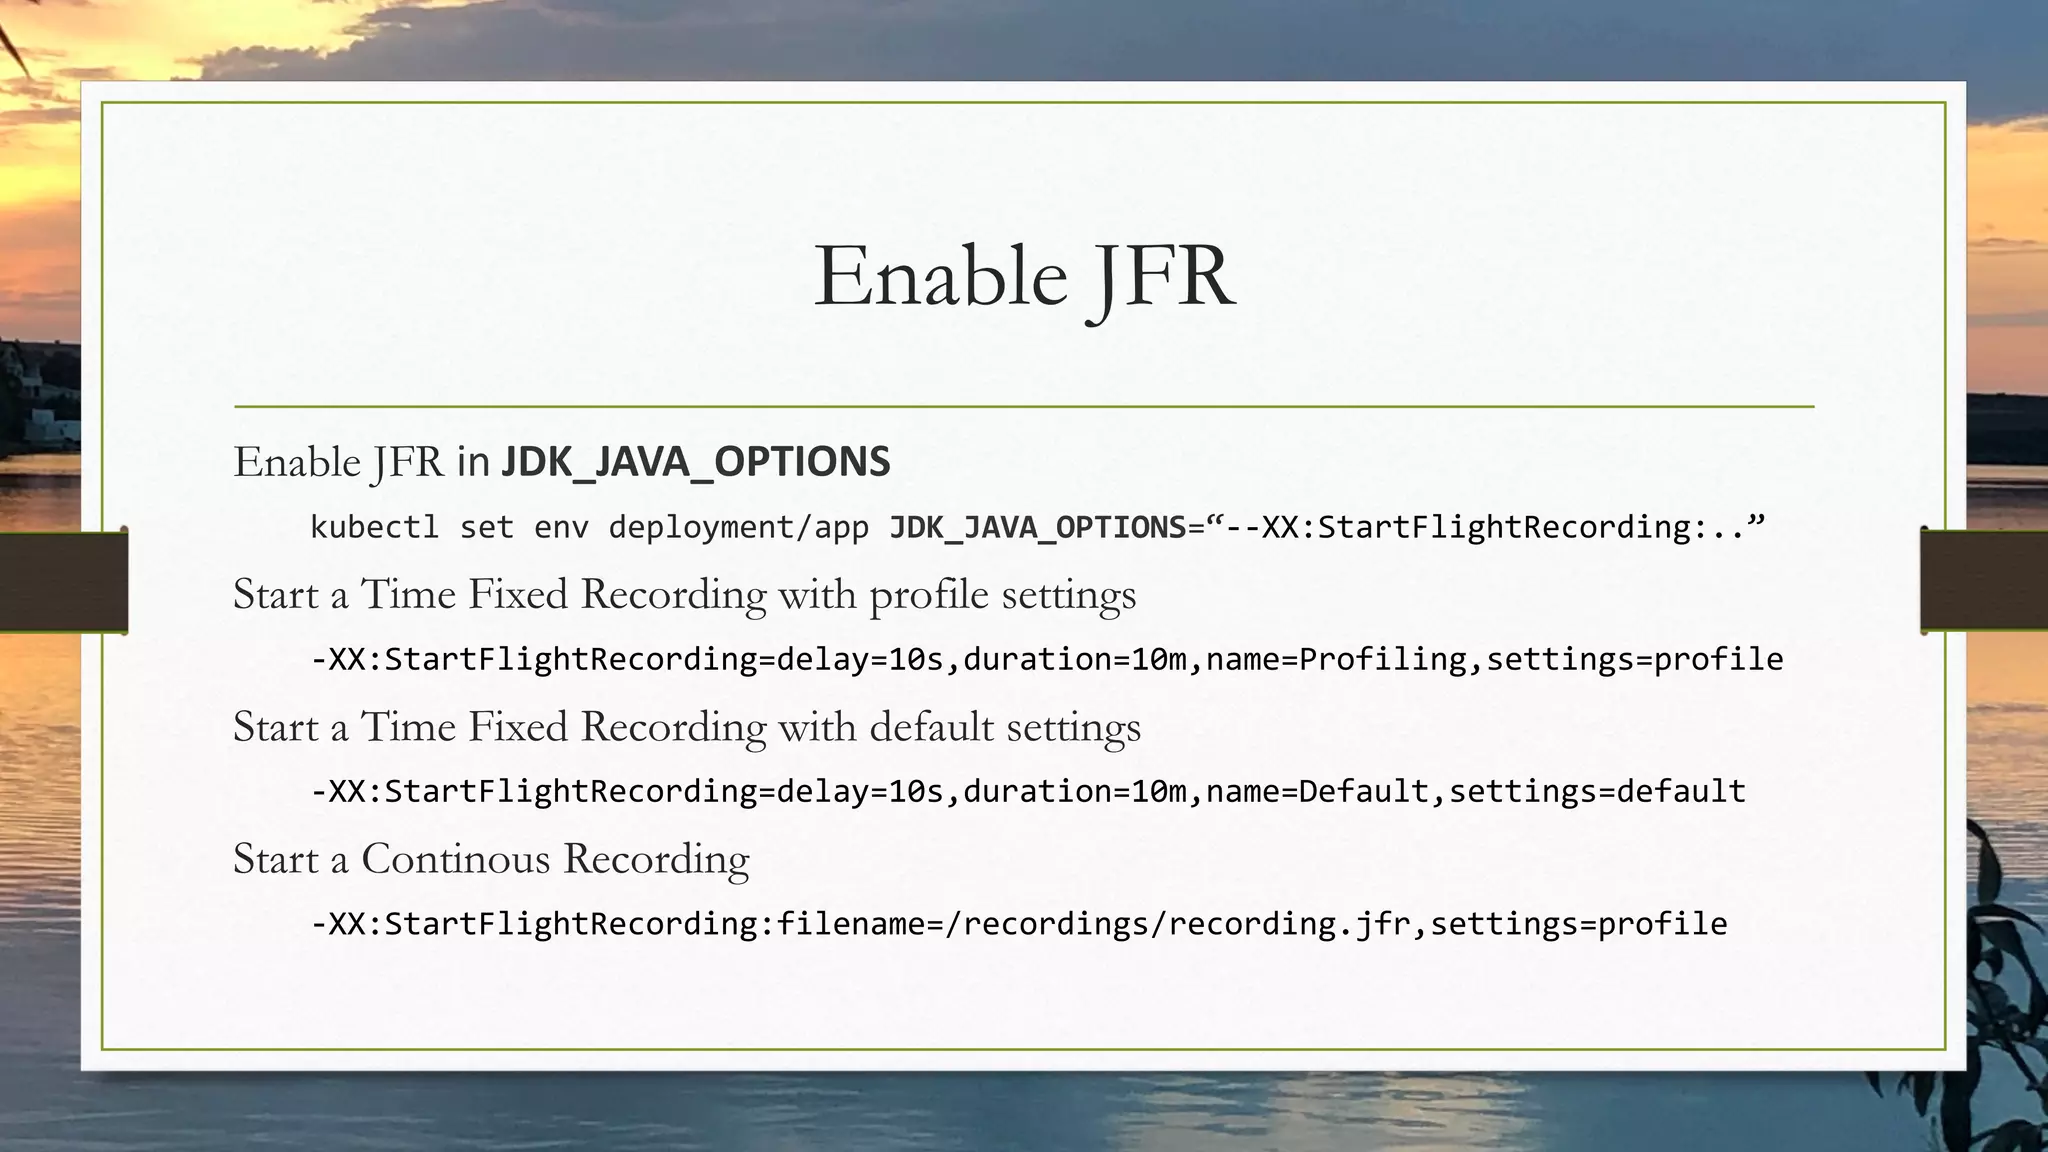
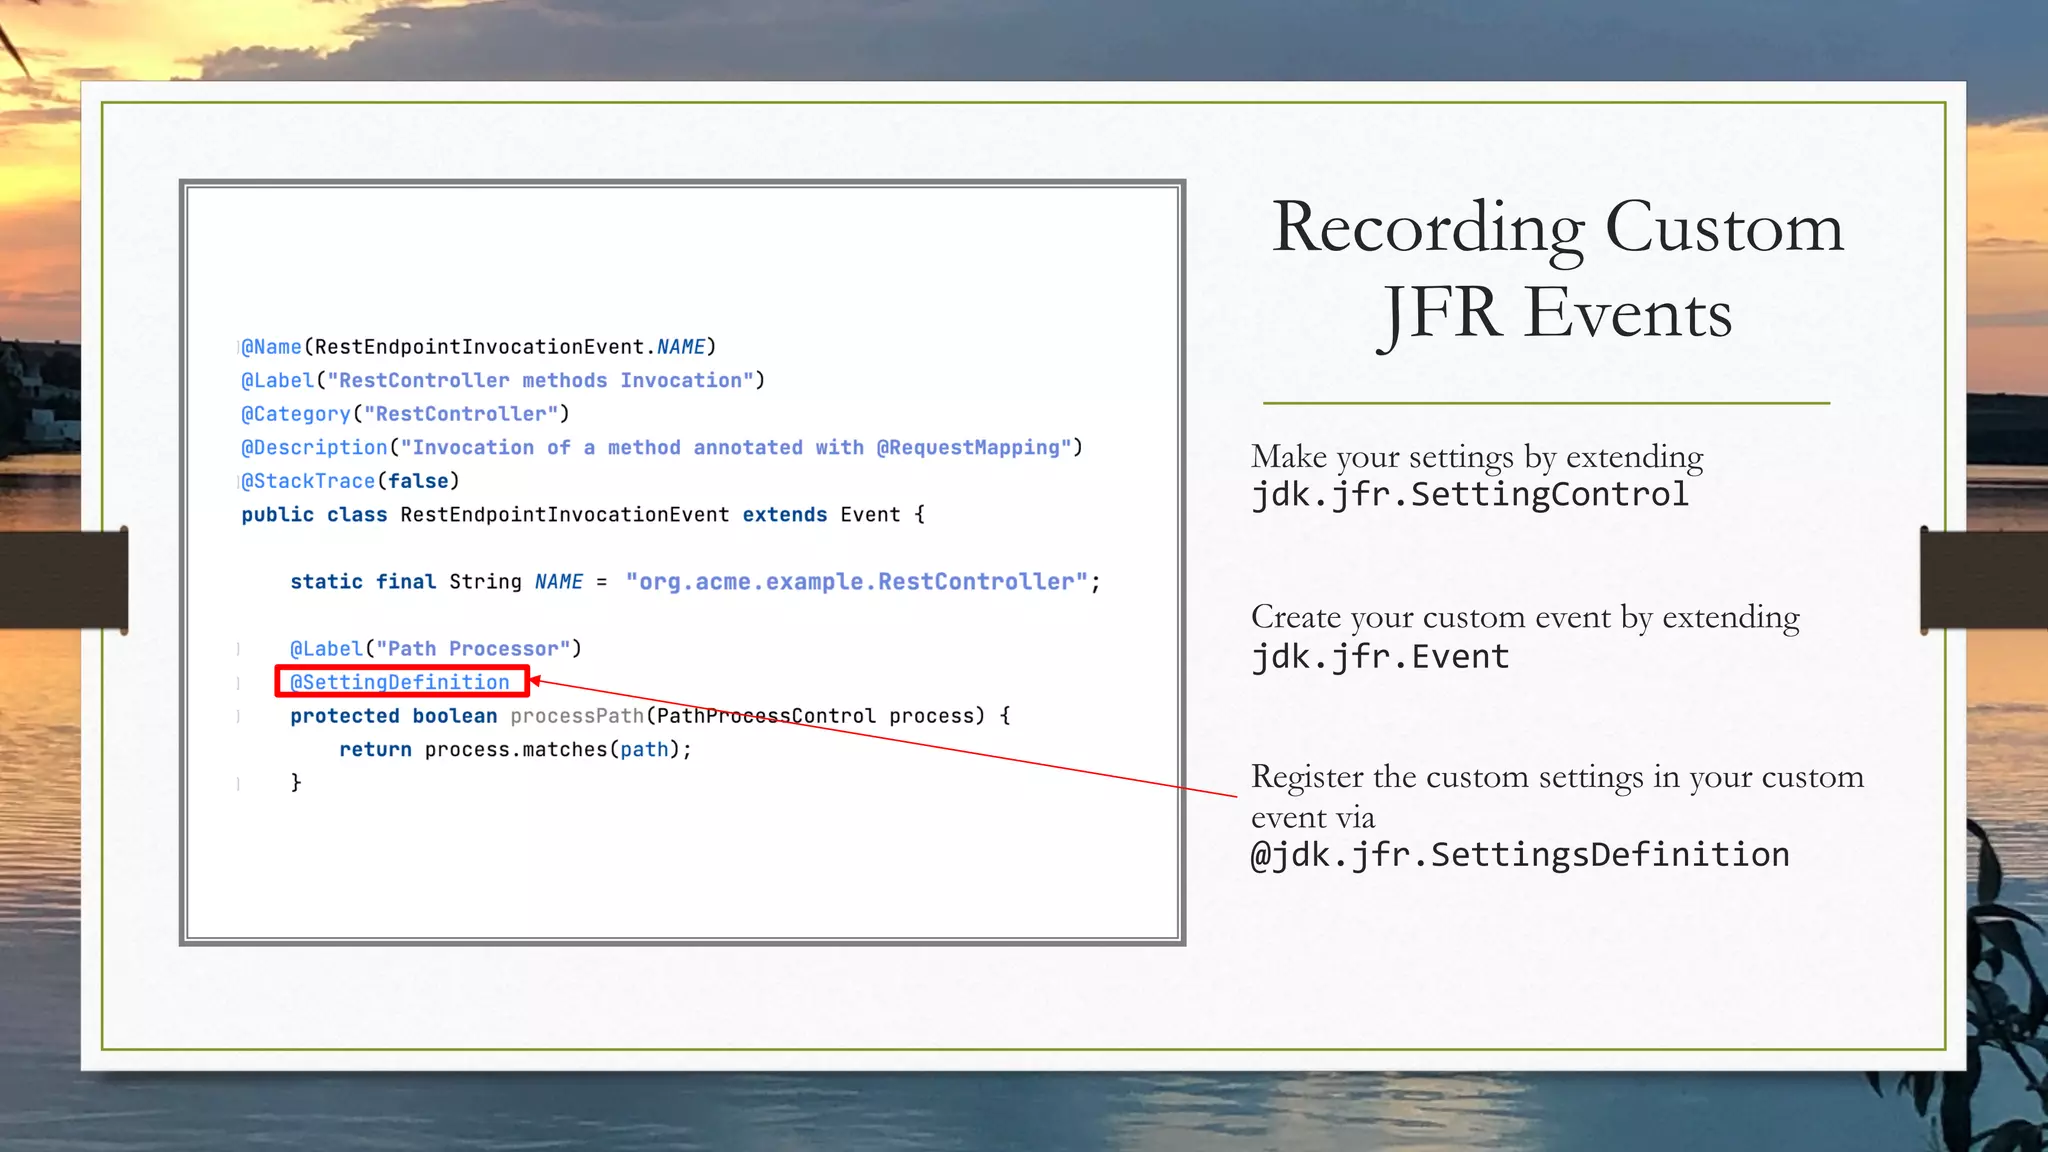

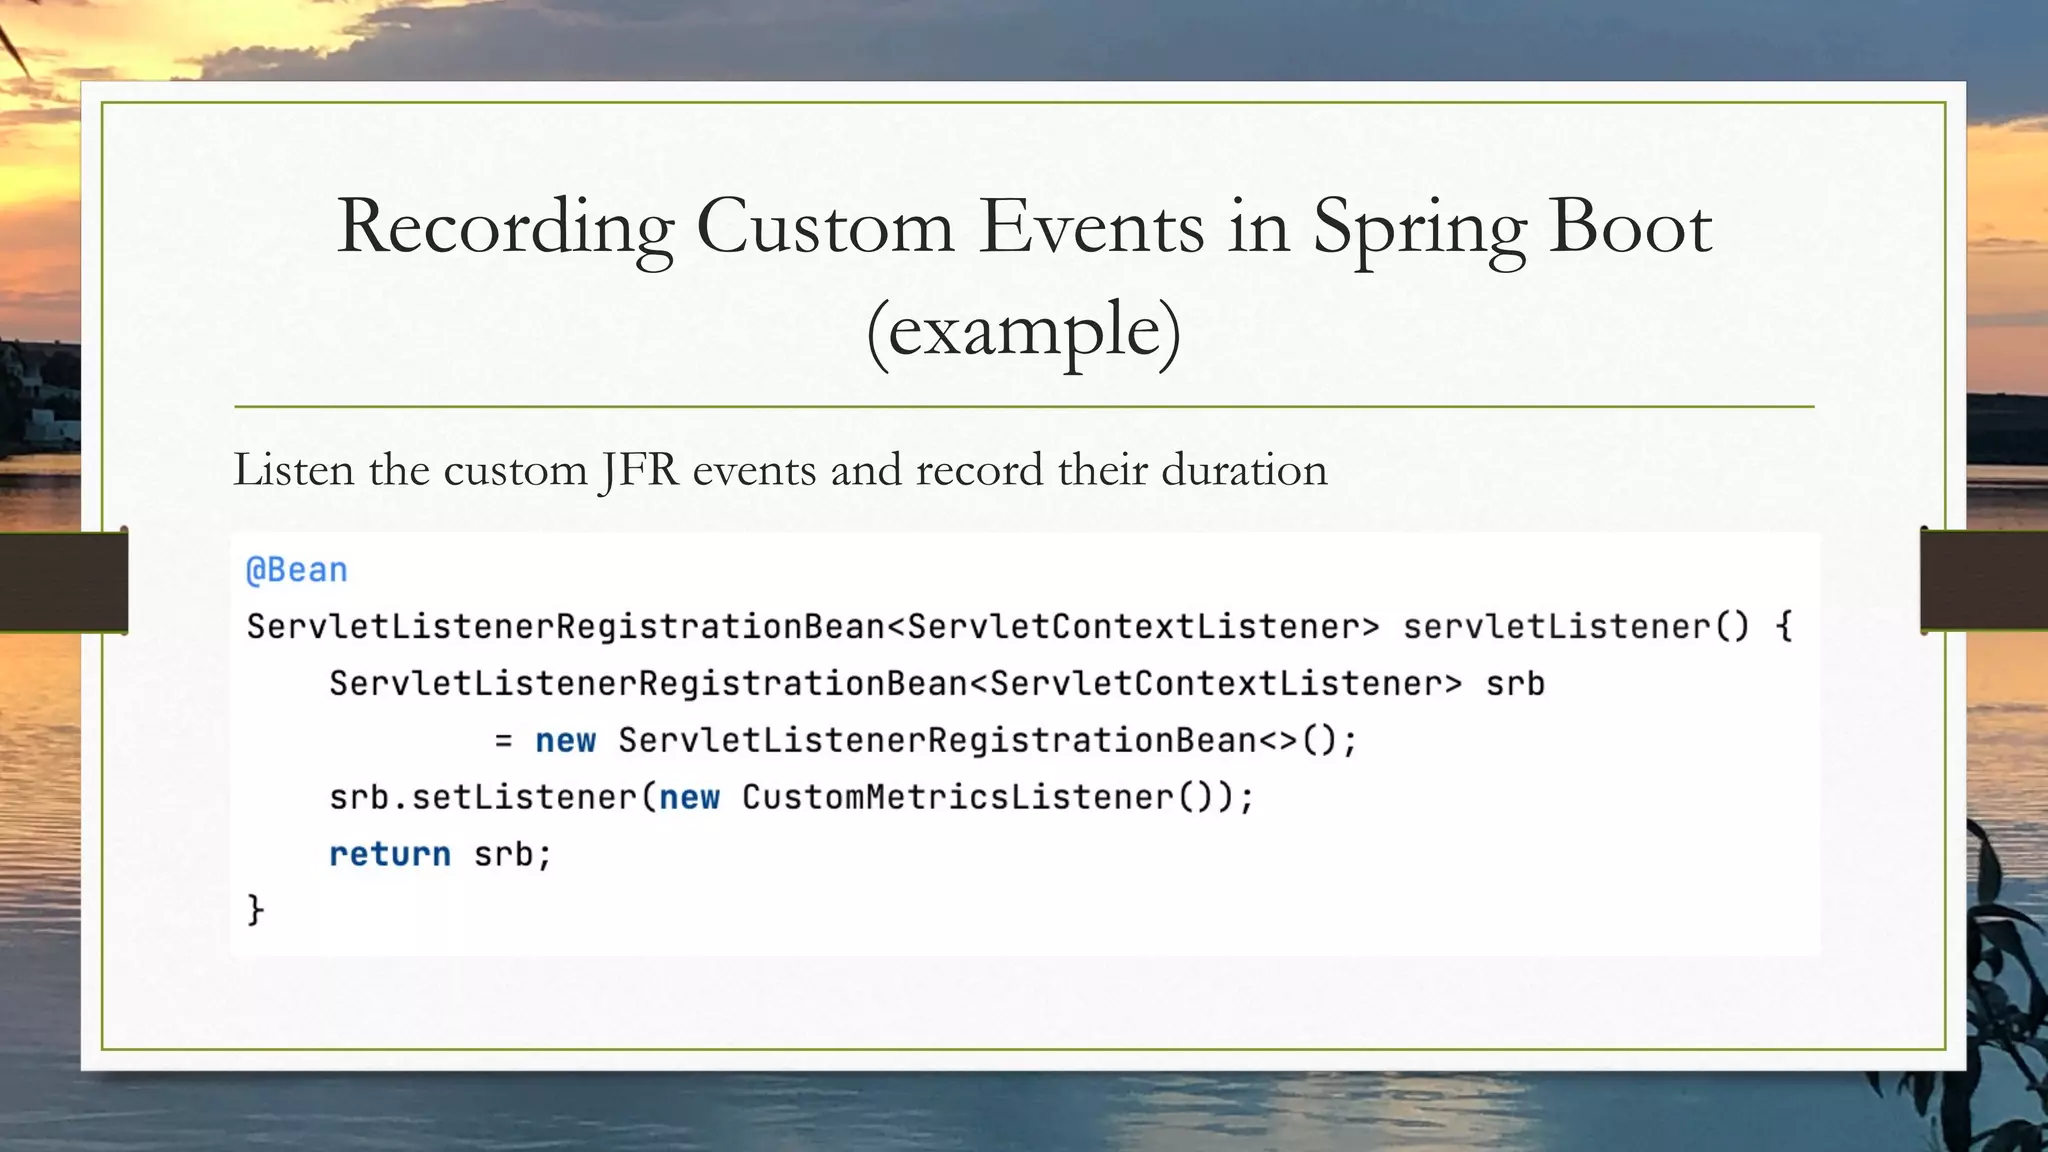
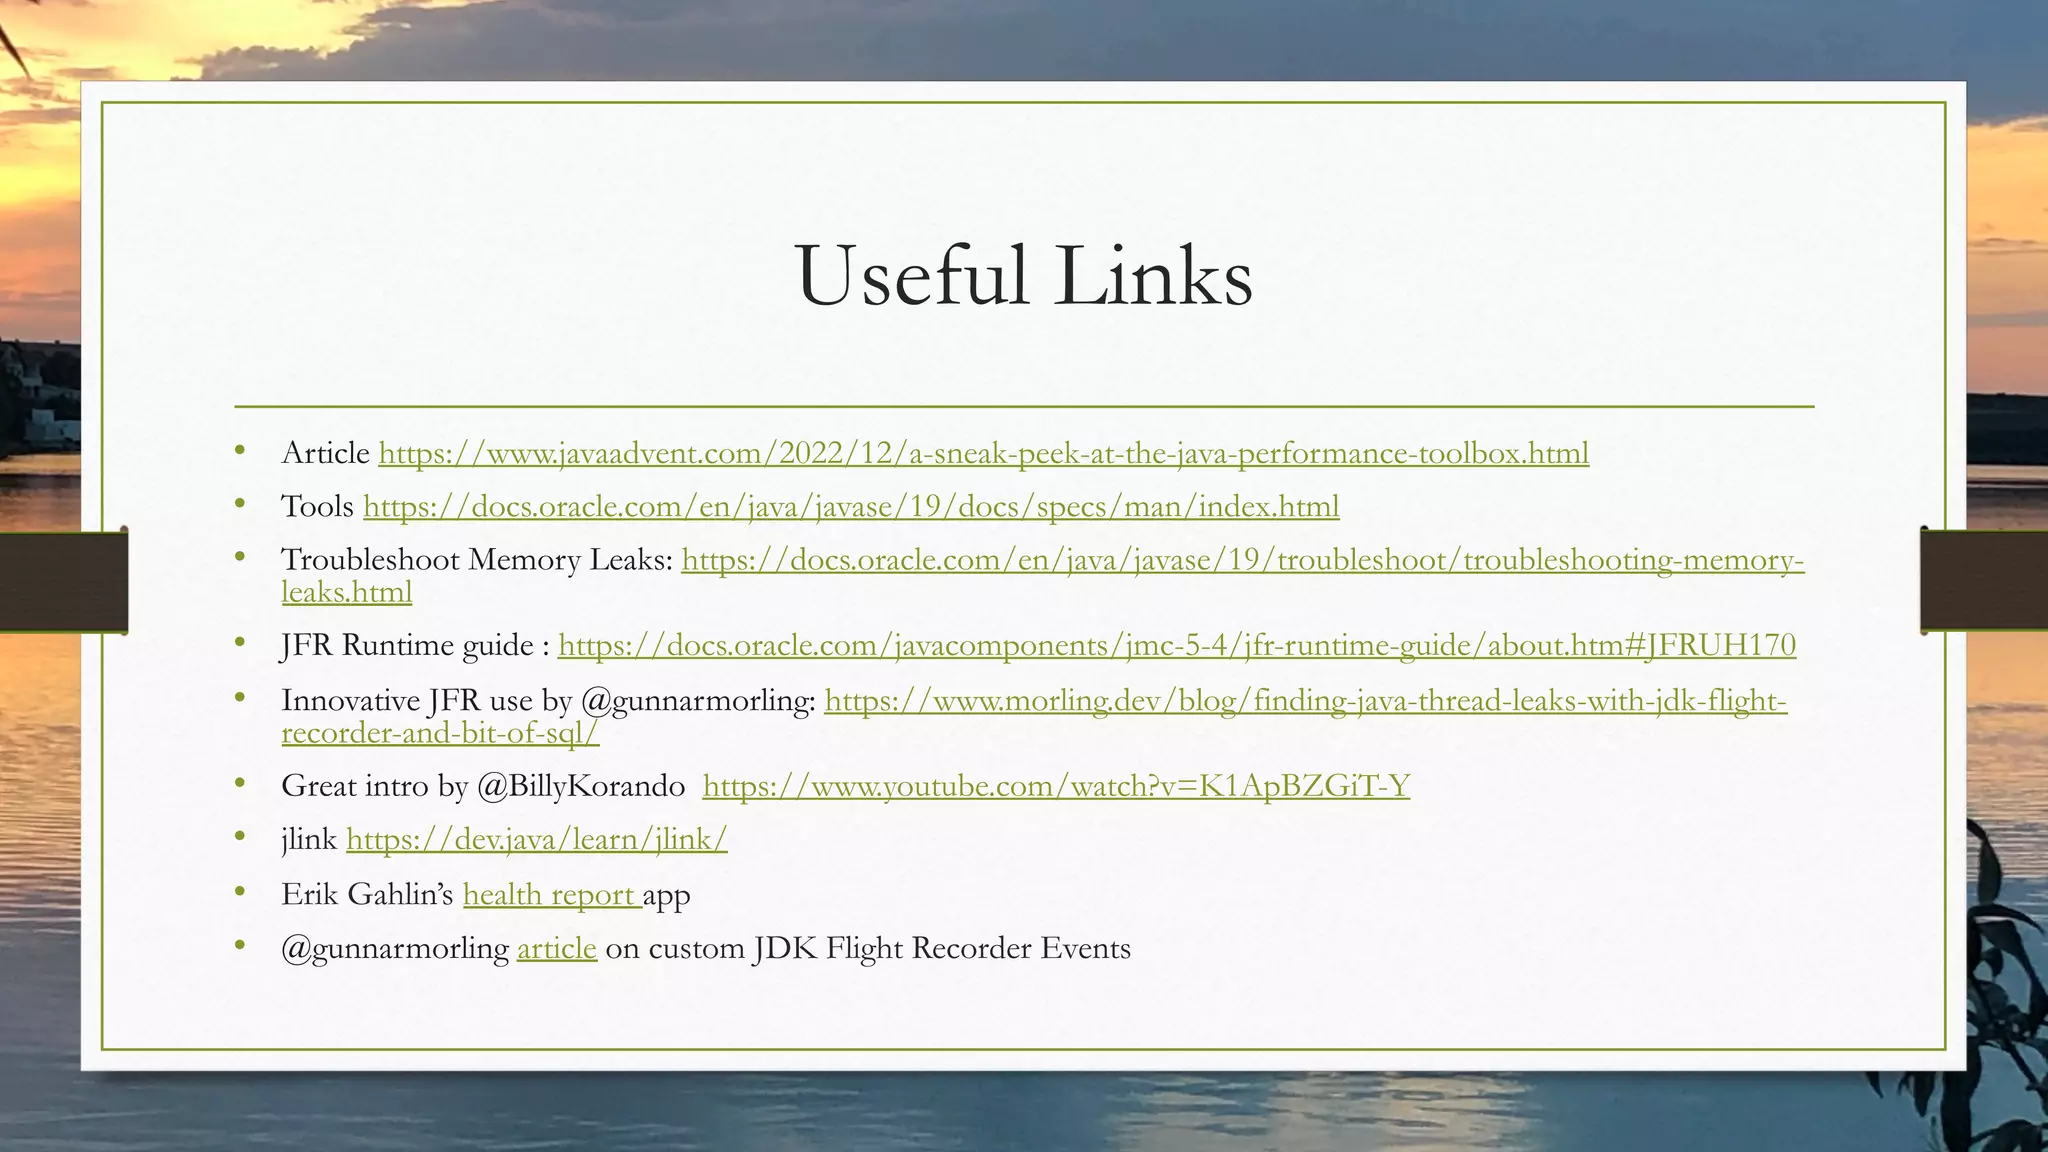

The document discusses various tools in the Java performance toolbox for building optimized container images, monitoring and profiling Java applications. It describes tools like Jlink, Dockerfile, JFR and JMX for creating minimal custom runtimes, capturing events, tuning JVM flags and correlating data across monitoring systems. Specific techniques covered include using Jlink to build minimal custom Java runtimes, capturing native memory usage with Jcmd, enabling JMX access and collecting statistics with Jstat and Jmap. The document also provides links to resources for further reading.


![Performance Monitoring with Java Flight Recorder on OpenJDK [DEV2406]](https://cdn.slidesharecdn.com/ss_thumbnails/20190919ocojfr-on-openjdkdev2406-190920170908-thumbnail.jpg?width=640&height=640&fit=bounds)


![Vibe Coding vs. Spec-Driven Development [Free Meetup]](https://cdn.slidesharecdn.com/ss_thumbnails/vibecodingvsspecdrivendevelopment-251209105622-43f455e7-thumbnail.jpg?width=640&height=640&fit=bounds)


