Florida Residential Market Sales Activity in January 2018
•
1 like•328 views

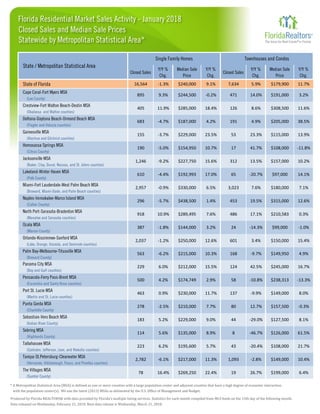
- Closed home sales in Florida decreased 1.3% in January 2018 compared to January 2017, while the statewide median home sale price increased 9.1% to $240,000. - The number of cash sales decreased 4.7% year-over-year, and cash sales represented 30.4% of all closed sales, down 3.5% from a year ago. - The average home sale price in Florida rose 12.3% to $334,350 compared to January 2017.

Recommended
Recommended
More Related Content
What's hot
What's hot (20)
Similar to Florida Residential Market Sales Activity in January 2018
Similar to Florida Residential Market Sales Activity in January 2018 (20)
Recently uploaded
Recently uploaded (20)
Florida Residential Market Sales Activity in January 2018
- 1. Closed Sales Y/Y % Chg. Median Sale Price Y/Y % Chg. Closed Sales Y/Y % Chg. Median Sale Price Y/Y % Chg. State of Florida 16,564 -1.3% $240,000 9.1% 7,634 5.9% $179,900 11.7% Cape Coral-Fort Myers MSA (Lee County) Crestview-Fort Walton Beach-Destin MSA (Okaloosa and Walton counties) Deltona-Daytona Beach-Ormond Beach MSA (Flagler and Volusia counties) Gainesville MSA (Alachua and Gilchrist counties) Homosassa Springs MSA (Citrus County) Jacksonville MSA (Baker, Clay, Duval, Nassau, and St. Johns counties) Lakeland-Winter Haven MSA (Polk County) Miami-Fort Lauderdale-West Palm Beach MSA (Broward, Miami-Dade, and Palm Beach counties) Naples-Immokalee-Marco Island MSA (Collier County) North Port-Sarasota-Bradenton MSA (Manatee and Sarasota counties) Ocala MSA (Marion County) Orlando-Kissimmee-Sanford MSA (Lake, Orange, Osceola, and Seminole counties) Palm Bay-Melbourne-Titusville MSA (Brevard County) Panama City MSA (Bay and Gulf counties) Pensacola-Ferry Pass-Brent MSA (Escambia and Santa Rosa counties) Port St. Lucie MSA (Martin and St. Lucie counties) Punta Gorda MSA (Charlotte County) Sebastian-Vero Beach MSA (Indian River County) Sebring MSA (Highlands County) Tallahassee MSA (Gadsden, Jefferson, Leon, and Wakulla counties) Tampa-St.Petersburg-Clearwater MSA (Hernando, Hillsborough, Pasco, and Pinellas counties) The Villages MSA (Sumter County) * A Metropolitan Statistical Area (MSA) is defined as one or more counties with a large population center and adjacent counties that have a high degree of economic interaction with the population center(s). We use the latest (2013) MSAs as delineated by the U.S. Office of Management and Budget. Produced by Florida REALTORS® with data provided by Florida's multiple listing services. Statistics for each month compiled from MLS feeds on the 15th day of the following month. Data released on Wednesday, February 21, 2018. Next data release is Wednesday, March 21, 2018. $108,000 21.7% $157,500 -0.3% $127,500 8.1% $126,000 61.5% $245,000 16.7% $238,313 -13.3% $149,000 8.0% $99,000 -1.0% $150,000 15.4% $149,950 4.9% $180,000 7.1% $315,000 12.6% $210,583 0.3% $108,000 -11.8% $157,000 10.2% $97,000 14.1% 43 -20.4% $191,000 3.2% $308,500 11.6% $205,000 38.5% $115,000 13.9% 80 12.7% 44 -29.0% 8 -46.7% 124 42.5% 58 -10.8% 137 -9.9% 24 -14.3% 601 3.4% 168 -9.7% 453 19.5% 486 17.1% 17 41.7% 312 13.5% 65 -20.7% 191 4.9% 53 23.3% $229,000 9.0% $135,000 8.9% 17.0% $330,000 6.5% $438,500 1.4% $289,495 7.6% 4.2% $229,000 23.5% $154,950 10.7% $227,750 15.6% 3,023 7.6% 5.7% $174,749 2.9% $230,000 11.7% $210,000 7.7% 3.2% $250,000 12.6% $215,000 10.3% $212,000 15.5% 6.2%223 895 9.3% $244,500 $285,000 $187,000 $192,993 $144,000 -6.2% 6.0% 4.2% 0.9% -2.5% 5.2% -4.4% -0.9% -5.7% 10.9% -1.8% -1.2% 500 463 $195,600 278 183 114 11.9% -4.7% -3.7% -5.0% -9.2% 296 918 387 2,037 563 229 683 155 190 1,246 610 2,957 5.6% State / Metropolitan Statistical Area 405 -0.2% 18.4% 471 14.0% 126 8.6% Single Family Homes Townhouses and Condos 2,782 -6.1% $217,000 11.3% 1,093 -2.8% $149,000 10.4% 78 16.4% $269,250 22.4% 19 26.7% $199,000 6.4% Florida Residential Market Sales Activity - January 2018 Statewide by Metropolitan Statistical Area* Closed Sales and Median Sale Prices
- 2. Produced by Florida Realtors® with data provided by Florida's multiple listing services. Statistics for each month compiled from MLS feeds on the 15th day of the following month. Data released on Wednesday, February 21, 2018. Next data release is Wednesday, March 21, 2018. Year-to-Date 16,564 -1.3% -1.3% 31,523 1.1% Closed Sales 16,564 97 Days 36,049 -4.1% 94,071 -7.3% 4.2 -7.1% Summary Statistics Closed Sales Paid in Cash 96.0% January 2018 $240,000Median Sale Price Average Sale Price Dollar Volume Median Percent of Original List Price Received $220,000 9.1% $5.5 Billion $5.0 Billion 10.9% $334,350 $297,654 12.3% January 2017 Percent Change Year-over-Year 5,035 5,282 -4.7% 16,564 16,779 -1.3% 95.6% 0.4% 45 Days 49 Days -8.2% January 2018 Median Time to Contract 89 Days 24,511 Median Time to Sale New Pending Sales New Listings Month 31,879 Pending Inventory 34,572 Inventory (Active Listings) 87,196 Months Supply of Inventory 3.9 -8.2% 24,490 0.1% Percent Change Year-over-Year 18,033 January 2017 16,779 June 2017 28,205 May 2017 27,854 September 2017 18,030 August 2017 25,235 July 2017 24,546 Economists' note : Closed Sales are one of the simplest—yet most important—indicators for the residential real estate market. When comparing Closed Sales across markets of different sizes, we recommend comparing the percent changes in sales rather than the number of sales. Closed Sales (and many other market metrics) are affected by seasonal cycles, so actual trends are more accurately represented by year-over-year changes (i.e. comparing a month's sales to the amount of sales in the same month in the previous year), rather than changes from one month to the next. December 2017 22,903 2.6% 1.3% 2.0% November 2017 19,990 October 2017 20,543 5.2% April 2017 23,829 March 2017 25,921 -1.2% 9.3% -0.5% -20.4% 0.9% 4.3% 7.6% 2.0% February 2017 J F M A M J J A S O N D J F M A M J J A S O N D J F M A M J J A S O N D J F M A M J J A S O N D J Monthly Market Detail - January 2018 Florida Single Family Homes Closed Sales The number of sales transactions which closed during the month 2014 2015 2016 2017 0 5,000 10,000 15,000 20,000 25,000 30,000 ClosedSales
- 3. Produced by Florida Realtors® with data provided by Florida's multiple listing services. Statistics for each month compiled from MLS feeds on the 15th day of the following month. Data released on Wednesday, February 21, 2018. Next data release is Wednesday, March 21, 2018. October 2017 Month Cash Sales Percent Change Year-over-Year January 2018 5,035 -4.7% December 2017 6,032 -4.6% November 2017 5,375 -7.8% Year-to-Date 5,035 -4.7% 6,573 -12.7% 5,354 -7.1% September 2017 4,698 -25.9% June 2017 7,120 -3.3% August 2017 6,519 -4.6% July 2017 5,972 -6.9% January 2018 30.4% -3.5% December 2017 26.3% -7.1% November 2017 26.9% -8.8% October 2017 26.1% -8.7% -8.8% September 2017 26.1% -6.8% August 2017 25.8% -5.5% July 2017 24.3% -9.0% June 2017 25.2% -7.4% May 2017 26.8% -8.2% Economists' note : This statistic is simply another way of viewing Cash Sales. The remaining percentages of Closed Sales (i.e. those not paid fully in cash) each month involved some sort of financing, such as mortgages, owner/seller financing, assumed loans, etc. Economists' note : Cash Sales can be a useful indicator of the extent to which investors are participating in the market. Why? Investors are far more likely to have the funds to purchase a home available up front, whereas the typical homebuyer requires a mortgage or some other form of financing. There are, of course, many possible exceptions, so this statistic should be interpreted with care. Year-to-Date 30.4% -3.5% Month Percent of Closed Sales Paid in Cash Percent Change Year-over-Year February 2017 32.5% -11.4% January 2017 January 2017 5,282 -10.3% March 2017 31.5% -14.6% April 2017 27.6% May 2017 7,452 -1.2% April 2017 7,567 -0.4% February 2017 5,859 -11.9% -11.5% March 2017 29.2% J F M A M J J A S O N D J F M A M J J A S O N D J F M A M J J A S O N D J F M A M J J A S O N D J J F M A M J J A S O N D J F M A M J J A S O N D J F M A M J J A S O N D J F M A M J J A S O N D J 0% 10% 20% 30% 40% 50% 60% Pct.ofClosedSales PaidinCash 0 2,000 4,000 6,000 8,000 10,000 CashSales Monthly Market Detail - January 2018 2014 2015 2016 2017 Florida Single Family Homes Cash Sales The number of Closed Sales during the month in which buyers exclusively paid in cash 2014 2015 2016 2017 Cash Sales as a Percentage of Closed Sales The percentage of Closed Sales during the month which were Cash Sales
- 4. Produced by Florida Realtors® with data provided by Florida's multiple listing services. Statistics for each month compiled from MLS feeds on the 15th day of the following month. Data released on Wednesday, February 21, 2018. Next data release is Wednesday, March 21, 2018. Month Median Sale Price Percent Change Year-over-Year January 2018 $240,000 9.1% Year-to-Date $240,000 9.1% June 2017 $245,000 8.9% December 2017 $244,185 8.0% November 2017 $240,000 9.1% August 2017 $240,000 6.7% July 2017 $240,000 7.1% October 2017 $235,558 7.1% September 2017 $239,900 7.6% May 2017 $239,000 7.7% April 2017 $234,900 10.3% March 2017 $231,900 10.4% February 2017 $225,000 12.5% January 2017 $220,000 10.1% Month Average Sale Price Percent Change Year-over-Year January 2018 $334,350 12.3% December 2017 $320,985 9.4% November 2017 $314,632 8.3% October 2017 $308,835 6.8% 11.3% September 2017 $306,770 5.9% August 2017 $313,903 7.7% July 2017 $316,887 5.7% June 2017 $328,921 7.3% May 2017 $324,821 8.3% 12.3%$334,350Year-to-Date Economists' note : Median Sale Price is our preferred summary statistic for price activity because, unlike Average Sale Price, Median Sale Price is not sensitive to high sale prices for small numbers of homes that may not be characteristic of the market area. Keep in mind that median price trends over time are not always solely caused by changes in the general value of local real estate. Median sale price only reflects the values of the homes that sold each month, and the mix of the types of homes that sell can change over time. Economists' note : Usually, we prefer Median Sale Price over Average Sale Price as a summary statistic for home prices. However, Average Sale Price does have its uses—particularly when it is analyzed alongside the Median Sale Price. For one, the relative difference between the two statistics can provide some insight into the market for higher-end homes in an area. February 2017 $313,401 9.5% January 2017 $297,654 4.0% April 2017 $320,574 8.3% March 2017 $318,115 J F M A M J J A S O N D J F M A M J J A S O N D J F M A M J J A S O N D J F M A M J J A S O N D J J F M A M J J A S O N D J F M A M J J A S O N D J F M A M J J A S O N D J F M A M J J A S O N D J $0K $100K $200K $300K $400K AverageSalePrice $0K $50K $100K $150K $200K $250K $300K MedianSalePrice Monthly Market Detail - January 2018 2014 2015 2016 2017 Florida Single Family Homes Median Sale Price The median sale price reported for the month (i.e. 50% of sales were above and 50% of sales were below) 2014 2015 2016 2017 Average Sale Price The average sale price reported for the month (i.e. total sales in dollars divided by the number of sales)
- 5. Produced by Florida Realtors® with data provided by Florida's multiple listing services. Statistics for each month compiled from MLS feeds on the 15th day of the following month. Data released on Wednesday, February 21, 2018. Next data release is Wednesday, March 21, 2018. Month Dollar Volume Percent Change Year-over-Year January 2018 $5.5 Billion 10.9% Year-to-Date $5.5 Billion 10.9% 11.9% December 2017 $7.4 Billion 12.2% November 2017 $6.3 Billion 9.7% $7.6 Billion 7.0% October 2017 $6.3 Billion 9.0% September 2017 $5.5 Billion -15.7% August 2017 $7.9 Billion 8.7% July 2017 $7.8 Billion 7.8% June 2017 $9.3 Billion January 2018 96.0% 0.4% December 2017 96.3% 0.3% November 2017 96.3% 0.2% October 2017 96.3% 0.2% 0.3% September 2017 96.4% 0.2% August 2017 96.5% 0.1% July 2017 96.5% 0.1% June 2017 96.5% 0.2% May 2017 96.4% 0.2% Economists' note : The Median Percent of Original List Price Received is useful as an indicator of market recovery, since it typically rises as buyers realize that the market may be moving away from them and they need to match the selling price (or better it) in order to get a contract on the house. This is usually the last measure to indicate a market has shifted from down to up, so it is what we would call a lagging indicator. Economists' note : Dollar Volume is simply the sum of all sale prices in a given time period, and can quickly be calculated by multiplying Closed Sales by Average Sale Price. It is a strong indicator of the health of the real estate industry in a market, and is of particular interest to real estate professionals, investors, analysts, and government agencies. Potential home sellers and home buyers, on the other hand, will likely be better served by paying attention to trends in the two components of Dollar Volume (i.e. sales and prices) individually. 0.4%96.0%Year-to-Date Month Med. Pct. of Orig. List Price Received Percent Change Year-over-Year February 2017 95.8% 0.5% January 2017 January 2017 $5.0 Billion 9.4% March 2017 95.6% 0.4% April 2017 96.2% May 2017 $9.0 Billion 16.6% April 2017 $8.2 Billion 21.6% February 2017 $5.7 Billion 9.0% 0.3% March 2017 96.1% J F M A M J J A S O N D J F M A M J J A S O N D J F M A M J J A S O N D J F M A M J J A S O N D J J F M A M J J A S O N D J F M A M J J A S O N D J F M A M J J A S O N D J F M A M J J A S O N D J 0% 20% 40% 60% 80% 100% 120% Med.Pct.ofOrig. ListPriceReceived $0 $2 B $4 B $6 B $8 B $10 B DollarVolume Monthly Market Detail - January 2018 2014 2015 2016 2017 Florida Single Family Homes Dollar Volume The sum of the sale prices for all sales which closed during the month 2014 2015 2016 2017 Median Percent of Original List Price Received The median of the sale price (as a percentage of the original list price) across all properties selling during the month
- 6. Produced by Florida Realtors® with data provided by Florida's multiple listing services. Statistics for each month compiled from MLS feeds on the 15th day of the following month. Data released on Wednesday, February 21, 2018. Next data release is Wednesday, March 21, 2018. 46 Days 7.0% October 2017 43 Days 0.0% May 2017 39 Days -9.3% Month Median Time to Contract Percent Change Year-over-Year January 2018 45 Days -8.2% 45 Days -8.2%Year-to-Date December 2017 41 Days -8.9% November 2017 July 2017 36 Days -10.0% June 2017 38 Days -7.3% September 2017 38 Days -7.3% August 2017 37 Days -7.5% 40 Days -9.1% March 2017 47 Days -6.0% April 2017 February 2017 54 Days -5.3% January 2017 49 Days -7.5% Month Median Time to Sale Percent Change Year-over-Year January 2018 89 Days -8.2% -8.2%89 DaysYear-to-Date December 2017 83 Days -9.8% November 2017 91 Days -1.1% -5.6% October 2017 91 Days 0.0% September 2017 85 Days -5.6% August 2017 80 Days -9.1% July 2017 81 Days -9.0% June 2017 83 Days -8.8% January 2017 97 Days -4.0% Economists' note : Time to Sale is a measure of the length of the home selling process, calculated as the number of days between the initial listing of a property and the closing of the sale. Median Time to Sale is the amount of time the "middle" property selling this month was on the market. That is, 50% of homes selling this month took less time to sell, and 50% of homes took more time to sell. Median Time to Sale gives a more accurate picture than Average Time to Sale, which can be skewed upward by small numbers of properties taking an abnormally long time to sell. Economists' note : Like Time to Sale, Time to Contract is a measure of the length of the home selling process calculated for sales which closed during the month. The difference is that Time to Contract measures the number of days between the initial listing of a property and the signing of the contract which eventually led to the closing of the sale. When the gap between Median Time to Contract and Median Time to Sale grows, it is usually a sign of longer closing times and/or declining numbers of cash sales. March 2017 92 Days -7.1% February 2017 98 Days -6.7% May 2017 83 Days -7.8% April 2017 85 Days J F M A M J J A S O N D J F M A M J J A S O N D J F M A M J J A S O N D J F M A M J J A S O N D J J F M A M J J A S O N D J F M A M J J A S O N D J F M A M J J A S O N D J F M A M J J A S O N D J 0 20 40 60 80 100 120 MedianTimeto Sale 0 20 40 60 80 MedianTimeto ContractMonthly Market Detail - January 2018 2014 2015 2016 2017 Florida Single Family Homes Median Time to Contract The median number of days between the listing date and contract date for all Closed Sales during the month 2014 2015 2016 2017 Median Time to Sale The median number of days between the listing date and closing date for all Closed Sales during the month
- 7. Produced by Florida Realtors® with data provided by Florida's multiple listing services. Statistics for each month compiled from MLS feeds on the 15th day of the following month. Data released on Wednesday, February 21, 2018. Next data release is Wednesday, March 21, 2018. Economists' note : New Listings tend to rise in delayed response to increasing prices, so they are often seen as a lagging indicator of market health. As prices rise, potential sellers raise their estimations of value—and in the most recent cycle, rising prices have freed up many potential sellers who were previously underwater on their mortgages. Note that in our calculations, we take care to not include properties that were recently taken off the market and quickly relisted, since these are not really new listings. Economists' note : Because of the typical length of time it takes for a sale to close, economists consider Pending Sales to be a decent indicator of potential future Closed Sales. It is important to bear in mind, however, that not all Pending Sales will be closed successfully. So, the effectiveness of Pending Sales as a future indicator of Closed Sales is susceptible to changes in market conditions such as the availability of financing for homebuyers and the inventory of distressed properties for sale. Month New Pending Sales Percent Change Year-over-Year January 2018 24,511 0.1% Year-to-Date 24,511 0.1% June 2017 27,818 2.2% December 2017 19,419 -0.1% November 2017 22,131 5.5% August 2017 26,949 2.2% July 2017 26,208 3.3% October 2017 24,028 10.1% September 2017 16,284 -30.2% May 2017 29,465 7.1% April 2017 28,883 -4.4% March 2017 30,861 3.6% February 2017 26,310 -2.0% January 2017 24,490 3.8% Month New Listings Percent Change Year-over-Year January 2018 31,879 1.1% December 2017 20,614 -0.4% November 2017 26,221 1.8% October 2017 28,228 9.8% 31,313 4.2% May 2017 32,893 7.2% January 2017 31,523 7.6% April 2017 29,898 -4.9% March 2017 33,984 1.8% Year-to-Date 31,879 1.1% February 2017 29,699 -5.9% September 2017 18,493 -30.8% August 2017 30,067 0.8% July 2017 29,565 6.1% June 2017 J F M A M J J A S O N D J F M A M J J A S O N D J F M A M J J A S O N D J F M A M J J A S O N D J J F M A M J J A S O N D J F M A M J J A S O N D J F M A M J J A S O N D J F M A M J J A S O N D J 0 10,000 20,000 30,000 40,000 NewListings 0 5,000 10,000 15,000 20,000 25,000 30,000 35,000 PendingSales Monthly Market Detail - January 2018 2014 2015 2016 2017 Florida Single Family Homes New Pending Sales The number of listed properties that went under contract during the month 2014 2015 2016 2017 New Listings The number of properties put onto the market during the month
- 8. Produced by Florida Realtors® with data provided by Florida's multiple listing services. Statistics for each month compiled from MLS feeds on the 15th day of the following month. Data released on Wednesday, February 21, 2018. Next data release is Wednesday, March 21, 2018. Economists' note : There are a number of ways to define and calculate Inventory. Our method is to simply count the number of active listings on the last day of the month, and hold this number to compare with the same month the following year. Inventory rises when New Listings are outpacing the number of listings that go off-market (regardless of whether they actually sell). Likewise, it falls when New Listings aren't keeping up with the rate at which homes are going off-market. Economists' note : MSI is a useful indicator of market conditions. The benchmark for a balanced market (favoring neither buyer nor seller) is 5.5 months of inventory. Anything higher is traditionally a buyers' market, and anything lower is a sellers' market. There is no single accepted way of calculating MSI. A common method is to divide current Inventory by the most recent month's Closed Sales count, but this count is a usually poor predictor of future Closed Sales due to seasonal cycles. To eliminate seasonal effects, we use the 12-month average of monthly Closed Sales instead. YTD (Monthly Avg) 3.9 -7.1% Month Months Supply Percent Change Year-over-Year January 2017 4.2 -2.3% March 2017 4.1 -6.8% February 2017 4.2 January 2017 94,071 -0.7% March 2017 92,558 -4.9% February 2017 93,818 -4.0% -4.5% May 2017 4.0 -7.0% April 2017 4.0 -7.0% July 2017 3.9 -4.9% June 2017 3.9 -4.9% September 2017 3.8 -7.3% August 2017 3.8 -7.3% November 2017 3.8 -7.3% October 2017 3.8 -7.3% January 2018 3.9 -7.1% December 2017 3.6 -7.7% 90,261 -5.2% July 2017 88,812 -2.7% June 2017 89,318 -3.1% May 2017 90,858 -4.3% April 2017 -5.7% September 2017 84,862 -6.1% August 2017 86,661 -4.5% October 2017 85,755 Month Inventory Percent Change Year-over-Year January 2018 87,196 -7.3% 87,196 -7.3%YTD (Monthly Avg) December 2017 82,179 -7.1% November 2017 85,849 -6.8% J F M A M J J A S O N D J F M A M J J A S O N D J F M A M J J A S O N D J F M A M J J A S O N D J J F M A M J J A S O N D J F M A M J J A S O N D J F M A M J J A S O N D J F M A M J J A S O N D J 0.0 1.0 2.0 3.0 4.0 5.0 6.0 MonthsSupplyof Inventory 0 20,000 40,000 60,000 80,000 100,000 120,000 Inventory Monthly Market Detail - January 2018 2014 2015 2016 2017 Florida Single Family Homes Inventory (Active Listings) The number of property listings active at the end of the month 2014 2015 2016 2017 Months Supply of Inventory An estimate of the number of months it will take to deplete the current Inventory given recent sales rates
- 9. Produced by Florida Realtors® with data provided by Florida's multiple listing services. Statistics for each month compiled from MLS feeds on the 15th day of the following month. Data released on Wednesday, February 21, 2018. Next data release is Wednesday, March 21, 2018. $600,000 - $999,999 95 Days -9.5% $1,000,000 or more 143 Days -13.9% Economists' note : Like Time to Sale, Time to Contract is a measure of the length of the home selling process calculated for sales which closed during the month. The difference is that Time to Contract measures the number of days between the initial listing of a property and the signing of the contract which eventually led to the closing of the sale. When the gap between Median Time to Contract and Median Time to Sale grows, it is usually a sign of longer closing times and/or declining numbers of cash sales. $150,000 - $199,999 32 Days -8.6% $200,000 - $249,999 42 Days -12.5% $250,000 - $299,999 $400,000 - $599,999 65 Days -17.7% 48 Days -11.1% $300,000 - $399,999 51 Days -15.0% Economists' note: Closed Sales are one of the simplest—yet most important—indicators for the residential real estate market. When comparing Closed Sales across markets of different sizes, we recommend comparing the percent changes in sales rather than the number of sales. Closed Sales (and many other market metrics) are affected by seasonal cycles, so actual trends are more accurately represented by year-over-year changes (i.e. comparing a month's sales to the amount of sales in the same month in the previous year), rather than changes from one month to the next. Sale Price Median Time to Contract Percent Change Year-over-Year Less than $50,000 36 Days -12.2% $1,000,000 or more 522 18.1% $250,000 - $299,999 2,214 11.8% $300,000 - $399,999 2,544 14.5% $50,000 - $99,999 36 Days 2.9% $100,000 - $149,999 $400,000 - $599,999 1,750 17.0% $600,000 - $999,999 832 19.2% 31 Days -18.4% $150,000 - $199,999 2,946 -9.7% $200,000 - $249,999 2,771 7.2% $100,000 - $149,999 1,897 -21.2% Sale Price Closed Sales Percent Change Year-over-Year Less than $50,000 240 -28.4% $50,000 - $99,999 848 -37.2% 0 20 40 60 80 100 120 140 160 180 Less than $50,000 $50,000 - $99,999 $100,000 - $149,999 $150,000 - $199,999 $200,000 - $249,999 $250,000 - $299,999 $300,000 - $399,999 $400,000 - $599,999 $600,000 - $999,999 $1,000,000 or more MedianTimetoContract January 2017 January 2018 0 20 40 60 80 100 120 140 160 180 0 500 1,000 1,500 2,000 2,500 3,000 3,500 Less than $50,000 $50,000 - $99,999 $100,000 - $149,999 $150,000 - $199,999 $200,000 - $249,999 $250,000 - $299,999 $300,000 - $399,999 $400,000 - $599,999 $600,000 - $999,999 $1,000,000 or more ClosedSales January 2017 January 2018 0 500 1,000 1,500 2,000 2,500 3,000 3,500 Monthly Market Detail - January 2018 Florida Single Family Homes Closed Sales by Sale Price The number of sales transactions which closed during the month Median Time to Contract by Sale Price The median number of days between the listing date and contract date for all Closed Sales during the month
- 10. Produced by Florida Realtors® with data provided by Florida's multiple listing services. Statistics for each month compiled from MLS feeds on the 15th day of the following month. Data released on Wednesday, February 21, 2018. Next data release is Wednesday, March 21, 2018. $600,000 - $999,999 10,024 -4.0% $1,000,000 or more 10,608 -5.3% Economists' note : There are a number of ways to define and calculate Inventory. Our method is to simply count the number of active listings on the last day of the month, and hold this number to compare with the same month the following year. Inventory rises when New Listings are outpacing the number of listings that go off-market (regardless of whether they actually sell). Likewise, it falls when New Listings aren't keeping up with the rate at which homes are going off-market. $150,000 - $199,999 8,488 -21.0% $200,000 - $249,999 10,660 -3.2% $250,000 - $299,999 10,584 4.0% $300,000 - $399,999 14,785 0.1% $400,000 - $599,999 14,593 -2.4% $50,000 - $99,999 2,261 -37.4% $100,000 - $149,999 4,708 -25.4% Current Listing Price Inventory Percent Change Year-over-Year Less than $50,000 485 -43.7% $600,000 - $999,999 2,330 7.5% $1,000,000 or more 1,693 0.5% Economists' note: New Listings tend to rise in delayed response to increasing prices, so they are often seen as a lagging indicator of market health. As prices rise, potential sellers raise their estimations of value—and in the most recent cycle, rising prices have freed up many potential sellers who were previously underwater on their mortgages. Note that in our calculations, we take care to not include properties that were recently taken off the market and quickly relisted, since these are not really new listings. $150,000 - $199,999 4,697 -5.7% $200,000 - $249,999 4,990 9.0% $250,000 - $299,999 4,437 16.5% $300,000 - $399,999 5,445 8.1% $400,000 - $599,999 4,392 6.1% $50,000 - $99,999 1,060 -34.2% $100,000 - $149,999 2,598 -17.4% Initial Listing Price New Listings Percent Change Year-over-Year Less than $50,000 237 -36.1% 0 2,000 4,000 6,000 8,000 10,000 12,000 14,000 16,000 Less than $50,000 $50,000 - $99,999 $100,000 - $149,999 $150,000 - $199,999 $200,000 - $249,999 $250,000 - $299,999 $300,000 - $399,999 $400,000 - $599,999 $600,000 - $999,999 $1,000,000 or more Inventory January 2017 January 2018 0 1,000 2,000 3,000 4,000 5,000 6,000 Less than $50,000 $50,000 - $99,999 $100,000 - $149,999 $150,000 - $199,999 $200,000 - $249,999 $250,000 - $299,999 $300,000 - $399,999 $400,000 - $599,999 $600,000 - $999,999 $1,000,000 or more NewListings January 2017 January 2018 0 2,000 4,000 6,000 8,000 10,000 12,000 14,000 16,000 0 1,000 2,000 3,000 4,000 5,000 6,000 Monthly Market Detail - January 2018 Florida Single Family Homes New Listings by Initial Listing Price The number of properties put onto the market during the month Inventory by Current Listing Price The number of property listings active at the end of the month
- 11. Closed Sales Median Sale Price Closed Sales Median Sale Price Closed Sales Median Sale Price Produced by Florida Realtors® with data provided by Florida's multiple listing services. Statistics for each month compiled from MLS feeds on the 15th day of the following month. Data released on Wednesday, February 21, 2018. Next data release is Wednesday, March 21, 2018. Short Sale 195 361 -46.0% $155,000 $173,600 -10.7% Foreclosure/REO 770 1,351 -43.0% $167,526 $140,500 19.2% January 2018 January 2017 Percent Change Year-over-Year Traditional 15,599 15,067 3.5% $245,000 $226,500 8.2% $0 $50,000 $100,000 $150,000 $200,000 $250,000 $300,000 MedianSalePrice 0% 10% 20% 30% 40% 50% 60% 70% 80% 90% 100% ClosedSales Traditional Foreclosure/REO Short Sale 2014 2015 2016 2017 J F M A M J J A S O N D J F M A M J J A S O N D J F M A M J J A S O N D J F M A M J J A S O N D J J F M A M J J A S O N D J F M A M J J A S O N D J F M A M J J A S O N D J F M A M J J A S O N D J Monthly Distressed Market - January 2018 Florida Single Family Homes 2014 2015 2016 2017
- 12. Produced by Florida Realtors® with data provided by Florida's multiple listing services. Statistics for each month compiled from MLS feeds on the 15th day of the following month. Data released on Wednesday, February 21, 2018. Next data release is Wednesday, March 21, 2018. Year-to-Date 7,634 5.9% 5.9% 16,069 3.6% Closed Sales 7,634 96 Days 15,141 2.2% 57,784 -4.8% 6.4 -7.8% Summary Statistics Closed Sales Paid in Cash 95.0% January 2018 $179,900Median Sale Price Average Sale Price Dollar Volume Median Percent of Original List Price Received $161,000 11.7% $2.2 Billion $1.8 Billion 24.0% $286,404 $244,520 17.1% January 2017 Percent Change Year-over-Year 4,328 4,298 0.7% 7,634 7,209 5.9% 94.6% 0.4% 49 Days 53 Days -7.5% January 2018 Median Time to Contract 90 Days 11,319 Median Time to Sale New Pending Sales New Listings Month 16,653 Pending Inventory 15,467 Inventory (Active Listings) 54,988 Months Supply of Inventory 5.9 -6.3% 10,469 8.1% Percent Change Year-over-Year 7,949 January 2017 7,209 June 2017 10,996 May 2017 11,539 September 2017 7,404 August 2017 9,716 July 2017 9,246 Economists' note : Closed Sales are one of the simplest—yet most important—indicators for the residential real estate market. When comparing Closed Sales across markets of different sizes, we recommend comparing the percent changes in sales rather than the number of sales. Closed Sales (and many other market metrics) are affected by seasonal cycles, so actual trends are more accurately represented by year-over-year changes (i.e. comparing a month's sales to the amount of sales in the same month in the previous year), rather than changes from one month to the next. December 2017 9,193 6.0% 5.8% 2.2% November 2017 8,235 October 2017 8,116 6.2% April 2017 10,292 March 2017 11,193 -4.0% 11.4% 4.1% -15.9% 2.6% 4.9% 8.0% 3.6% February 2017 J F M A M J J A S O N D J F M A M J J A S O N D J F M A M J J A S O N D J F M A M J J A S O N D J Monthly Market Detail - January 2018 Florida Townhouses and Condos Closed Sales The number of sales transactions which closed during the month 2014 2015 2016 2017 0 2,000 4,000 6,000 8,000 10,000 12,000 14,000 ClosedSales
- 13. Produced by Florida Realtors® with data provided by Florida's multiple listing services. Statistics for each month compiled from MLS feeds on the 15th day of the following month. Data released on Wednesday, February 21, 2018. Next data release is Wednesday, March 21, 2018. October 2017 Month Cash Sales Percent Change Year-over-Year January 2018 4,328 0.7% December 2017 4,774 -1.4% November 2017 4,483 0.6% Year-to-Date 4,328 0.7% 5,909 -8.6% 4,175 -5.5% September 2017 3,900 -20.7% June 2017 5,799 1.3% August 2017 5,006 -4.0% July 2017 4,864 1.3% January 2018 56.7% -4.9% December 2017 51.9% -7.0% November 2017 54.4% -5.1% October 2017 51.4% -7.6% -4.8% September 2017 52.7% -5.7% August 2017 51.5% -6.5% July 2017 52.6% -2.2% June 2017 52.7% -3.5% May 2017 54.4% -4.7% Economists' note : This statistic is simply another way of viewing Cash Sales. The remaining percentages of Closed Sales (i.e. those not paid fully in cash) each month involved some sort of financing, such as mortgages, owner/seller financing, assumed loans, etc. Economists' note : Cash Sales can be a useful indicator of the extent to which investors are participating in the market. Why? Investors are far more likely to have the funds to purchase a home available up front, whereas the typical homebuyer requires a mortgage or some other form of financing. There are, of course, many possible exceptions, so this statistic should be interpreted with care. Year-to-Date 56.7% -4.9% Month Percent of Closed Sales Paid in Cash Percent Change Year-over-Year February 2017 61.8% -2.7% January 2017 January 2017 4,298 2.1% March 2017 59.6% -3.9% April 2017 57.4% May 2017 6,278 3.0% April 2017 6,624 6.0% February 2017 4,910 1.2% -4.8% March 2017 59.2% J F M A M J J A S O N D J F M A M J J A S O N D J F M A M J J A S O N D J F M A M J J A S O N D J J F M A M J J A S O N D J F M A M J J A S O N D J F M A M J J A S O N D J F M A M J J A S O N D J 0% 20% 40% 60% 80% Pct.ofClosedSales PaidinCash 0 2,000 4,000 6,000 8,000 CashSales Monthly Market Detail - January 2018 2014 2015 2016 2017 Florida Townhouses and Condos Cash Sales The number of Closed Sales during the month in which buyers exclusively paid in cash 2014 2015 2016 2017 Cash Sales as a Percentage of Closed Sales The percentage of Closed Sales during the month which were Cash Sales
- 14. Produced by Florida Realtors® with data provided by Florida's multiple listing services. Statistics for each month compiled from MLS feeds on the 15th day of the following month. Data released on Wednesday, February 21, 2018. Next data release is Wednesday, March 21, 2018. Month Median Sale Price Percent Change Year-over-Year January 2018 $179,900 11.7% Year-to-Date $179,900 11.7% June 2017 $176,820 7.2% December 2017 $180,000 7.8% November 2017 $176,000 8.6% August 2017 $170,000 6.3% July 2017 $170,950 6.8% October 2017 $170,000 5.2% September 2017 $173,000 8.1% May 2017 $178,000 8.1% April 2017 $172,000 7.2% March 2017 $171,000 9.4% February 2017 $167,500 11.7% January 2017 $161,000 6.6% Month Average Sale Price Percent Change Year-over-Year January 2018 $286,404 17.1% December 2017 $261,604 11.1% November 2017 $242,765 0.8% October 2017 $235,345 6.2% 10.7% September 2017 $239,877 7.9% August 2017 $234,983 5.5% July 2017 $244,892 9.8% June 2017 $255,717 5.9% May 2017 $261,620 8.0% 17.1%$286,404Year-to-Date Economists' note : Median Sale Price is our preferred summary statistic for price activity because, unlike Average Sale Price, Median Sale Price is not sensitive to high sale prices for small numbers of homes that may not be characteristic of the market area. Keep in mind that median price trends over time are not always solely caused by changes in the general value of local real estate. Median sale price only reflects the values of the homes that sold each month, and the mix of the types of homes that sell can change over time. Economists' note : Usually, we prefer Median Sale Price over Average Sale Price as a summary statistic for home prices. However, Average Sale Price does have its uses—particularly when it is analyzed alongside the Median Sale Price. For one, the relative difference between the two statistics can provide some insight into the market for higher-end homes in an area. February 2017 $240,977 8.5% January 2017 $244,520 4.0% April 2017 $252,582 -0.9% March 2017 $255,298 J F M A M J J A S O N D J F M A M J J A S O N D J F M A M J J A S O N D J F M A M J J A S O N D J J F M A M J J A S O N D J F M A M J J A S O N D J F M A M J J A S O N D J F M A M J J A S O N D J $0K $50K $100K $150K $200K $250K $300K $350K AverageSalePrice $0K $50K $100K $150K $200K MedianSalePrice Monthly Market Detail - January 2018 2014 2015 2016 2017 Florida Townhouses and Condos Median Sale Price The median sale price reported for the month (i.e. 50% of sales were above and 50% of sales were below) 2014 2015 2016 2017 Average Sale Price The average sale price reported for the month (i.e. total sales in dollars divided by the number of sales)
- 15. Produced by Florida Realtors® with data provided by Florida's multiple listing services. Statistics for each month compiled from MLS feeds on the 15th day of the following month. Data released on Wednesday, February 21, 2018. Next data release is Wednesday, March 21, 2018. Month Dollar Volume Percent Change Year-over-Year January 2018 $2.2 Billion 24.0% Year-to-Date $2.2 Billion 24.0% 11.1% December 2017 $2.4 Billion 17.8% November 2017 $2.0 Billion 6.7% $2.6 Billion -4.9% October 2017 $1.9 Billion 8.6% September 2017 $1.8 Billion -9.2% August 2017 $2.3 Billion 8.3% July 2017 $2.3 Billion 13.7% June 2017 $2.8 Billion January 2018 95.0% 0.4% December 2017 95.1% 0.4% November 2017 95.1% 0.4% October 2017 95.0% 0.2% 0.2% September 2017 95.0% 0.2% August 2017 95.1% 0.5% July 2017 95.0% 0.4% June 2017 94.8% 0.2% May 2017 94.7% 0.1% Economists' note : The Median Percent of Original List Price Received is useful as an indicator of market recovery, since it typically rises as buyers realize that the market may be moving away from them and they need to match the selling price (or better it) in order to get a contract on the house. This is usually the last measure to indicate a market has shifted from down to up, so it is what we would call a lagging indicator. Economists' note : Dollar Volume is simply the sum of all sale prices in a given time period, and can quickly be calculated by multiplying Closed Sales by Average Sale Price. It is a strong indicator of the health of the real estate industry in a market, and is of particular interest to real estate professionals, investors, analysts, and government agencies. Potential home sellers and home buyers, on the other hand, will likely be better served by paying attention to trends in the two components of Dollar Volume (i.e. sales and prices) individually. 0.4%95.0%Year-to-Date Month Med. Pct. of Orig. List Price Received Percent Change Year-over-Year February 2017 94.7% 0.3% January 2017 January 2017 $1.8 Billion 10.4% March 2017 94.6% 0.2% April 2017 94.7% May 2017 $3.0 Billion 16.7% April 2017 $2.9 Billion 23.2% February 2017 $1.9 Billion 12.9% 0.2% March 2017 94.7% J F M A M J J A S O N D J F M A M J J A S O N D J F M A M J J A S O N D J F M A M J J A S O N D J J F M A M J J A S O N D J F M A M J J A S O N D J F M A M J J A S O N D J F M A M J J A S O N D J 0% 20% 40% 60% 80% 100% Med.Pct.ofOrig. ListPriceReceived $0 $500 M $1 B $2 B $2 B $3 B $3 B $4 B DollarVolume Monthly Market Detail - January 2018 2014 2015 2016 2017 Florida Townhouses and Condos Dollar Volume The sum of the sale prices for all sales which closed during the month 2014 2015 2016 2017 Median Percent of Original List Price Received The median of the sale price (as a percentage of the original list price) across all properties selling during the month
- 16. Produced by Florida Realtors® with data provided by Florida's multiple listing services. Statistics for each month compiled from MLS feeds on the 15th day of the following month. Data released on Wednesday, February 21, 2018. Next data release is Wednesday, March 21, 2018. 52 Days 0.0% October 2017 50 Days -3.8% May 2017 49 Days -2.0% Month Median Time to Contract Percent Change Year-over-Year January 2018 49 Days -7.5% 49 Days -7.5%Year-to-Date December 2017 47 Days -9.6% November 2017 July 2017 50 Days -3.8% June 2017 52 Days 0.0% September 2017 47 Days -14.5% August 2017 49 Days -9.3% 50 Days 4.2% March 2017 52 Days 6.1% April 2017 February 2017 59 Days 1.7% January 2017 53 Days -1.9% Month Median Time to Sale Percent Change Year-over-Year January 2018 90 Days -6.3% -6.3%90 DaysYear-to-Date December 2017 84 Days -11.6% November 2017 91 Days -5.2% 0.0% October 2017 93 Days -3.1% September 2017 93 Days -6.1% August 2017 91 Days -7.1% July 2017 91 Days -6.2% June 2017 94 Days -4.1% January 2017 96 Days -2.0% Economists' note : Time to Sale is a measure of the length of the home selling process, calculated as the number of days between the initial listing of a property and the closing of the sale. Median Time to Sale is the amount of time the "middle" property selling this month was on the market. That is, 50% of homes selling this month took less time to sell, and 50% of homes took more time to sell. Median Time to Sale gives a more accurate picture than Average Time to Sale, which can be skewed upward by small numbers of properties taking an abnormally long time to sell. Economists' note : Like Time to Sale, Time to Contract is a measure of the length of the home selling process calculated for sales which closed during the month. The difference is that Time to Contract measures the number of days between the initial listing of a property and the signing of the contract which eventually led to the closing of the sale. When the gap between Median Time to Contract and Median Time to Sale grows, it is usually a sign of longer closing times and/or declining numbers of cash sales. March 2017 92 Days 1.1% February 2017 98 Days -1.0% May 2017 91 Days -3.2% April 2017 90 Days J F M A M J J A S O N D J F M A M J J A S O N D J F M A M J J A S O N D J F M A M J J A S O N D J J F M A M J J A S O N D J F M A M J J A S O N D J F M A M J J A S O N D J F M A M J J A S O N D J 0 20 40 60 80 100 120 MedianTimeto Sale 0 20 40 60 80 MedianTimeto ContractMonthly Market Detail - January 2018 2014 2015 2016 2017 Florida Townhouses and Condos Median Time to Contract The median number of days between the listing date and contract date for all Closed Sales during the month 2014 2015 2016 2017 Median Time to Sale The median number of days between the listing date and closing date for all Closed Sales during the month
- 17. Produced by Florida Realtors® with data provided by Florida's multiple listing services. Statistics for each month compiled from MLS feeds on the 15th day of the following month. Data released on Wednesday, February 21, 2018. Next data release is Wednesday, March 21, 2018. Economists' note : New Listings tend to rise in delayed response to increasing prices, so they are often seen as a lagging indicator of market health. As prices rise, potential sellers raise their estimations of value—and in the most recent cycle, rising prices have freed up many potential sellers who were previously underwater on their mortgages. Note that in our calculations, we take care to not include properties that were recently taken off the market and quickly relisted, since these are not really new listings. Economists' note : Because of the typical length of time it takes for a sale to close, economists consider Pending Sales to be a decent indicator of potential future Closed Sales. It is important to bear in mind, however, that not all Pending Sales will be closed successfully. So, the effectiveness of Pending Sales as a future indicator of Closed Sales is susceptible to changes in market conditions such as the availability of financing for homebuyers and the inventory of distressed properties for sale. Month New Pending Sales Percent Change Year-over-Year January 2018 11,319 8.1% Year-to-Date 11,319 8.1% June 2017 10,983 6.4% December 2017 8,313 3.6% November 2017 9,533 9.3% August 2017 11,097 8.1% July 2017 10,279 3.6% October 2017 9,800 12.9% September 2017 6,336 -32.7% May 2017 11,752 8.5% April 2017 11,592 -5.5% March 2017 13,510 7.4% February 2017 11,297 0.5% January 2017 10,469 6.5% Month New Listings Percent Change Year-over-Year January 2018 16,653 3.6% December 2017 10,507 -0.8% November 2017 13,165 5.9% October 2017 13,521 14.6% 12,789 4.2% May 2017 13,607 5.9% January 2017 16,069 0.9% April 2017 13,349 -8.1% March 2017 15,495 -0.1% Year-to-Date 16,653 3.6% February 2017 14,327 -11.0% September 2017 8,196 -31.1% August 2017 12,771 3.2% July 2017 11,920 5.5% June 2017 J F M A M J J A S O N D J F M A M J J A S O N D J F M A M J J A S O N D J F M A M J J A S O N D J J F M A M J J A S O N D J F M A M J J A S O N D J F M A M J J A S O N D J F M A M J J A S O N D J 0 5,000 10,000 15,000 20,000 NewListings 0 5,000 10,000 15,000 PendingSales Monthly Market Detail - January 2018 2014 2015 2016 2017 Florida Townhouses and Condos New Pending Sales The number of listed properties that went under contract during the month 2014 2015 2016 2017 New Listings The number of properties put onto the market during the month
- 18. Produced by Florida Realtors® with data provided by Florida's multiple listing services. Statistics for each month compiled from MLS feeds on the 15th day of the following month. Data released on Wednesday, February 21, 2018. Next data release is Wednesday, March 21, 2018. Economists' note : There are a number of ways to define and calculate Inventory. Our method is to simply count the number of active listings on the last day of the month, and hold this number to compare with the same month the following year. Inventory rises when New Listings are outpacing the number of listings that go off-market (regardless of whether they actually sell). Likewise, it falls when New Listings aren't keeping up with the rate at which homes are going off-market. Economists' note : MSI is a useful indicator of market conditions. The benchmark for a balanced market (favoring neither buyer nor seller) is 5.5 months of inventory. Anything higher is traditionally a buyers' market, and anything lower is a sellers' market. There is no single accepted way of calculating MSI. A common method is to divide current Inventory by the most recent month's Closed Sales count, but this count is a usually poor predictor of future Closed Sales due to seasonal cycles. To eliminate seasonal effects, we use the 12-month average of monthly Closed Sales instead. YTD (Monthly Avg) 5.9 -7.8% Month Months Supply Percent Change Year-over-Year January 2017 6.4 10.3% March 2017 6.3 1.6% February 2017 6.4 January 2017 57,784 6.3% March 2017 57,204 -0.1% February 2017 58,205 1.3% 3.2% May 2017 6.0 -1.6% April 2017 6.1 -1.6% July 2017 5.6 -3.4% June 2017 5.8 -1.7% September 2017 5.5 -3.5% August 2017 5.4 -5.3% November 2017 5.7 -5.0% October 2017 5.6 -5.1% January 2018 5.9 -7.8% December 2017 5.6 -6.7% 55,895 -1.3% July 2017 51,992 -1.2% June 2017 53,389 -1.2% May 2017 55,134 -1.4% April 2017 -3.4% September 2017 49,948 -3.8% August 2017 50,519 -3.1% October 2017 51,275 Month Inventory Percent Change Year-over-Year January 2018 54,988 -4.8% 54,988 -4.8%YTD (Monthly Avg) December 2017 51,720 -4.0% November 2017 52,807 -3.4% J F M A M J J A S O N D J F M A M J J A S O N D J F M A M J J A S O N D J F M A M J J A S O N D J J F M A M J J A S O N D J F M A M J J A S O N D J F M A M J J A S O N D J F M A M J J A S O N D J 0.0 1.0 2.0 3.0 4.0 5.0 6.0 7.0 MonthsSupplyof Inventory 0 10,000 20,000 30,000 40,000 50,000 60,000 70,000 Inventory Monthly Market Detail - January 2018 2014 2015 2016 2017 Florida Townhouses and Condos Inventory (Active Listings) The number of property listings active at the end of the month 2014 2015 2016 2017 Months Supply of Inventory An estimate of the number of months it will take to deplete the current Inventory given recent sales rates
- 19. Produced by Florida Realtors® with data provided by Florida's multiple listing services. Statistics for each month compiled from MLS feeds on the 15th day of the following month. Data released on Wednesday, February 21, 2018. Next data release is Wednesday, March 21, 2018. $600,000 - $999,999 104 Days -10.3% $1,000,000 or more 69 Days -55.8% Economists' note : Like Time to Sale, Time to Contract is a measure of the length of the home selling process calculated for sales which closed during the month. The difference is that Time to Contract measures the number of days between the initial listing of a property and the signing of the contract which eventually led to the closing of the sale. When the gap between Median Time to Contract and Median Time to Sale grows, it is usually a sign of longer closing times and/or declining numbers of cash sales. $150,000 - $199,999 44 Days -8.3% $200,000 - $249,999 51 Days -5.6% $250,000 - $299,999 $400,000 - $599,999 91 Days -23.5% 65 Days -11.0% $300,000 - $399,999 63 Days -16.0% Economists' note: Closed Sales are one of the simplest—yet most important—indicators for the residential real estate market. When comparing Closed Sales across markets of different sizes, we recommend comparing the percent changes in sales rather than the number of sales. Closed Sales (and many other market metrics) are affected by seasonal cycles, so actual trends are more accurately represented by year-over-year changes (i.e. comparing a month's sales to the amount of sales in the same month in the previous year), rather than changes from one month to the next. Sale Price Median Time to Contract Percent Change Year-over-Year Less than $50,000 65 Days 41.3% $1,000,000 or more 324 81.0% $250,000 - $299,999 634 13.2% $300,000 - $399,999 647 12.5% $50,000 - $99,999 38 Days -2.6% $100,000 - $149,999 $400,000 - $599,999 498 29.4% $600,000 - $999,999 283 6.4% 36 Days -10.0% $150,000 - $199,999 1,324 11.3% $200,000 - $249,999 978 21.0% $100,000 - $149,999 1,540 1.7% Sale Price Closed Sales Percent Change Year-over-Year Less than $50,000 229 -39.4% $50,000 - $99,999 1,177 -13.1% 0 20 40 60 80 100 120 140 160 180 Less than $50,000 $50,000 - $99,999 $100,000 - $149,999 $150,000 - $199,999 $200,000 - $249,999 $250,000 - $299,999 $300,000 - $399,999 $400,000 - $599,999 $600,000 - $999,999 $1,000,000 or more MedianTimetoContract January 2017 January 2018 0 20 40 60 80 100 120 140 160 180 0 200 400 600 800 1,000 1,200 1,400 1,600 1,800 Less than $50,000 $50,000 - $99,999 $100,000 - $149,999 $150,000 - $199,999 $200,000 - $249,999 $250,000 - $299,999 $300,000 - $399,999 $400,000 - $599,999 $600,000 - $999,999 $1,000,000 or more ClosedSales January 2017 January 2018 0 200 400 600 800 1,000 1,200 1,400 1,600 1,800 Monthly Market Detail - January 2018 Florida Townhouses and Condos Closed Sales by Sale Price The number of sales transactions which closed during the month Median Time to Contract by Sale Price The median number of days between the listing date and contract date for all Closed Sales during the month
- 20. Produced by Florida Realtors® with data provided by Florida's multiple listing services. Statistics for each month compiled from MLS feeds on the 15th day of the following month. Data released on Wednesday, February 21, 2018. Next data release is Wednesday, March 21, 2018. $600,000 - $999,999 5,439 2.5% $1,000,000 or more 5,195 0.7% Economists' note : There are a number of ways to define and calculate Inventory. Our method is to simply count the number of active listings on the last day of the month, and hold this number to compare with the same month the following year. Inventory rises when New Listings are outpacing the number of listings that go off-market (regardless of whether they actually sell). Likewise, it falls when New Listings aren't keeping up with the rate at which homes are going off-market. $150,000 - $199,999 6,888 -2.5% $200,000 - $249,999 5,925 -3.5% $250,000 - $299,999 5,515 0.0% $300,000 - $399,999 7,484 -0.7% $400,000 - $599,999 7,215 -2.1% $50,000 - $99,999 4,597 -19.0% $100,000 - $149,999 5,975 -13.1% Current Listing Price Inventory Percent Change Year-over-Year Less than $50,000 755 -33.6% $600,000 - $999,999 989 13.0% $1,000,000 or more 828 9.5% Economists' note: New Listings tend to rise in delayed response to increasing prices, so they are often seen as a lagging indicator of market health. As prices rise, potential sellers raise their estimations of value—and in the most recent cycle, rising prices have freed up many potential sellers who were previously underwater on their mortgages. Note that in our calculations, we take care to not include properties that were recently taken off the market and quickly relisted, since these are not really new listings. $150,000 - $199,999 2,748 11.5% $200,000 - $249,999 2,118 12.1% $250,000 - $299,999 1,632 6.7% $300,000 - $399,999 1,941 13.3% $400,000 - $599,999 1,481 4.6% $50,000 - $99,999 1,962 -12.6% $100,000 - $149,999 2,692 -2.2% Initial Listing Price New Listings Percent Change Year-over-Year Less than $50,000 262 -38.9% 0 1,000 2,000 3,000 4,000 5,000 6,000 7,000 8,000 Less than $50,000 $50,000 - $99,999 $100,000 - $149,999 $150,000 - $199,999 $200,000 - $249,999 $250,000 - $299,999 $300,000 - $399,999 $400,000 - $599,999 $600,000 - $999,999 $1,000,000 or more Inventory January 2017 January 2018 0 500 1,000 1,500 2,000 2,500 3,000 Less than $50,000 $50,000 - $99,999 $100,000 - $149,999 $150,000 - $199,999 $200,000 - $249,999 $250,000 - $299,999 $300,000 - $399,999 $400,000 - $599,999 $600,000 - $999,999 $1,000,000 or more NewListings January 2017 January 2018 0 1,000 2,000 3,000 4,000 5,000 6,000 7,000 8,000 0 500 1,000 1,500 2,000 2,500 3,000 Monthly Market Detail - January 2018 Florida Townhouses and Condos New Listings by Initial Listing Price The number of properties put onto the market during the month Inventory by Current Listing Price The number of property listings active at the end of the month
- 21. Closed Sales Median Sale Price Closed Sales Median Sale Price Closed Sales Median Sale Price Produced by Florida Realtors® with data provided by Florida's multiple listing services. Statistics for each month compiled from MLS feeds on the 15th day of the following month. Data released on Wednesday, February 21, 2018. Next data release is Wednesday, March 21, 2018. Short Sale 54 80 -32.5% $135,000 $111,000 21.6% Foreclosure/REO 263 413 -36.3% $131,625 $110,000 19.7% January 2018 January 2017 Percent Change Year-over-Year Traditional 7,317 6,716 8.9% $182,000 $167,500 8.7% $0 $20,000 $40,000 $60,000 $80,000 $100,000 $120,000 $140,000 $160,000 $180,000 $200,000 MedianSalePrice 0% 10% 20% 30% 40% 50% 60% 70% 80% 90% 100% ClosedSales Traditional Foreclosure/REO Short Sale 2014 2015 2016 2017 J F M A M J J A S O N D J F M A M J J A S O N D J F M A M J J A S O N D J F M A M J J A S O N D J J F M A M J J A S O N D J F M A M J J A S O N D J F M A M J J A S O N D J F M A M J J A S O N D J Monthly Distressed Market - January 2018 Florida Townhouses and Condos 2014 2015 2016 2017