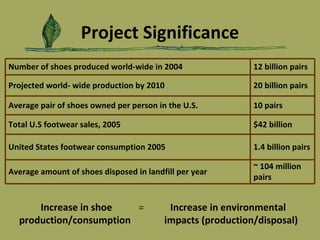
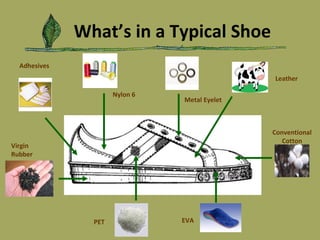
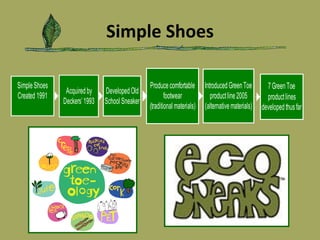
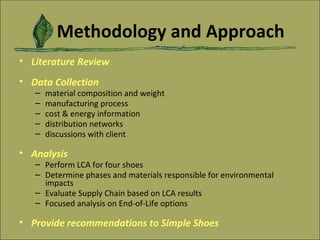
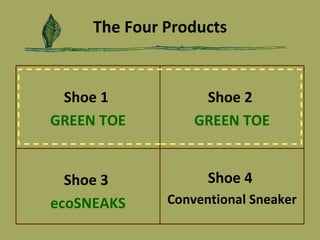
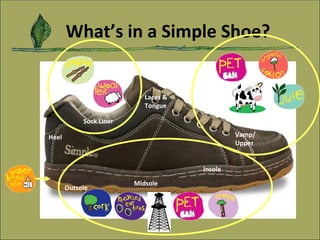
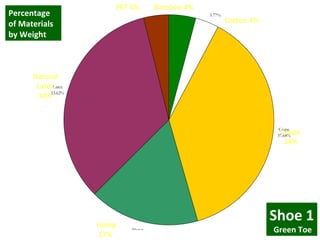
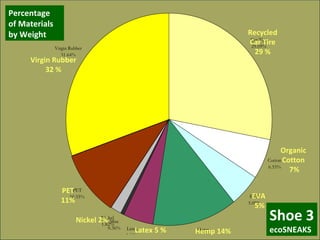
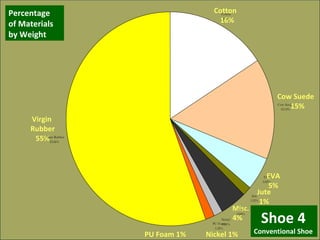
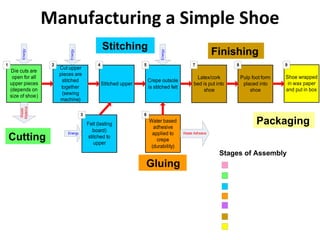
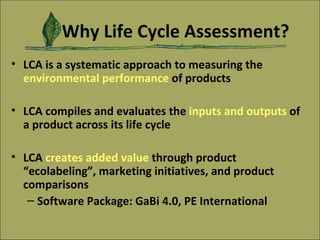
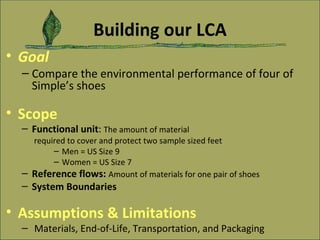
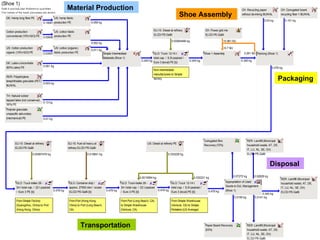
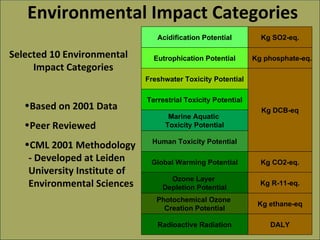
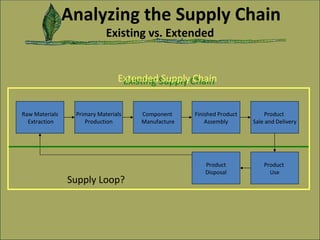
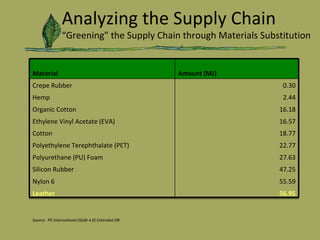
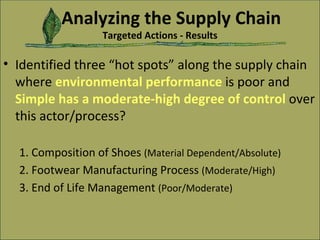
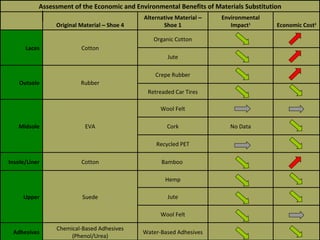
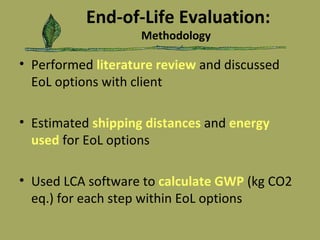
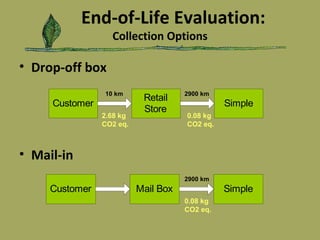
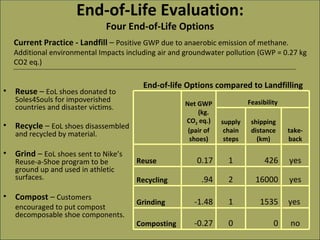
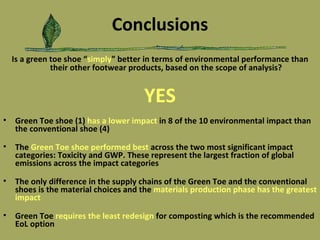
The document presents a lifecycle assessment of footwear supply chains, focusing on four shoe models to evaluate their environmental impacts. It identifies opportunities for improving sustainability through materials substitution and end-of-life management options, detailing material composition and manufacturing processes. The analysis concludes that the 'green toe' shoe demonstrates lower environmental impacts compared to conventional shoes, particularly in toxicity and greenhouse gas potential, and recommends composting as an effective end-of-life option.


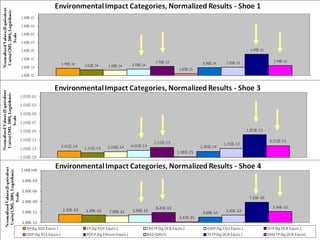
![Life Cycle Assessment Interpretation Environmental Impact Categories Shoe Styles AP [kg SO2-Equiv.] EP [kg P-Equiv] FAETP [kg DCB-Equiv.] GWP [kg CO2-Equiv.] HTP [kg DCB-Equiv.] Shoe 1 0.0171 0.0033 0.0402 1.672 8.482 Shoe 3 0.0092 0.0015 0.0414 1.808 10.469 Shoe 4 0.0695 0.0179 0.1623 7.51 41.03 Shoe Styles ODP [kg R11-Equiv.] POCP [kg Ethene-Equiv.] RAD [DALY] TEPT [kg DCB-Equiv.] MAETP [kg DCB-Equiv.] Shoe 1 1.48E-06 3.99E-03 1.40E-08 39.42 140.25 Shoe 3 7.10E-07 1.12E-0 3 1.54E-08 48.51 266.61 Shoe 4 7.59E-07 1.68E-03 1.95E-08 190.96 796.12](https://image.slidesharecdn.com/CopyofSimpleFinalPresentation-123144342666-phpapp03/85/Life-Cycle-Assessment-of-Footwear-for-Simple-Shoes-21-320.jpg)


![Nike Ppt[1]](https://cdn.slidesharecdn.com/ss_thumbnails/nike-ppt14822-thumbnail.jpg?width=640&height=640&fit=bounds)


