Just how "great" was the Great Depression? Using data collected from around the world should help put this era into perspective.
Register to explore the whole course here: https://school.bighistoryproject.com/bhplive?WT.mc_id=Slideshare12202017
The analysis of movement is an important research topic in, for example, geography, ecology, visual analytics, GIScience as well as in application domains such as urban, maritime, and aviation research. Movement data analysis requires tools for the manipulation and visualization of movement or trajectory data. This talk presents the new Python library MovingPandas.org
IGRA has just released additional records and we are now
showing over 3,000,000 records over 15 different categories!
We encourage you to visit our "refreshed" website and do
searches for your family names. The search engine is bilingual and
we suggest you do different searches in English and Hebrew. All
registered users will see the search results. Paid members are able to
see the full record as it was indexed. Our website is still undergoing changes and we hope you will have
patience if we have moments where the site is down in the coming days.
"Excuse our dust" as we continue to improve our site.
Vocabulary is more than just a list of words to memorize. This first activity gets you familiar with the key ideas for the unit.
Register to explore the whole course here: https://school.bighistoryproject.com/bhplive?WT.mc_id=Slideshare12202017
A note on the analytical methodology for the series of cimsec posts on nato d...ff_analytics
A description of the assumptions and basis of the data used for discussion and various graphs included in several essays on NATO defense spending history posted at CIMSEC.org (http://cimsec.org/) in September and October 2014.
It’s time to reject FOMO and embrace Borecore, along with mindfulness apps, myth debunking, and a shift in focus away from Millennials. Mindshare North America's annual Culture Vulture Trends report is here, unveiling the latest consumer shifts and cultural trends forecast to grow over the next year.
The 2009 Trend Report is TrendHunter.com's complete digest of innovation, consumer trends and business ideas brought to you by the world’s largest trend spotting community (a global network of more than 20,000 trend hunters.) Available at: TrendHunter.com/TrendReports
Use www.gapminder.org/data to fill out the data in each of the tables below. To find the data you need, make sure that you have the name of the category. On the gapminder.org/data page, you’ll see a table called “List of indicators in “Gapminder World.” Beneath that title, on the right side of the table, find the
Search box. Type the name of the category into that search area. Once you find the category, click on the magnifying glass on the right. That link will have the data you need to fill out each of the tables below.
Register to explore the whole course here: https://school.bighistoryproject.com/bhplive?WT.mc_id=Slideshare12202017
PART I1)Assume you are hired by the The United Nations C.docxdewhirstichabod
PART I
1)
Assume you are hired by the
The United Nations Children's Fund
as a development economist. Your assignment is to travel to
Sudan
(a resource-rich, agricultural, and poverty-stricken country) to write a report about the extent of poverty and propose policies that can help reduce poverty. Your assignment is two fold: (a) to analyze the economic and social reasons why some people of this rich country are poor; and (b) to develop a set of policy measures that could help reduce poverty and improve income distribution.
2)
Assume the
United Nations Educational, Scientific, and Cultural Organization
(UNESCO) has hired you as a development economist. Your assignment is to travel to
Jamaica
, where people living in rural areas rush to migrate to the capital city of
Kingston
.
Write a report on causes of rural-urban migration and propose policies that can help reduce such a massive movement of population.
Your assignment is twofold: (a) to analyze the economic and social reasons why rural people of this country are leaving their hometowns and villages; and (b) to develop a set of policy measures that could help reduce rural-urban migration.
Important Instructions FOR two questions:
Write a detailed essay of about 500 words to answer each question based on textbook reading. Write the beginning and ending page numbers of the textbook at the outset of your answer.
PART II
1.
Explain the International Dependence model and the False Paradigm model of economic development. Are these models realistic illustrations of the MDC-LDC economic relations? Explain how these models explain the underdevelopment of the Third World?
2.
What are the principal sources of economic growth? How do you illustrate economic growth using the Production Possibility Curve? Depict and explain the effects of technological improvement in production of two goods: one land-intensive (e.g., rice) and the other capital-intensive (e.g., radio). Depict and explain the effects of persistent unemployment in production of rice.
3.
Present the Lewis model of structural transformation from rural-agricultural to urban-industrial production. Explain, illustrate, and criticize the validity of the model.
4.
Present the Malthusian Trap theory of population growth. Discuss why the human society has been able to avoid the trap. Find a developing country that has fallen into this trap, and a developing country that has avoided falling into this trap.
Important Instructions
For each question, write a detailed essay of about 300 words to answer each question based on textbook reading. Write the beginning and ending page numbers of the textbook at the outset of your answer.
.
1
Macroeconomics Tutorial Map (provisional)
Topics Lecture (date)
■ Introduction; Scarcity and choice, market system,
positive and normative, alternative systems
1: F (9/01)
■ Introduction: the PPC, benefits of trade
■ Introduction; Four key macroeconomic variables;
definitions; policy goals;
2: F 9/08
■ The circular flow of income; injections and
withdrawals
■ Measuring National Income 3: F 9/15
■The limits of growth, resource constraints
■ The business cycle 4: F 9/22
■ Introduction to Demand and Supply
■ First In-class TEST Receive 1st take-home
assignment
■Unemployment – measures causes and types 5: F 9/29
■ Unemployment II – measures causes and types
28
Macroeconomics Tutorial Map (provisional)
Topics Lecture (date)
■ Aggregate Demand and Aggregate Supply II –
what drives National Income?
6: F 10/06
■ Aggregate Demand, Supply and Inflation I
■ Aggregate Demand, Supply and Inflation II 7: F 10/13
■ Inflation – more on inflation
■ Fiscal Policy 8: F 10/20
■ Fiscal Policy
■ Second In-Class Test Receive 2nd take-home
assignment
■ The importance of money. Monetary Policy 9: F 10/27
■ The banking system and interest rates
■ More on monetary policy 10: F 11/03
■ NO CLASS F 11/10
■ Supply-side policy I
■ More on supply side, and productivity II
■ Key Supply-side policy choices
11: F 11/17
29
2nd
Assignment
Due
1st As’mt
Due
Macroeconomics Tutorial Map (provisional)
Topics Lecture (date)
■ NO CLASS 11/24
■ Third In-class TEST Receive 3rd take-home
assignment
13: F 12/01
■ International Trade - Reasons for Trade
■ Evaluating Trade and Trade Policy
■ Balance of Payments
■ Exchange rates
■ Exchange rates and macroeconomic policy
■ Examining policy choices
14: F 12/08
■ FINAL EXAM 9:30AM F 12/15
30
■ Tutorial map
l I reserve the right to change this schedule at any time. I will
need to get used to the pace of the class. I may include or
exclude topics depending upon how we are progressing
l IN THE EVENT OF A CONFLICT BETWEEN THE SCHEDULE
HERE AND THE SYLLABUS, THE MOST RECENT SLIDE PACK
TAKES PRECEDENT
3rd Assignment
Due
Macroeconomics
LECTURES 3 & 4
2
Macroeconomics
■ Last time
l The role of government in managing the economy and
alternative economic systems
l Introduction to the 4 key economic variables
l The Economic Cycle and Circular Flow of Income
l Injections and withdrawals
l An overview of the relationship between the four key
Macroeconomic objectives
l Measuring National Income – real vs. nominal
■ Today – National Income Accounts
l Why growth?
l Measuring National Income
l The limits of growth, resource constraints
l The business cycle
165
Macroeconomics
Assignment:
Read McC & B Ch 7 for National Income Accounting
(read all of the chapter now if you like. We will deal
with the shortcomings of GDP as a measure next time)
165
ANY QUESTIONS ON THE
READING OR THE SLIDES FROM
LAST LESSON?
Macroeconomics
■ The first of the four key economic goals: Economic growth
l Usual ...
“To what extent has the Modern Revolution been a positive or a negative force?” is the driving question for Unit 9. The purpose of this activity is to apply Unit 9’s driving question
to a modern-day infrastructure development: the Interoceanic Highway (La Carretera). Construction on La Carretera, which connects the east and west coasts of South America, began in the early twenty-first century. By studying the scenes depicted in a photojournalist’s photographic essay, students will come to their own conclusions about the extent to which this road has been a positive or negative force as related to certain trends and topics (economic development and natural environment, for example). This activity will also help prepare students for Investigation 9, in which they’re asked to identify good and bad outcomes of trends referenced in the Investigation texts.
This activity will give students a chance to review some of what they learned in this lesson, and use it to think more deeply about what and how they would communicate with an alien species.
Register to explore the whole course here: https://school.bighistoryproject.com/bhplive?WT.mc_id=Slideshare12202017
More Related Content
Similar to Lesson 9.6 Activity: Understanding the Consequences of the Global Depression
It’s time to reject FOMO and embrace Borecore, along with mindfulness apps, myth debunking, and a shift in focus away from Millennials. Mindshare North America's annual Culture Vulture Trends report is here, unveiling the latest consumer shifts and cultural trends forecast to grow over the next year.
The 2009 Trend Report is TrendHunter.com's complete digest of innovation, consumer trends and business ideas brought to you by the world’s largest trend spotting community (a global network of more than 20,000 trend hunters.) Available at: TrendHunter.com/TrendReports
Use www.gapminder.org/data to fill out the data in each of the tables below. To find the data you need, make sure that you have the name of the category. On the gapminder.org/data page, you’ll see a table called “List of indicators in “Gapminder World.” Beneath that title, on the right side of the table, find the
Search box. Type the name of the category into that search area. Once you find the category, click on the magnifying glass on the right. That link will have the data you need to fill out each of the tables below.
Register to explore the whole course here: https://school.bighistoryproject.com/bhplive?WT.mc_id=Slideshare12202017
PART I1)Assume you are hired by the The United Nations C.docxdewhirstichabod
PART I
1)
Assume you are hired by the
The United Nations Children's Fund
as a development economist. Your assignment is to travel to
Sudan
(a resource-rich, agricultural, and poverty-stricken country) to write a report about the extent of poverty and propose policies that can help reduce poverty. Your assignment is two fold: (a) to analyze the economic and social reasons why some people of this rich country are poor; and (b) to develop a set of policy measures that could help reduce poverty and improve income distribution.
2)
Assume the
United Nations Educational, Scientific, and Cultural Organization
(UNESCO) has hired you as a development economist. Your assignment is to travel to
Jamaica
, where people living in rural areas rush to migrate to the capital city of
Kingston
.
Write a report on causes of rural-urban migration and propose policies that can help reduce such a massive movement of population.
Your assignment is twofold: (a) to analyze the economic and social reasons why rural people of this country are leaving their hometowns and villages; and (b) to develop a set of policy measures that could help reduce rural-urban migration.
Important Instructions FOR two questions:
Write a detailed essay of about 500 words to answer each question based on textbook reading. Write the beginning and ending page numbers of the textbook at the outset of your answer.
PART II
1.
Explain the International Dependence model and the False Paradigm model of economic development. Are these models realistic illustrations of the MDC-LDC economic relations? Explain how these models explain the underdevelopment of the Third World?
2.
What are the principal sources of economic growth? How do you illustrate economic growth using the Production Possibility Curve? Depict and explain the effects of technological improvement in production of two goods: one land-intensive (e.g., rice) and the other capital-intensive (e.g., radio). Depict and explain the effects of persistent unemployment in production of rice.
3.
Present the Lewis model of structural transformation from rural-agricultural to urban-industrial production. Explain, illustrate, and criticize the validity of the model.
4.
Present the Malthusian Trap theory of population growth. Discuss why the human society has been able to avoid the trap. Find a developing country that has fallen into this trap, and a developing country that has avoided falling into this trap.
Important Instructions
For each question, write a detailed essay of about 300 words to answer each question based on textbook reading. Write the beginning and ending page numbers of the textbook at the outset of your answer.
.
1
Macroeconomics Tutorial Map (provisional)
Topics Lecture (date)
■ Introduction; Scarcity and choice, market system,
positive and normative, alternative systems
1: F (9/01)
■ Introduction: the PPC, benefits of trade
■ Introduction; Four key macroeconomic variables;
definitions; policy goals;
2: F 9/08
■ The circular flow of income; injections and
withdrawals
■ Measuring National Income 3: F 9/15
■The limits of growth, resource constraints
■ The business cycle 4: F 9/22
■ Introduction to Demand and Supply
■ First In-class TEST Receive 1st take-home
assignment
■Unemployment – measures causes and types 5: F 9/29
■ Unemployment II – measures causes and types
28
Macroeconomics Tutorial Map (provisional)
Topics Lecture (date)
■ Aggregate Demand and Aggregate Supply II –
what drives National Income?
6: F 10/06
■ Aggregate Demand, Supply and Inflation I
■ Aggregate Demand, Supply and Inflation II 7: F 10/13
■ Inflation – more on inflation
■ Fiscal Policy 8: F 10/20
■ Fiscal Policy
■ Second In-Class Test Receive 2nd take-home
assignment
■ The importance of money. Monetary Policy 9: F 10/27
■ The banking system and interest rates
■ More on monetary policy 10: F 11/03
■ NO CLASS F 11/10
■ Supply-side policy I
■ More on supply side, and productivity II
■ Key Supply-side policy choices
11: F 11/17
29
2nd
Assignment
Due
1st As’mt
Due
Macroeconomics Tutorial Map (provisional)
Topics Lecture (date)
■ NO CLASS 11/24
■ Third In-class TEST Receive 3rd take-home
assignment
13: F 12/01
■ International Trade - Reasons for Trade
■ Evaluating Trade and Trade Policy
■ Balance of Payments
■ Exchange rates
■ Exchange rates and macroeconomic policy
■ Examining policy choices
14: F 12/08
■ FINAL EXAM 9:30AM F 12/15
30
■ Tutorial map
l I reserve the right to change this schedule at any time. I will
need to get used to the pace of the class. I may include or
exclude topics depending upon how we are progressing
l IN THE EVENT OF A CONFLICT BETWEEN THE SCHEDULE
HERE AND THE SYLLABUS, THE MOST RECENT SLIDE PACK
TAKES PRECEDENT
3rd Assignment
Due
Macroeconomics
LECTURES 3 & 4
2
Macroeconomics
■ Last time
l The role of government in managing the economy and
alternative economic systems
l Introduction to the 4 key economic variables
l The Economic Cycle and Circular Flow of Income
l Injections and withdrawals
l An overview of the relationship between the four key
Macroeconomic objectives
l Measuring National Income – real vs. nominal
■ Today – National Income Accounts
l Why growth?
l Measuring National Income
l The limits of growth, resource constraints
l The business cycle
165
Macroeconomics
Assignment:
Read McC & B Ch 7 for National Income Accounting
(read all of the chapter now if you like. We will deal
with the shortcomings of GDP as a measure next time)
165
ANY QUESTIONS ON THE
READING OR THE SLIDES FROM
LAST LESSON?
Macroeconomics
■ The first of the four key economic goals: Economic growth
l Usual ...
Similar to Lesson 9.6 Activity: Understanding the Consequences of the Global Depression (20)
“To what extent has the Modern Revolution been a positive or a negative force?” is the driving question for Unit 9. The purpose of this activity is to apply Unit 9’s driving question
to a modern-day infrastructure development: the Interoceanic Highway (La Carretera). Construction on La Carretera, which connects the east and west coasts of South America, began in the early twenty-first century. By studying the scenes depicted in a photojournalist’s photographic essay, students will come to their own conclusions about the extent to which this road has been a positive or negative force as related to certain trends and topics (economic development and natural environment, for example). This activity will also help prepare students for Investigation 9, in which they’re asked to identify good and bad outcomes of trends referenced in the Investigation texts.
This activity will give students a chance to review some of what they learned in this lesson, and use it to think more deeply about what and how they would communicate with an alien species.
Register to explore the whole course here: https://school.bighistoryproject.com/bhplive?WT.mc_id=Slideshare12202017
Circling one star among hundreds of billions, in one galaxy among a hundred billion more, in a Universe that is vast and expanding ever faster – perhaps toward infinity. It’s easy to forget that we live in a place of astonishing grandeur and mystery.
Register to explore the whole course here: https://school.bighistoryproject.com/bhplive?WT.mc_id=Slideshare12202017
Unit 9: Comparing the Costs of Renewable and Conventional Energy SourcesBig History Project
You can’t get too far in a discussion about the nation’s electric power sector without running into the question of costs.
Register to explore the whole course here: https://school.bighistoryproject.com/bhplive?WT.mc_id=Slideshare12202017
This quick activity will get students brainstorming about life on Mars and what they would need to survive there.
Register to explore the whole course here: https://school.bighistoryproject.com/bhplive?WT.mc_id=Slideshare12202017
Spanning three centuries of history, from the dawn of the industrial age to modern times, three diverse
thinkers developed their own landmark theories on commerce, labor, and the global economy.
Register to explore the whole course here: https://school.bighistoryproject.com/bhplive?WT.mc_id=Slideshare12202017
In the final essay of a four-part series, David Christian explains
how advances in communication and transportation accelerated
collective learning.
Register to explore the whole course here: https://school.bighistoryproject.com/bhplive?WT.mc_id=Slideshare12202017
Lesson 9.2 Activity: The Impact of Population Growth EssayBig History Project
For this closing activity, students will construct an essay in which they discuss what they think are the three biggest impacts of human population growth in the modern era. By looking more closely at population growth, they will deepen their understanding of the impact of acceleration and will think about themselves in relation to population growth and the effect it might have on their own futures.
Register to explore the whole course here: https://school.bighistoryproject.com/bhplive?WT.mc_id=Slideshare12202017
Unit 8: Guns, Germs, and Steel: The Fates of Human SocietiesBig History Project
Jared Mason Diamond (1937 — ) is an American scientist and author whose work draws from a variety of fields. He is currently a professor of geography and of physiology at UCLA. His 1997 book, Guns, Germs, and Steel: The Fates of Human
Societies, from which the following passages are excerpted, won the 1998 Pulitzer Prize for general nonfiction and the Aventis Prize for Best Science Book. The basic premise of the book is to explain why Eurasian civilizations have survived
and conquered others, while refuting the idea that Eurasian hegemony is due to intellectual, moral, or genetic superiority.
Register to explore the whole course here: https://school.bighistoryproject.com/bhplive?WT.mc_id=Slideshare12202017
Making comparisons is an important intellectual tool for all people and especially for historians and scientists. Historians, in particular, make comparisons across time to understand what
has changed and what has remained constant. This question looks at the spread of plague and our collective reaction to plague at two different times in human history—the fourteenth century and the nineteenth century. Such a comparison enables us to see clearly how we have changed.
Register to explore the whole course here: https://school.bighistoryproject.com/bhplive?WT.mc_id=Slideshare12202017
Lesson 8.3 Activity: Revising Investigation Writing - Sentence Starters Part 2Big History Project
Students have examined and revised an Investigation writing sample based on Criteria A, B, and C of the rubric. Now, they’ll undergo the same process with a peer essay. In addition, they’ll do this alone instead of in groups. So, although the process is the same as in the last Investigation writing activity, this one might be more difficult since students will move away from group work and will complete this worksheet on their own. However, it’s important for students to be able to accomplish this exercise on their own since in the next lesson, they’ll apply this same process to their own writing. Again, while the categories in the rubric are a useful tool for initially understanding the different elements of writing, they need to be looked at as a whole since the areas of focus are interrelated.
Register to explore the whole course here: https://school.bighistoryproject.com/bhplive?WT.mc_id=Slideshare12202017
Unit 8: When Humans Became Inhumane: The Atlantic Slave TradeBig History Project
Once Europeans had figured out how to be effective middlemen — buying and selling silver, tea, and fur, they turned to figuring out how to also become producers of the commodities they were trading.
Register to explore the whole course here: https://school.bighistoryproject.com/bhplive?WT.mc_id=Slideshare12202017
Unit 8: Investigating the Consequences of the Columbian ExchangeBig History Project
A new era in human history began in 1492 as the four world zones became connected. For the first time, humans created truly global networks.
Register to explore the whole course here: https://school.bighistoryproject.com/bhplive?WT.mc_id=Slideshare12202017
The account of the travels of the Muslim legal scholar Ibn Battuta in the first half of the fourteenth century reveals the wide scope of the Muslim world at that time.
Register to explore the whole course here: https://school.bighistoryproject.com/bhplive?WT.mc_id=Slideshare12202017
This collection of biographies provides students with detailed information about the voyages of these explorers including information about their motivation and how they inspired future generations of explorers. These men opened the door to a more interconnected world as the contacts they made helped to create connections between distant peoples and stimulate the growth of exchange networks and long-distance trade.
Register to explore the whole course here: https://school.bighistoryproject.com/bhplive?WT.mc_id=Slideshare12202017
Lesson 7.2 Activity: Essay - Were They Pushed or Did They Jump?Big History Project
You’re going to pick a civilization you’ve already researched, and then use the information from your Early Civilizations Museum Project, your Comparing More Civilizations Worksheet, and your Rise, Fall, and Collapse of Civilizations Worksheet to write a five-paragraph essay about whether that civilization was pushed (external forces were the main cause of its downfall) or it jumped (something internal was responsible—they were their own worst enemy). A “pushed” example: Two empires went to war. You might say the winning empire “pushed” the losing empire into collapse. An example of a civilization having “jumped” can be found in the Easter Island Activity earlier in the course: One of the theories for the collapse of Easter Island is that the inhabitants depleted the natural resources they needed to survive. The people were, in a sense, the cause of their own destruction—they “jumped.”
Register to explore the whole course here: https://school.bighistoryproject.com/bhplive?WT.mc_id=Slideshare12202017
Lesson 7.2 Activity: Social Status, Power, and Human BurialsBig History Project
This activity provides students with an opportunity to start thinking about the impact that farming can have on the way humans live and relate to each other. It will also allow them to think about the kinds of questions archaeologists and historians might ask when they must rely upon artifacts rather than written evidence to learn about the past.
Register to explore the whole course here: https://school.bighistoryproject.com/bhplive?WT.mc_id=Slideshare12202017
Unit 7: Greco-Roman: Early Experiments in Participatory GovernmentBig History Project
Instead of rule by a single person, Athens and Rome developed governments with widespread participation by male elites, which lasted about 170 years in Athens and 480 years in Rome.
Register to explore the whole course here: https://school.bighistoryproject.com/bhplive?WT.mc_id=Slideshare12202017
During the same narrow sliver of cosmic time, cities, states, and civilizations emerged independentlyin several places around the world.
Register to explore the whole course here: https://school.bighistoryproject.com/bhplive?WT.mc_id=Slideshare12202017
As a paleontologist and a Catholic priest, Pierre Teilhard de Chardin formulated his own unique vision for a synthesis of science and religion.
Register to explore the whole course here: https://school.bighistoryproject.com/bhplive?WT.mc_id=Slideshare12202017
Embracing GenAI - A Strategic ImperativePeter Windle
Artificial Intelligence (AI) technologies such as Generative AI, Image Generators and Large Language Models have had a dramatic impact on teaching, learning and assessment over the past 18 months. The most immediate threat AI posed was to Academic Integrity with Higher Education Institutes (HEIs) focusing their efforts on combating the use of GenAI in assessment. Guidelines were developed for staff and students, policies put in place too. Innovative educators have forged paths in the use of Generative AI for teaching, learning and assessments leading to pockets of transformation springing up across HEIs, often with little or no top-down guidance, support or direction.
This Gasta posits a strategic approach to integrating AI into HEIs to prepare staff, students and the curriculum for an evolving world and workplace. We will highlight the advantages of working with these technologies beyond the realm of teaching, learning and assessment by considering prompt engineering skills, industry impact, curriculum changes, and the need for staff upskilling. In contrast, not engaging strategically with Generative AI poses risks, including falling behind peers, missed opportunities and failing to ensure our graduates remain employable. The rapid evolution of AI technologies necessitates a proactive and strategic approach if we are to remain relevant.
Instructions for Submissions thorugh G- Classroom.pptxJheel Barad
This presentation provides a briefing on how to upload submissions and documents in Google Classroom. It was prepared as part of an orientation for new Sainik School in-service teacher trainees. As a training officer, my goal is to ensure that you are comfortable and proficient with this essential tool for managing assignments and fostering student engagement.
A Strategic Approach: GenAI in EducationPeter Windle
Artificial Intelligence (AI) technologies such as Generative AI, Image Generators and Large Language Models have had a dramatic impact on teaching, learning and assessment over the past 18 months. The most immediate threat AI posed was to Academic Integrity with Higher Education Institutes (HEIs) focusing their efforts on combating the use of GenAI in assessment. Guidelines were developed for staff and students, policies put in place too. Innovative educators have forged paths in the use of Generative AI for teaching, learning and assessments leading to pockets of transformation springing up across HEIs, often with little or no top-down guidance, support or direction.
This Gasta posits a strategic approach to integrating AI into HEIs to prepare staff, students and the curriculum for an evolving world and workplace. We will highlight the advantages of working with these technologies beyond the realm of teaching, learning and assessment by considering prompt engineering skills, industry impact, curriculum changes, and the need for staff upskilling. In contrast, not engaging strategically with Generative AI poses risks, including falling behind peers, missed opportunities and failing to ensure our graduates remain employable. The rapid evolution of AI technologies necessitates a proactive and strategic approach if we are to remain relevant.
Macroeconomics- Movie Location
This will be used as part of your Personal Professional Portfolio once graded.
Objective:
Prepare a presentation or a paper using research, basic comparative analysis, data organization and application of economic information. You will make an informed assessment of an economic climate outside of the United States to accomplish an entertainment industry objective.
Lesson 9.6 Activity: Understanding the Consequences of the Global Depression
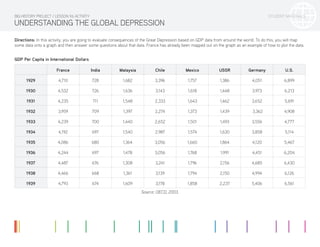
1. STUDENT MATERIALS
UNDERSTANDING THE GLOBAL DEPRESSION
Directions: In this activity, you are going to evaluate consequences of the Great Depression based on GDP data from around the world. To do this, you will map
some data onto a graph and then answer some questions about that data. France has already been mapped out on the graph as an example of how to plot the data.
GDP Per Capita in International Dollars
France India Malaysia Chile Mexico USSR Germany U.S.
1929 4,710 728 1,682 3,396 1,757 1,386 4,051 6,899
1930 4,532 726 1,636 3,143 1,618 1,448 3,973 6,213
1931 4,235 711 1,548 2,333 1,643 1,462 3,652 5,691
1932 3,959 709 1,397 2,274 1,373 1,439 3,362 4,908
1933 4,239 700 1,440 2,652 1,501 1,493 3,556 4,777
1934 4,192 697 1,540 2,987 1,574 1,630 3,858 5,114
1935 4,086 680 1,364 3,056 1,660 1,864 4,120 5,467
1936 4,244 697 1,478 3,056 1,768 1,991 4,451 6,204
1937 4,487 676 1,308 3,241 1,796 2,156 4,685 6,430
1938 4,466 668 1,361 3,139 1,794 2,150 4,994 6,126
1939 4,793 674 1,609 3,178 1,858 2,237 5,406 6,561
Source: OECD, 2003.
BIG HISTORY PROJECT / LESSON 9.6 ACTIVITY
2. TEACHER MATERIALS
UNDERSTANDING THE GLOBAL DEPRESSION(ANSWER KEY)
BIG HISTORY PROJECT / LESSON 9.6 ACTIVITY
GDP Per Capita 1929-1939
7000
6750
6500
6250
6000
5750
5500
5250
5000
4750
4500
4250
4000
3750
3500
3250
3000
2750
2500
2250
2000
1750
1500
1250
1000
750
500
250
0
GDPPerCapita
Years
1929 1930 1931 1932 1933 1934 1935 1936 1937 1938 1939
France
India
Malaysia
Chile
Mexico
USSR
Germany
U.S.
3. TEACHER MATERIALS
UNDERSTANDING THE GLOBAL DEPRESSION(ANSWER KEY)
BIG HISTORY PROJECT / LESSON 9.6 ACTIVITY
Questions:
1. When did most countries hit bottom?
Sample answer: The period between 1931 and 1932 appears to be the worst.
2. Did any countries hit bottom at a different time?
Sample answer: The United States continued to decline into 1933.
3. Which two countries experienced the steepest decline in living standards?
Sample answer: Chile experienced the biggest decline, and the US was a close second.
4. One country actually experienced an increase in GDP during this time. Which one was it? Give a hypothesis about why this might have happened.
Sample answer: The USSR experienced an increase.
5. Does it seem that most countries had recovered by the late 1930s? Are there any that didn’t? Give some examples and provide the relevant data.
Sample answer: By 1939, it looks like almost all countries had recovered except for India. India’s GDP declined from 728 to 674 during this decade. France’s GDP in
1929 was 4,710, and in 1939 it was 4,793. Also, some were not quite back to their original GDP, but they were close. Malaysia went from 1,682 to 1,609.
4. Name: Date:
STUDENT MATERIALS
UNDERSTANDING THE GLOBAL DEPRESSION
BIG HISTORY PROJECT / LESSON 9.6 ACTIVITY
GDP Per Capita 1929-1939
7000
6750
6500
6250
6000
5750
5500
5250
5000
4750
4500
4250
4000
3750
3500
3250
3000
2750
2500
2250
2000
1750
1500
1250
1000
750
500
250
0
GDPPerCapita
Years
1929 1930 1931 1932 1933 1934 1935 1936 1937 1938 1939
France
5. Name: Date:
STUDENT MATERIALS
UNDERSTANDING THE GLOBAL DEPRESSION
BIG HISTORY PROJECT / LESSON 9.6 ACTIVITY
Questions:
1. When did most countries hit bottom?
2. Did any countries hit bottom at a different time?
3. Which two countries experienced the steepest decline in living standards?
4. One country actually experienced an increase in GDP during this time. Which one was it and give a hypothesis about why this might have happened.
5. Does it seem that most countries had recovered by the late 1930’s? Are there any that didn’t? Give some examples and provide the relevant data.