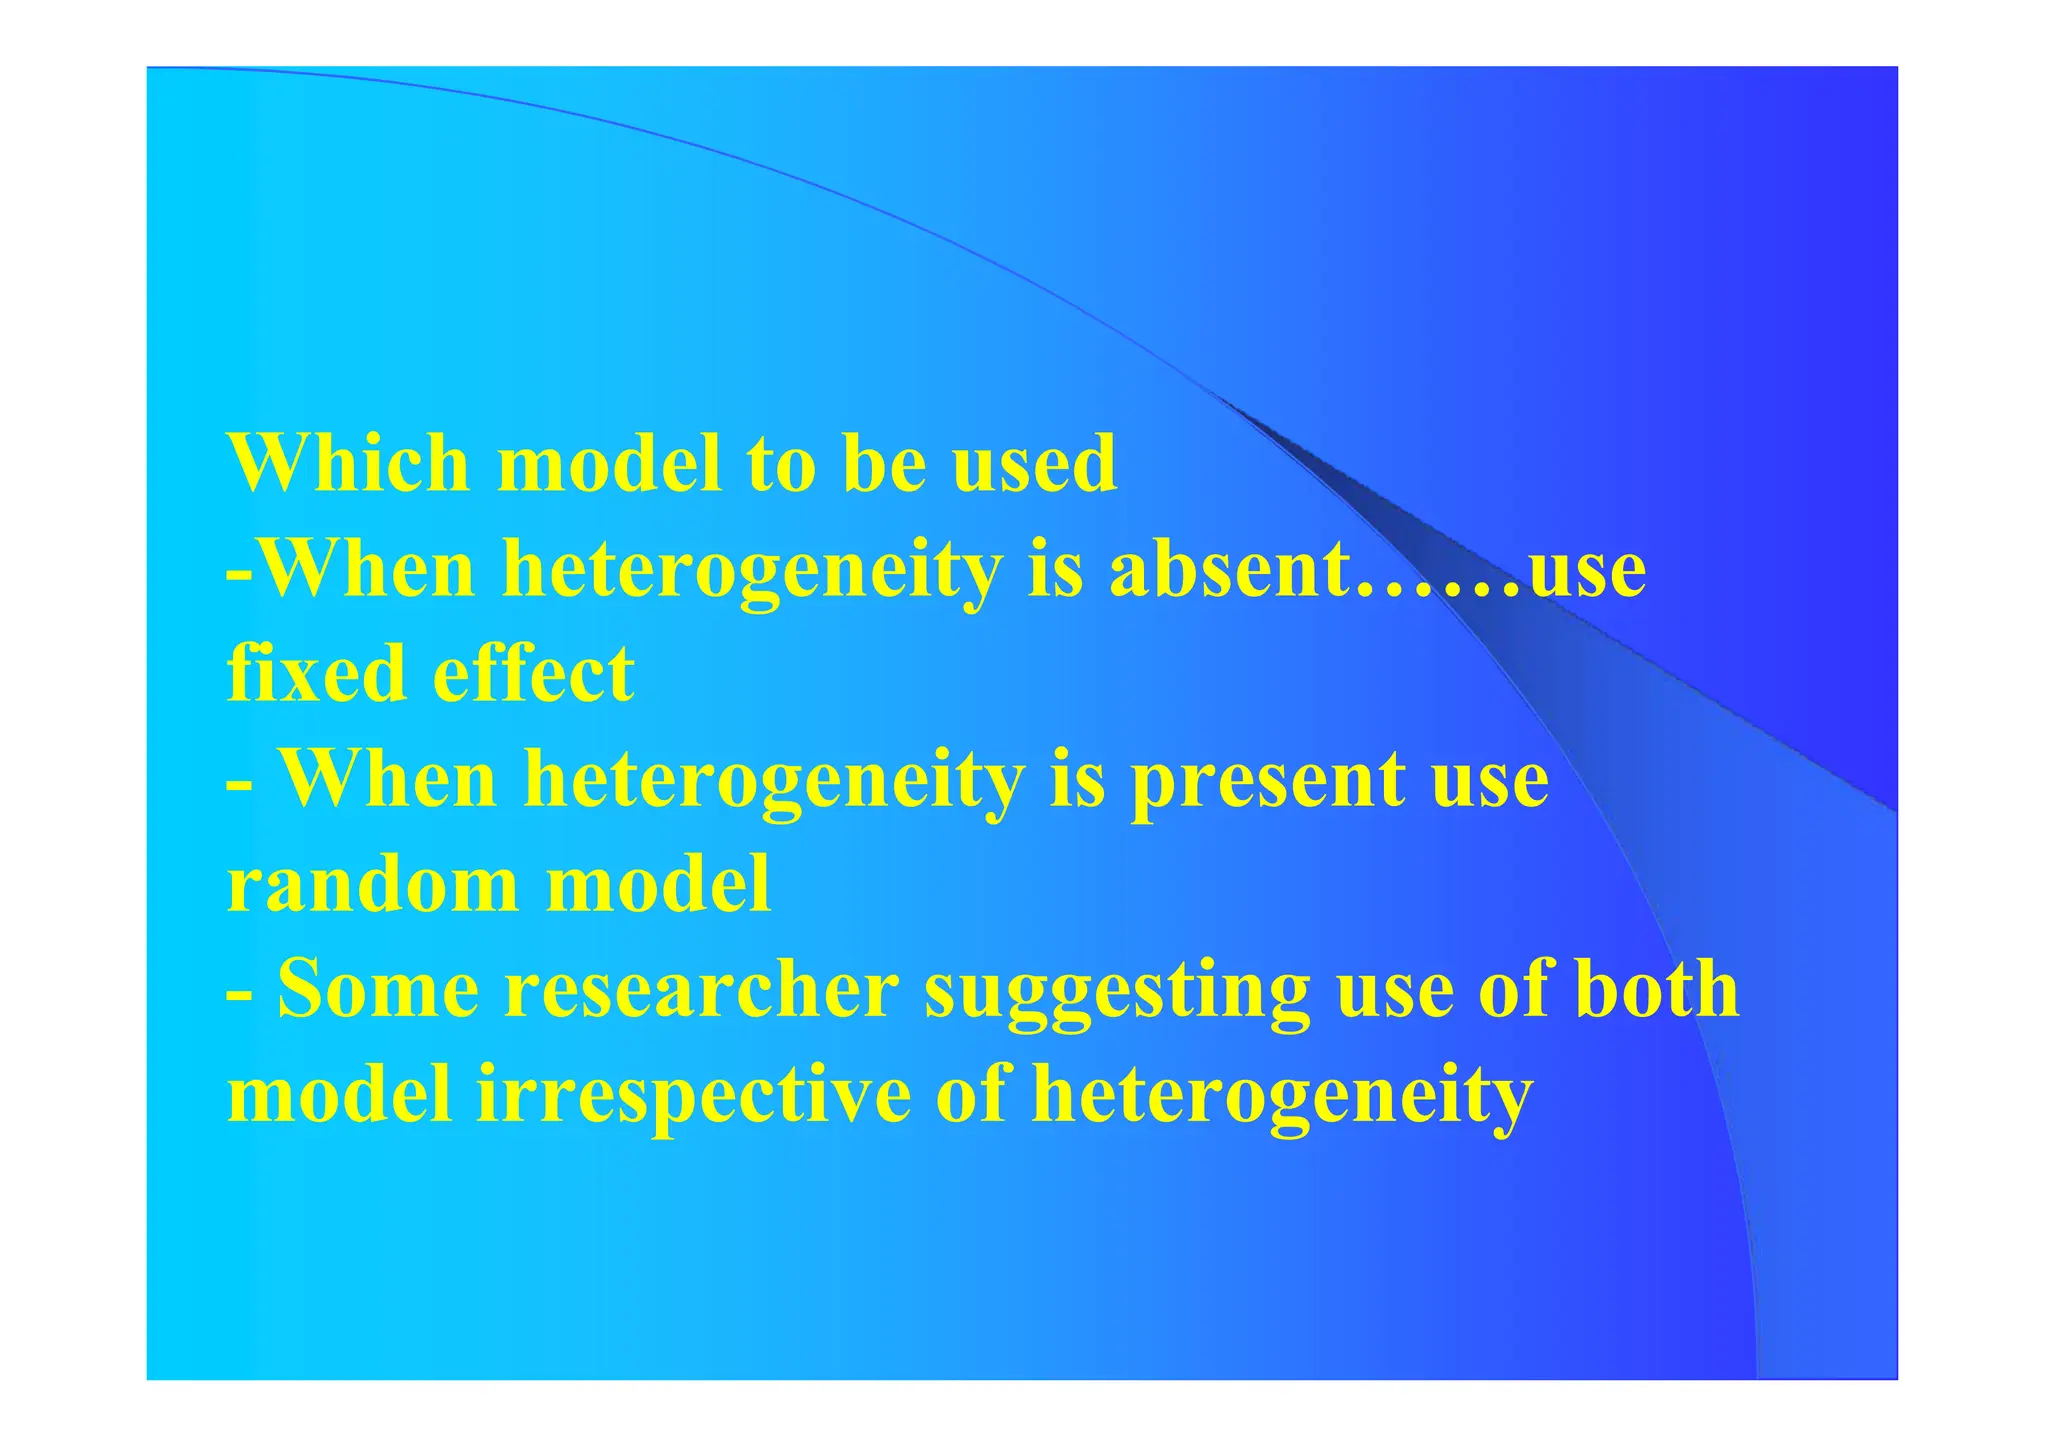
The document discusses the methodology and advantages of meta-analysis and systematic reviews, emphasizing the importance of evidence strength and types. It details various phases of conducting meta-analyses, including data collection, pooling results using different models, and addressing limitations such as potential biases. Key references and statistical techniques used in these analyses are also highlighted.
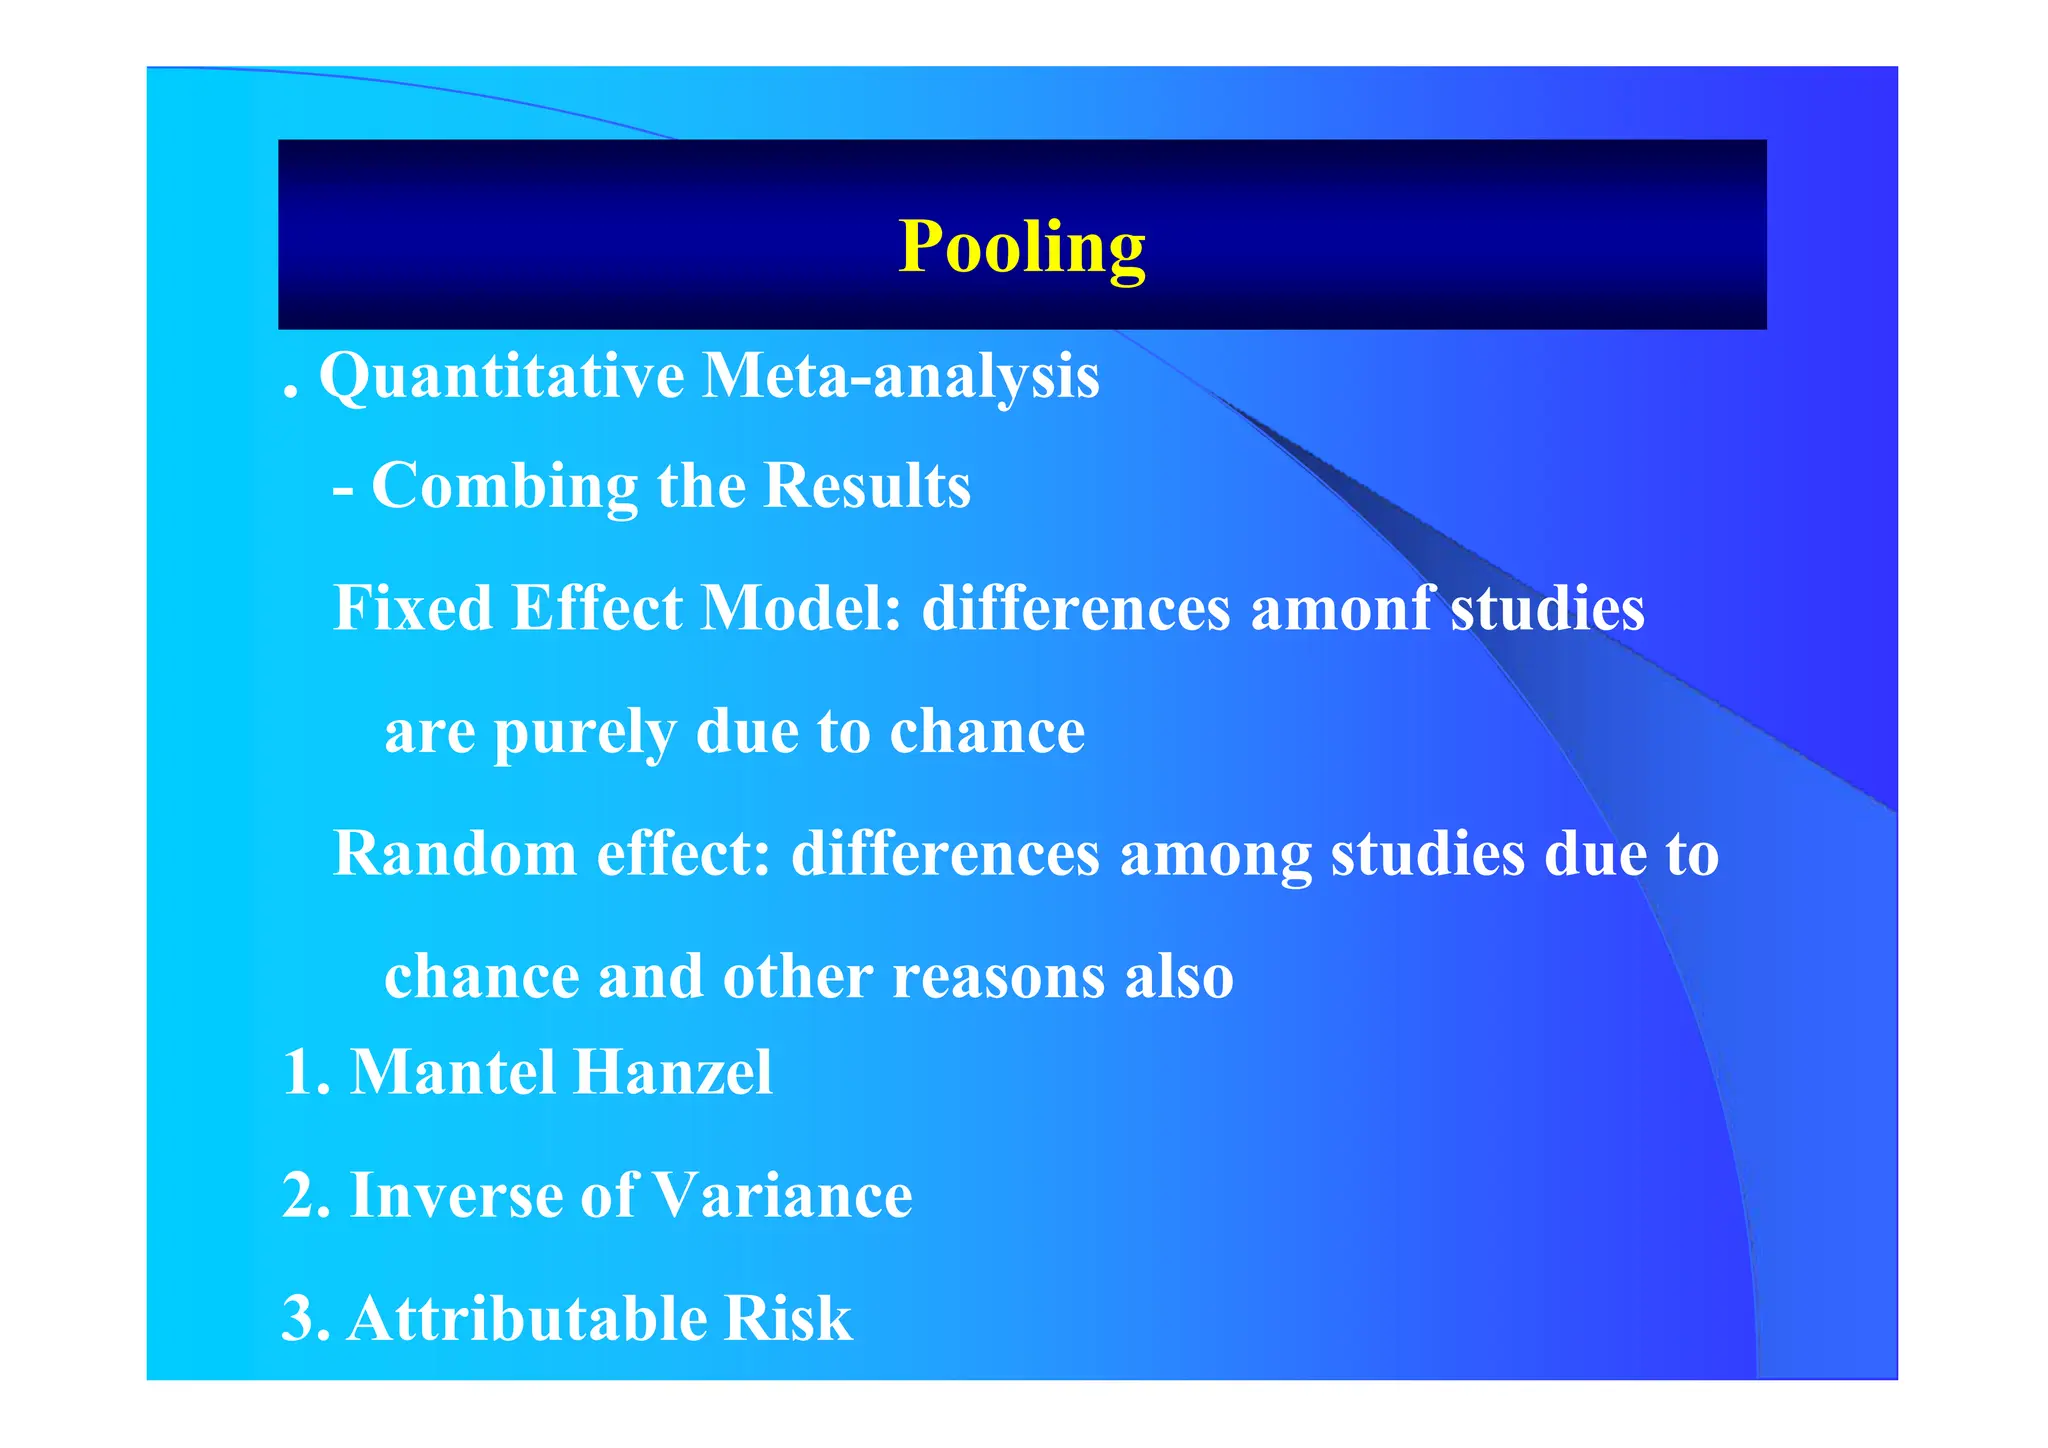
![. Quantitative Meta-analysis
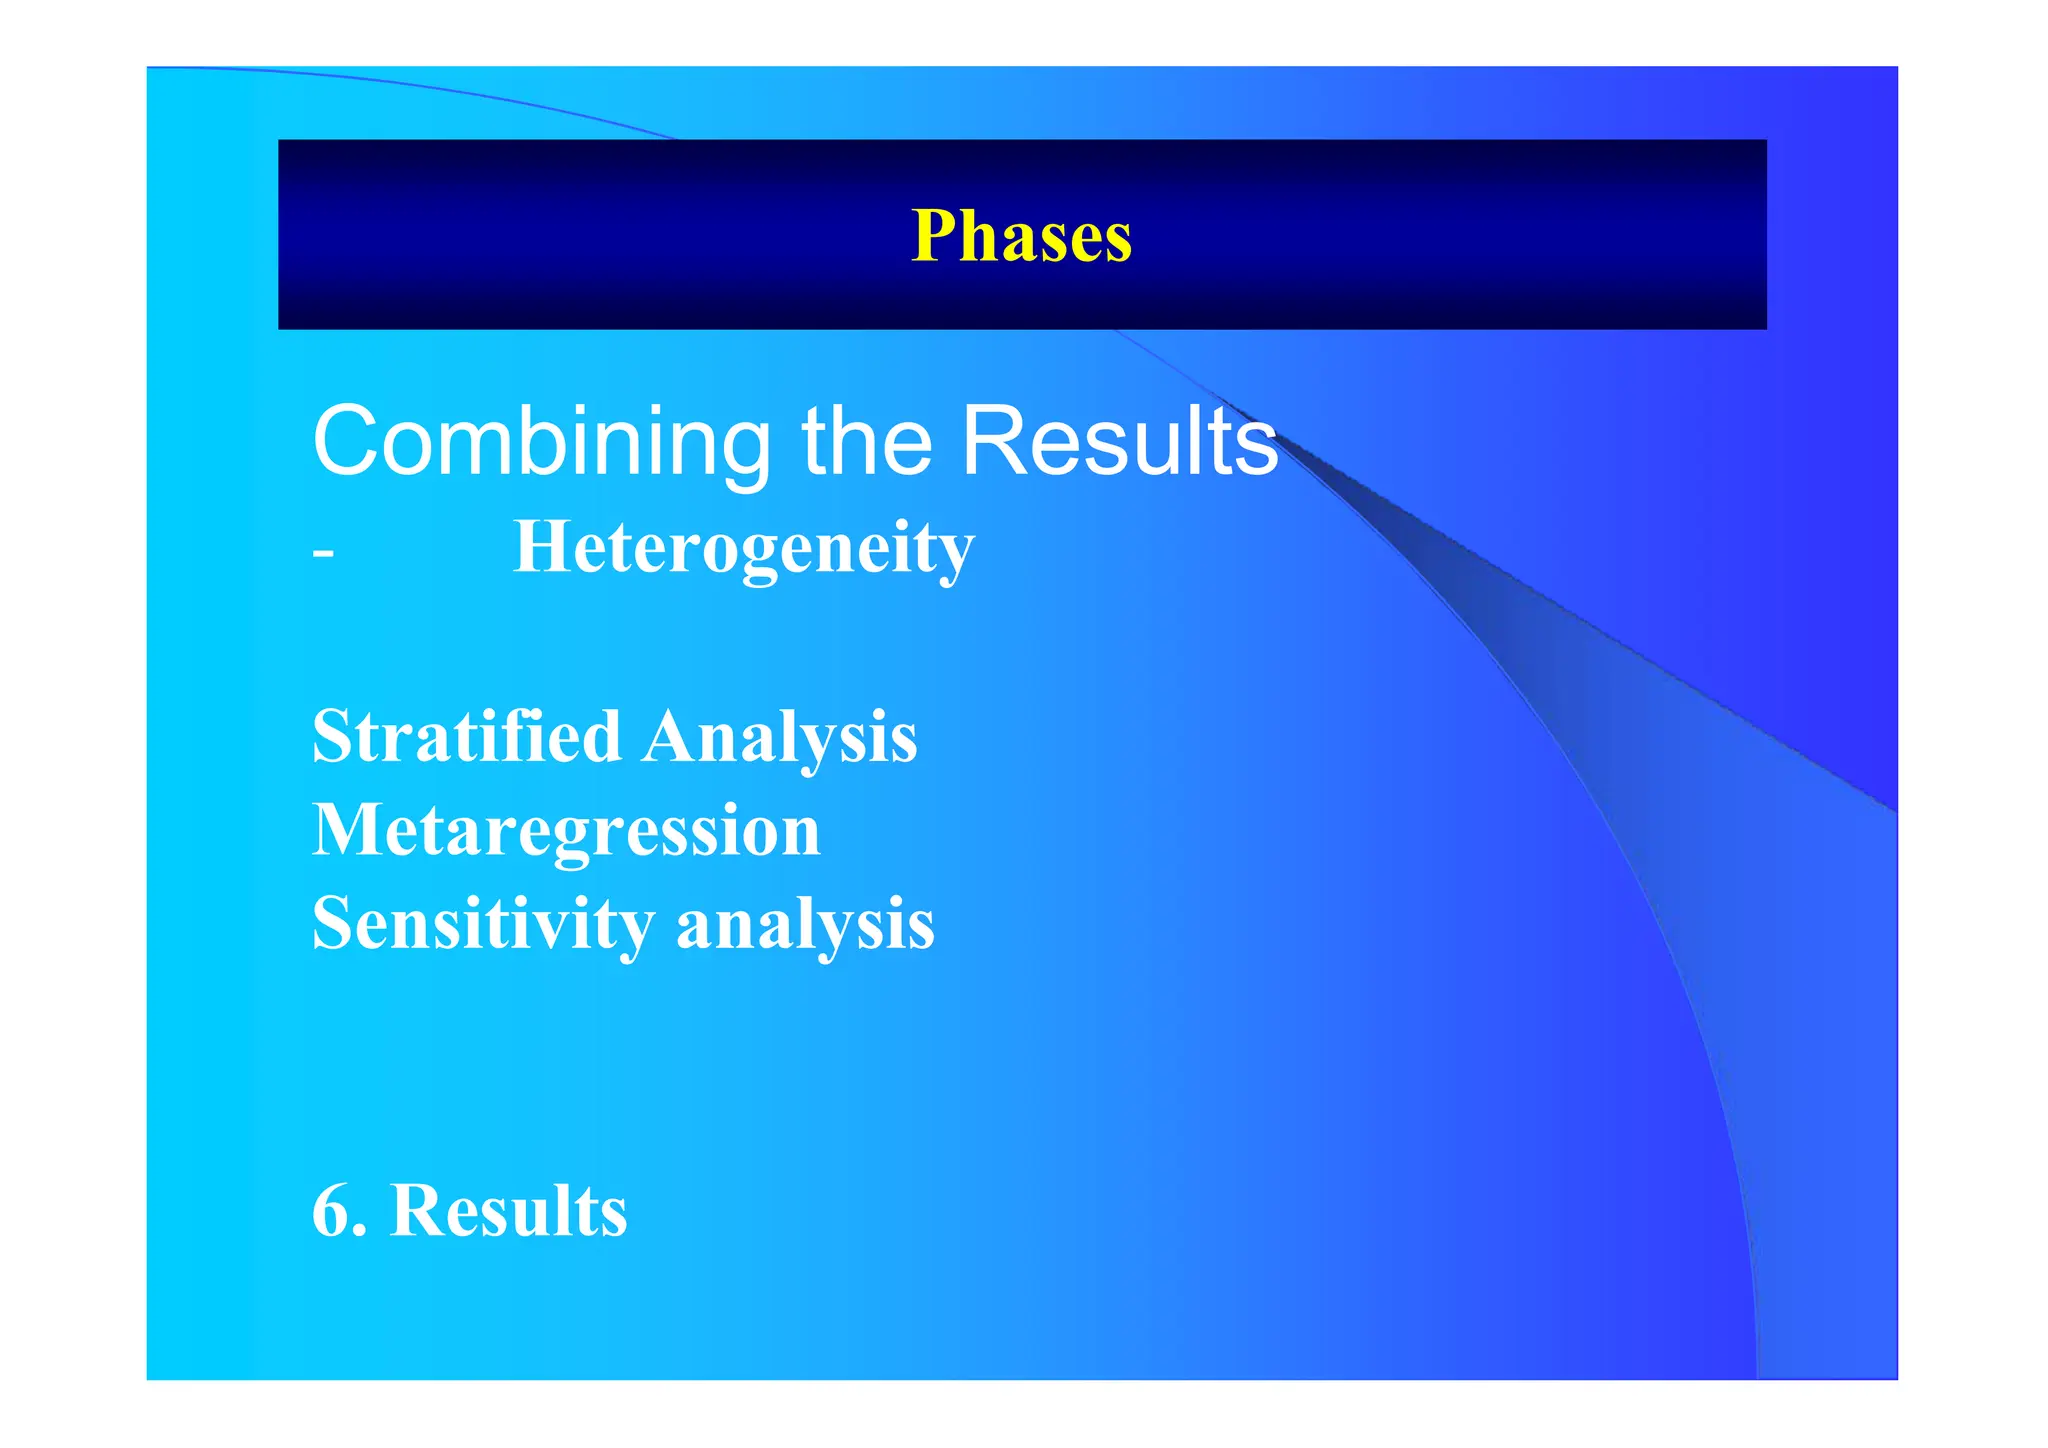
- Combing the Results
= [ pi i ] / pi
pi Weight of every Study
i Parameter selected for investigation
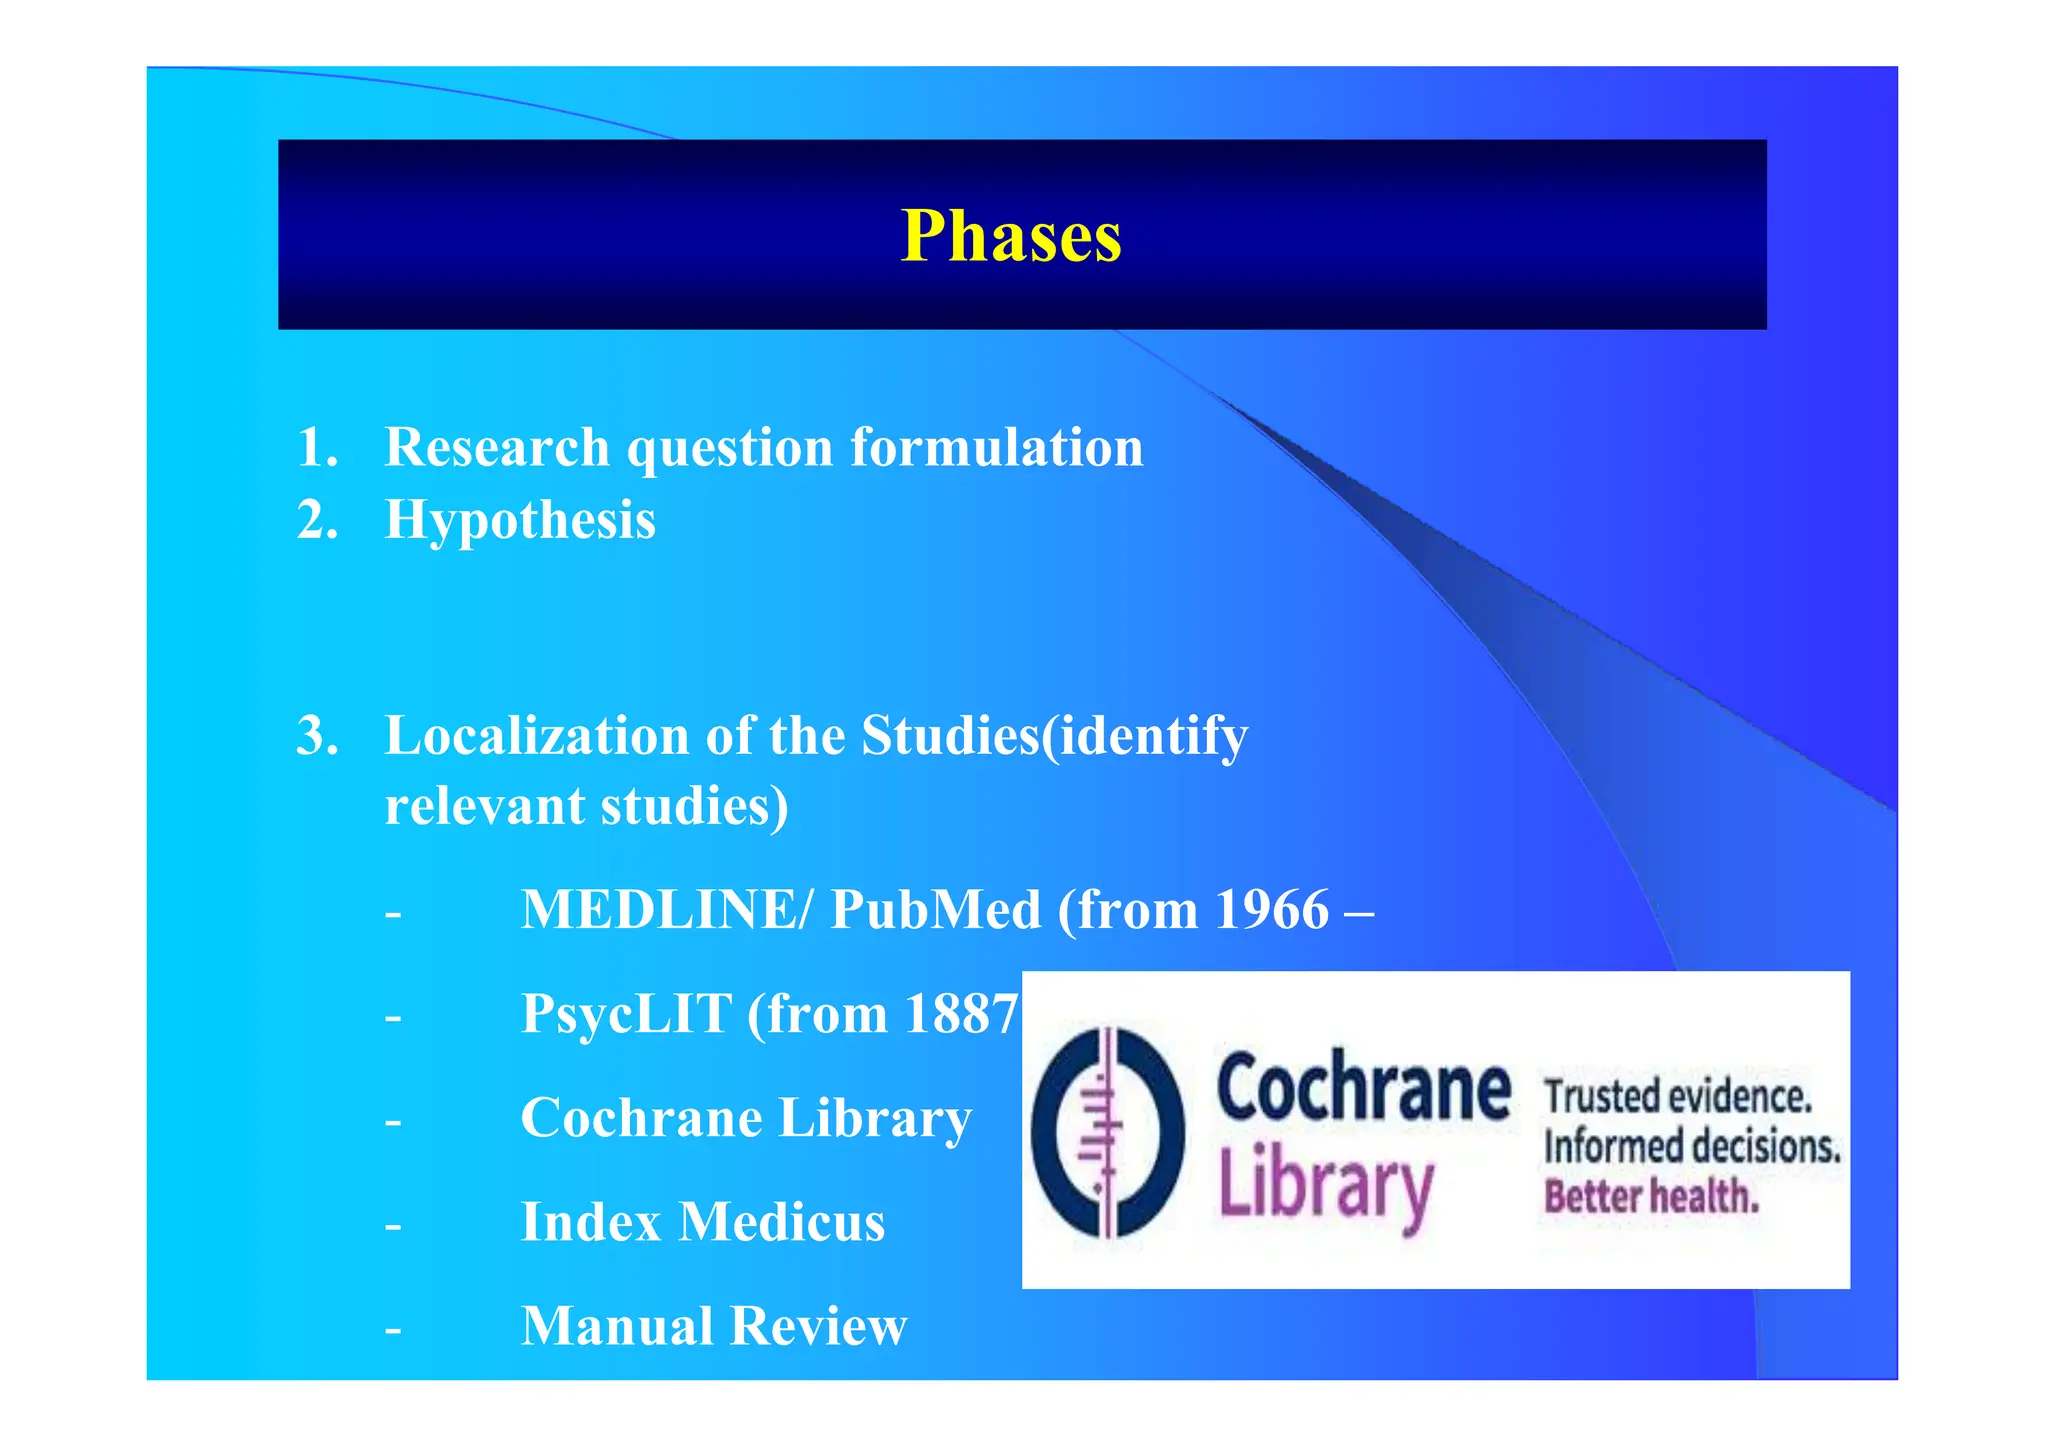
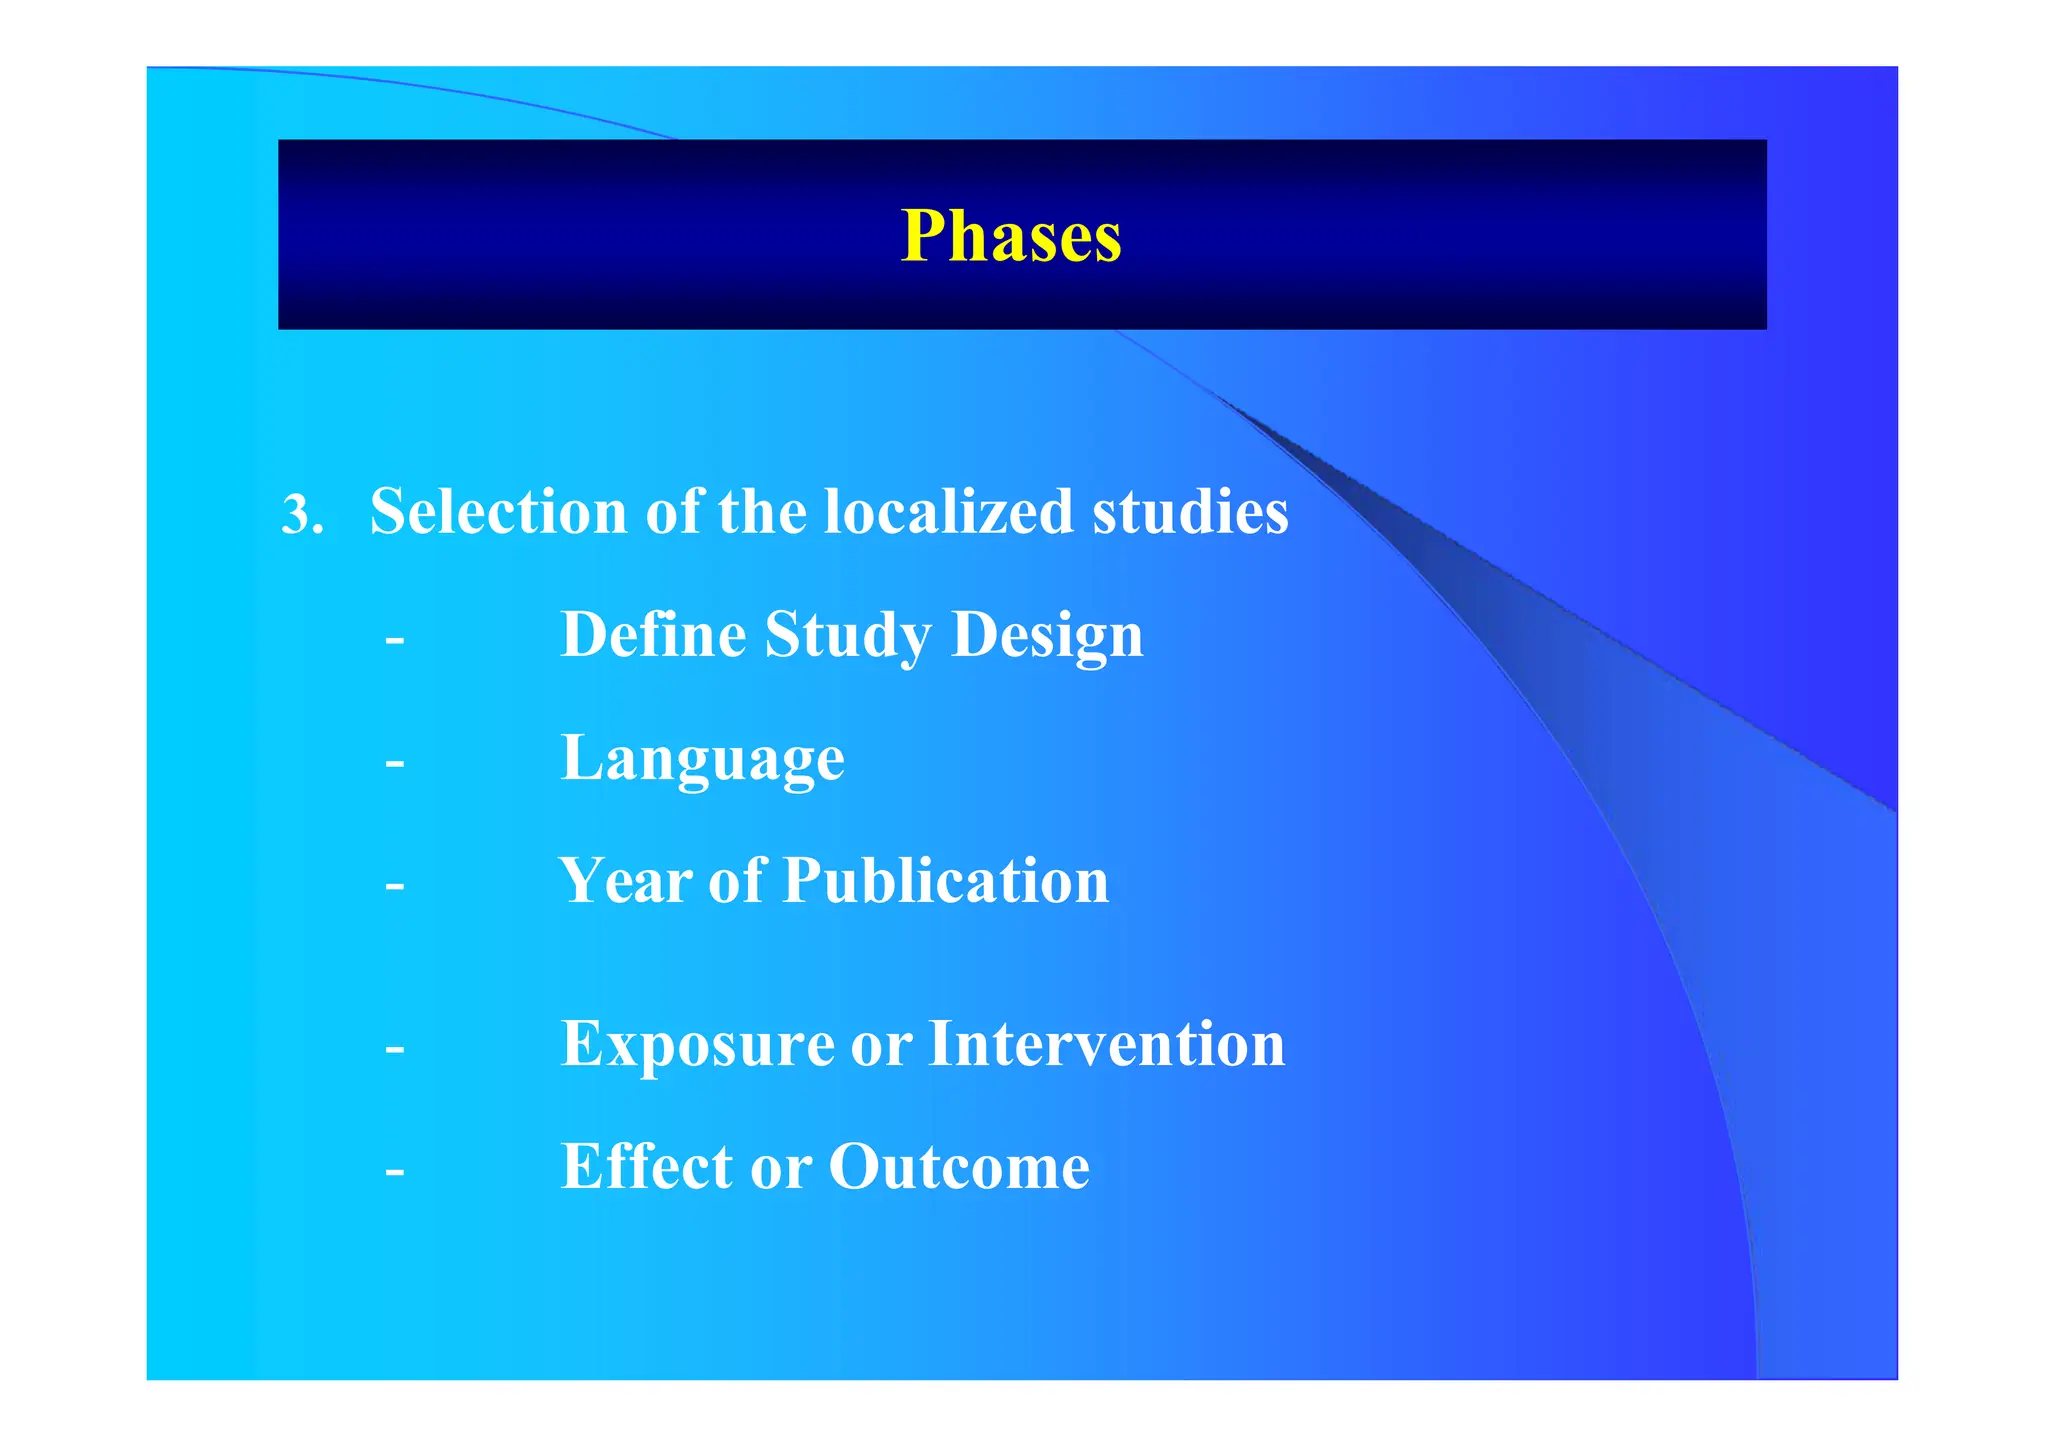
Phases](https://image.slidesharecdn.com/9-240525090115-225b4bcc/75/9-Meta-analysis-Systematic-Review-summary-view-pptx-12-2048.jpg)
![1. Mantel Hanzel
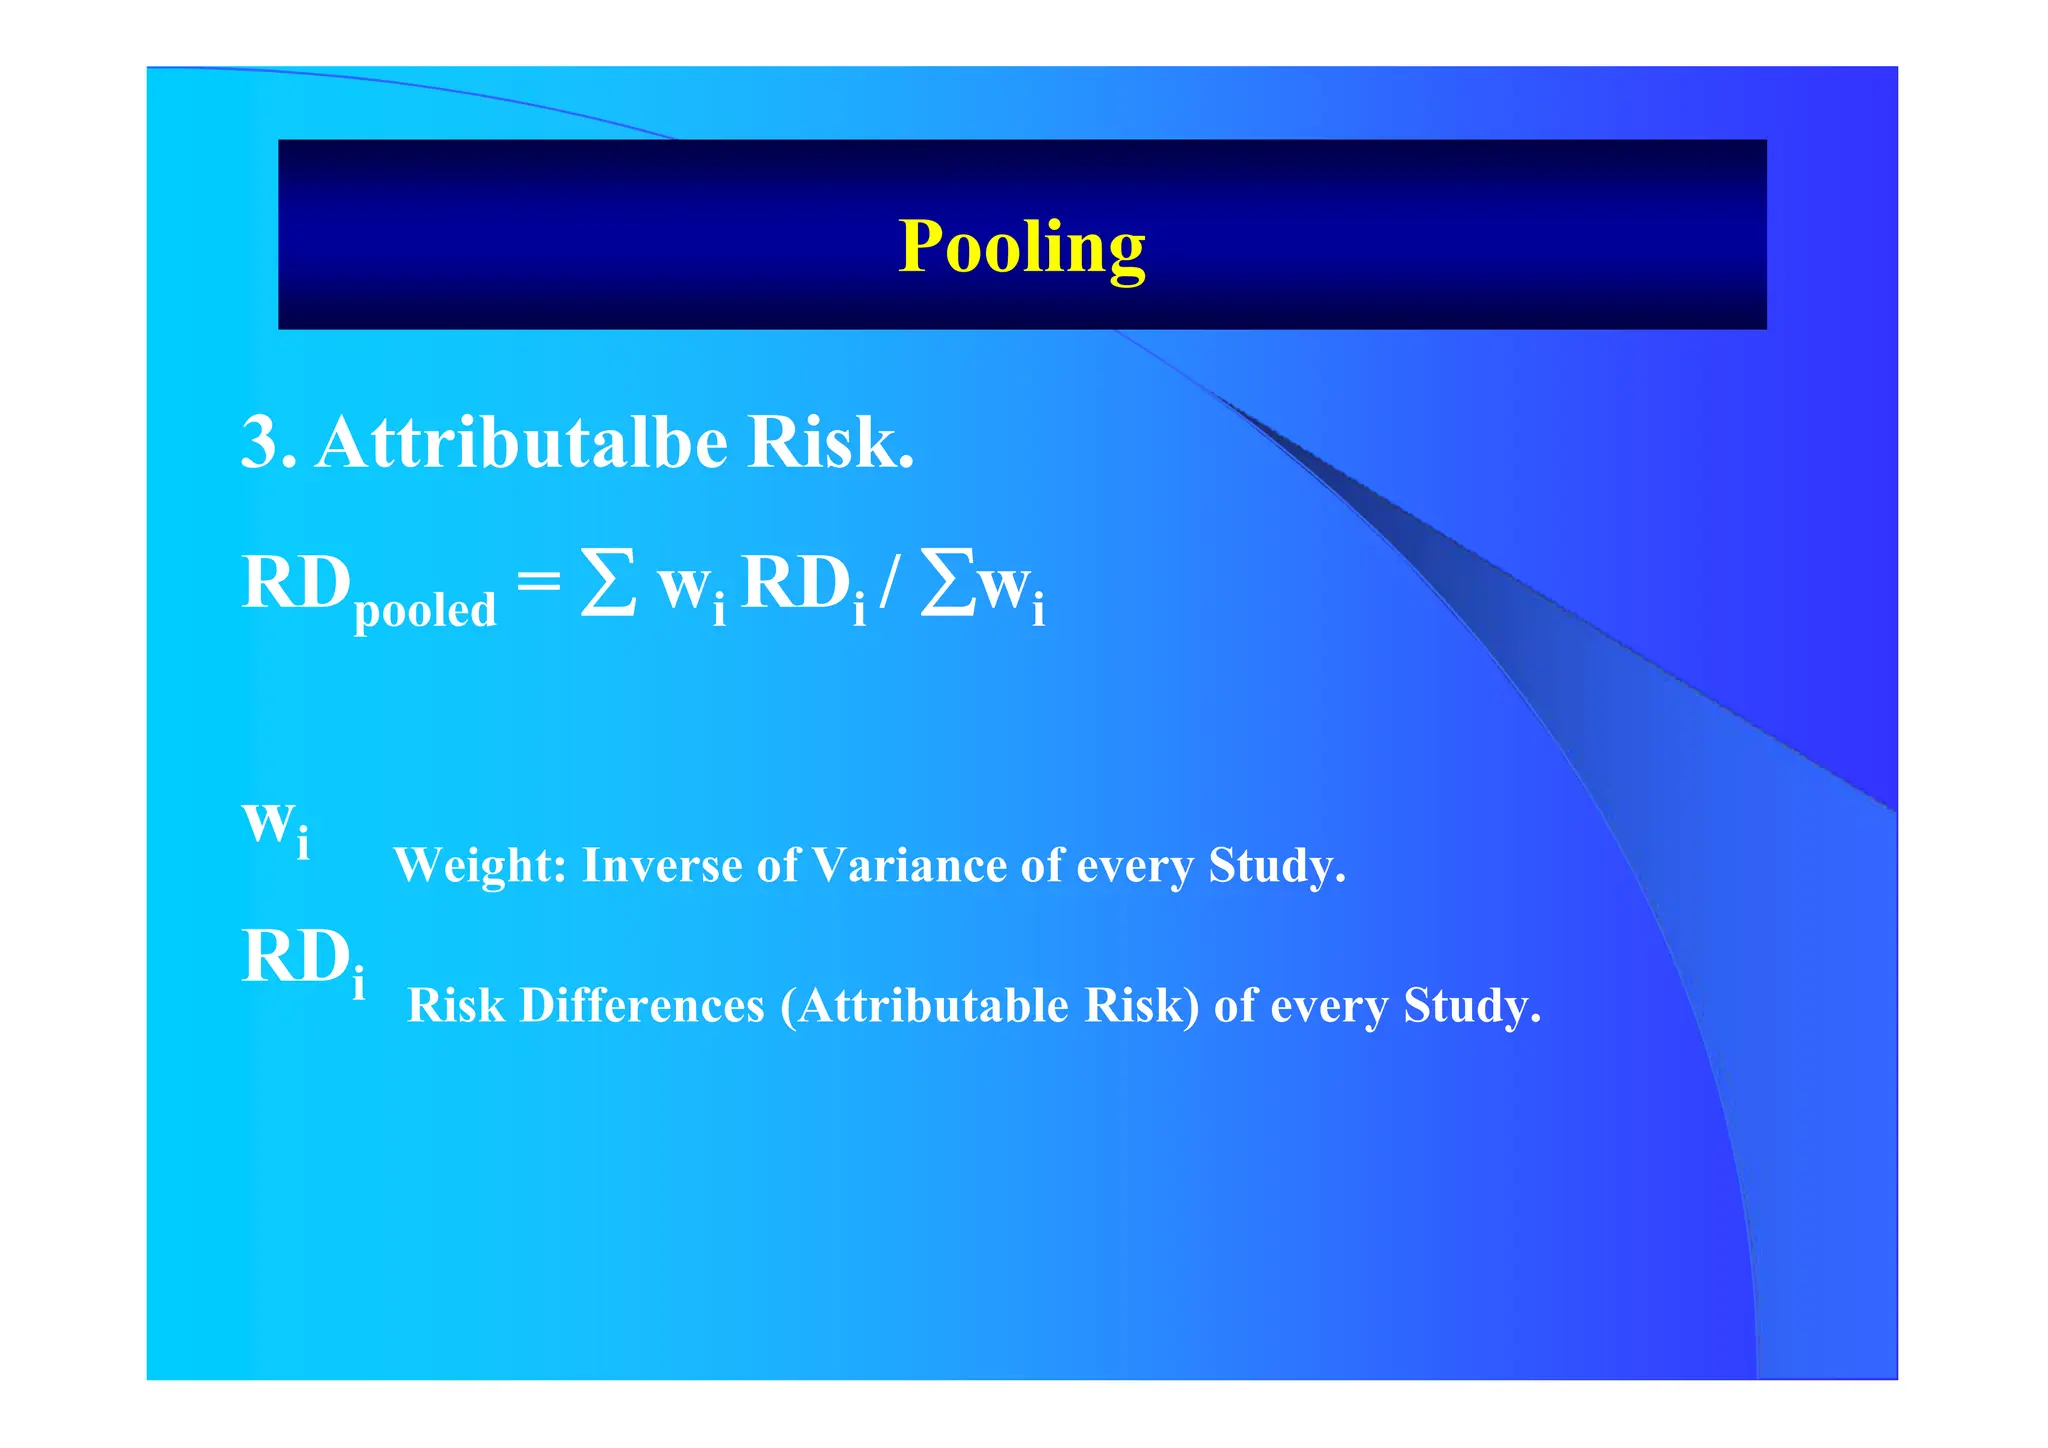
Pooling
E x p o s e d D i s e a s e
P r e s e n t
D i s e a s e
A b s e n t
T o t a l
P r e s e n t A B A + B
A b s e n t C D C + D
T o t a l A + C B + D N
RRMH = [ (ci bi / ni ) (ai di / bi ci ) ] / (ci bi / ni )
Var RR = RRi [ 1/a + 1/b + 1/c + 1/d ]
RRMH 95% CI = RRMH x EXP [ + 1,96 Var RR (In RRMH)]](https://image.slidesharecdn.com/9-240525090115-225b4bcc/75/9-Meta-analysis-Systematic-Review-summary-view-pptx-16-2048.jpg)
![Pooling
2. Inverse of Variance
RRW = Exp [ wi In RRi ] / wi
RRW Global Relative Risk.
wi Weight of every Study: Inverse of Variance of RR.
RRi Relative Risk of every Study
RR refers to RR, SMR, OR or POR
RRW 95% CI = In RRW * Exp [ + 1,96 Var (In RRw)]](https://image.slidesharecdn.com/9-240525090115-225b4bcc/75/9-Meta-analysis-Systematic-Review-summary-view-pptx-17-2048.jpg)
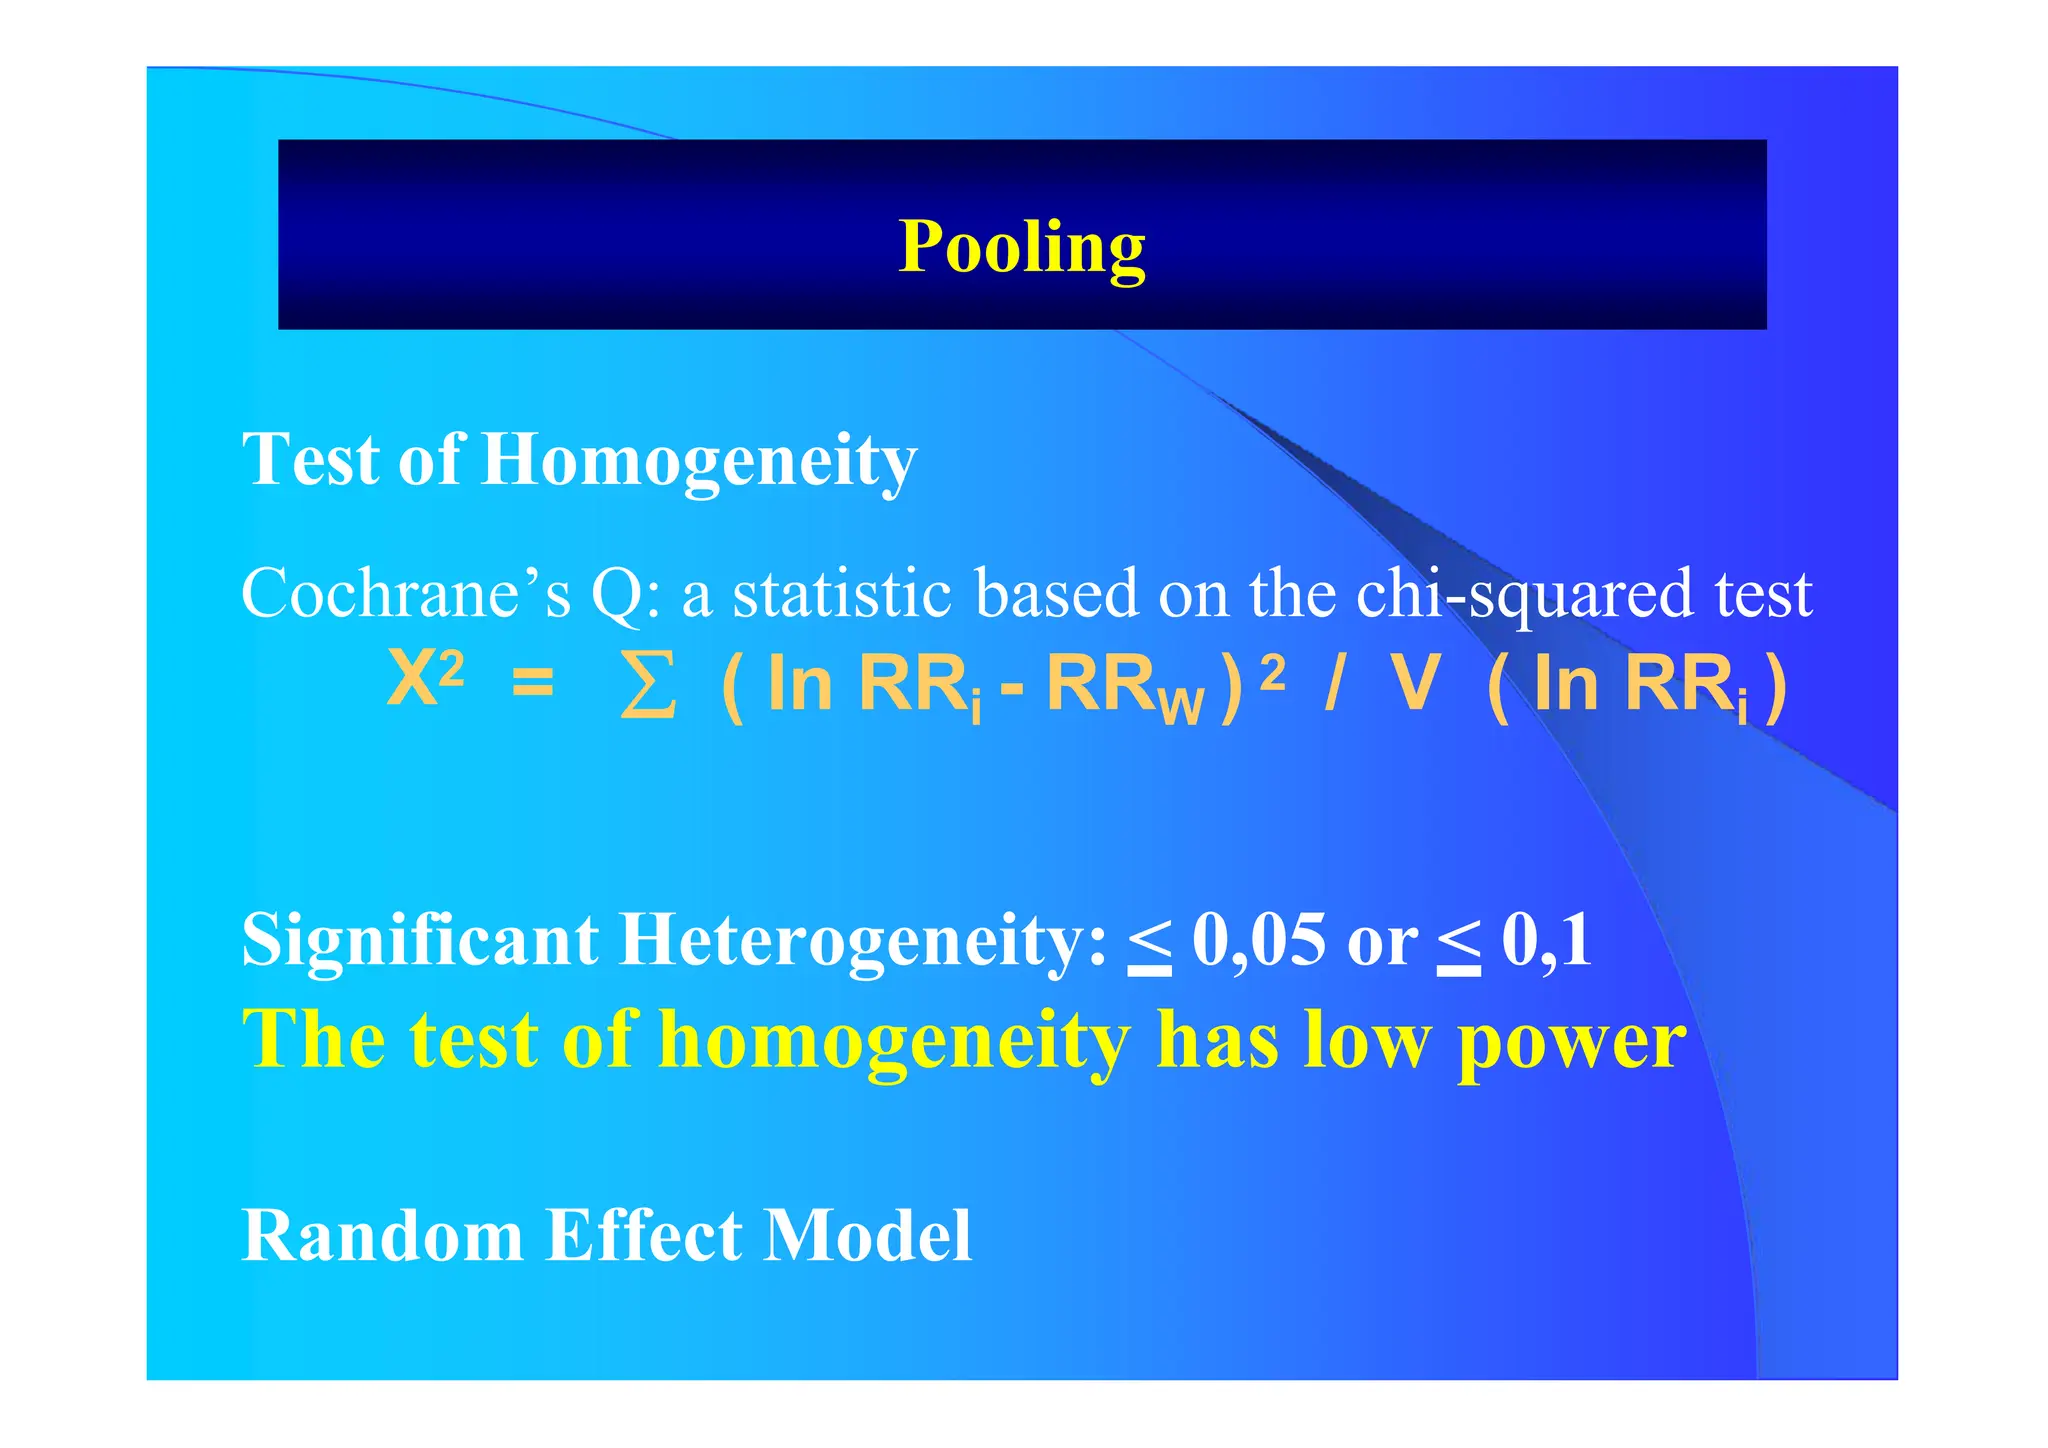
![Random Effect Model
RRA = Exp [ w*i In RRi ] / w*i
W*I will be calculated as follow:
W *i = 1/ [ V (In ORi) + VAR]
VAR = [Chi Square – (N-1)] / U
U = (N – 1) [WM - { var (w) / N* WM}]
Results of both Fixed Effect Model and
Random Effect Model
Pooling](https://image.slidesharecdn.com/9-240525090115-225b4bcc/75/9-Meta-analysis-Systematic-Review-summary-view-pptx-23-2048.jpg)
![How Many Studies Could Change The Results
ToAccept The Null Hypothesis?
Tolerance Index
N = [ K {K(RRW) 2 – 2,706} ] / 2,706
N Number of Studies not considerded and
with Null Results
K Number of Studies Included in the Review
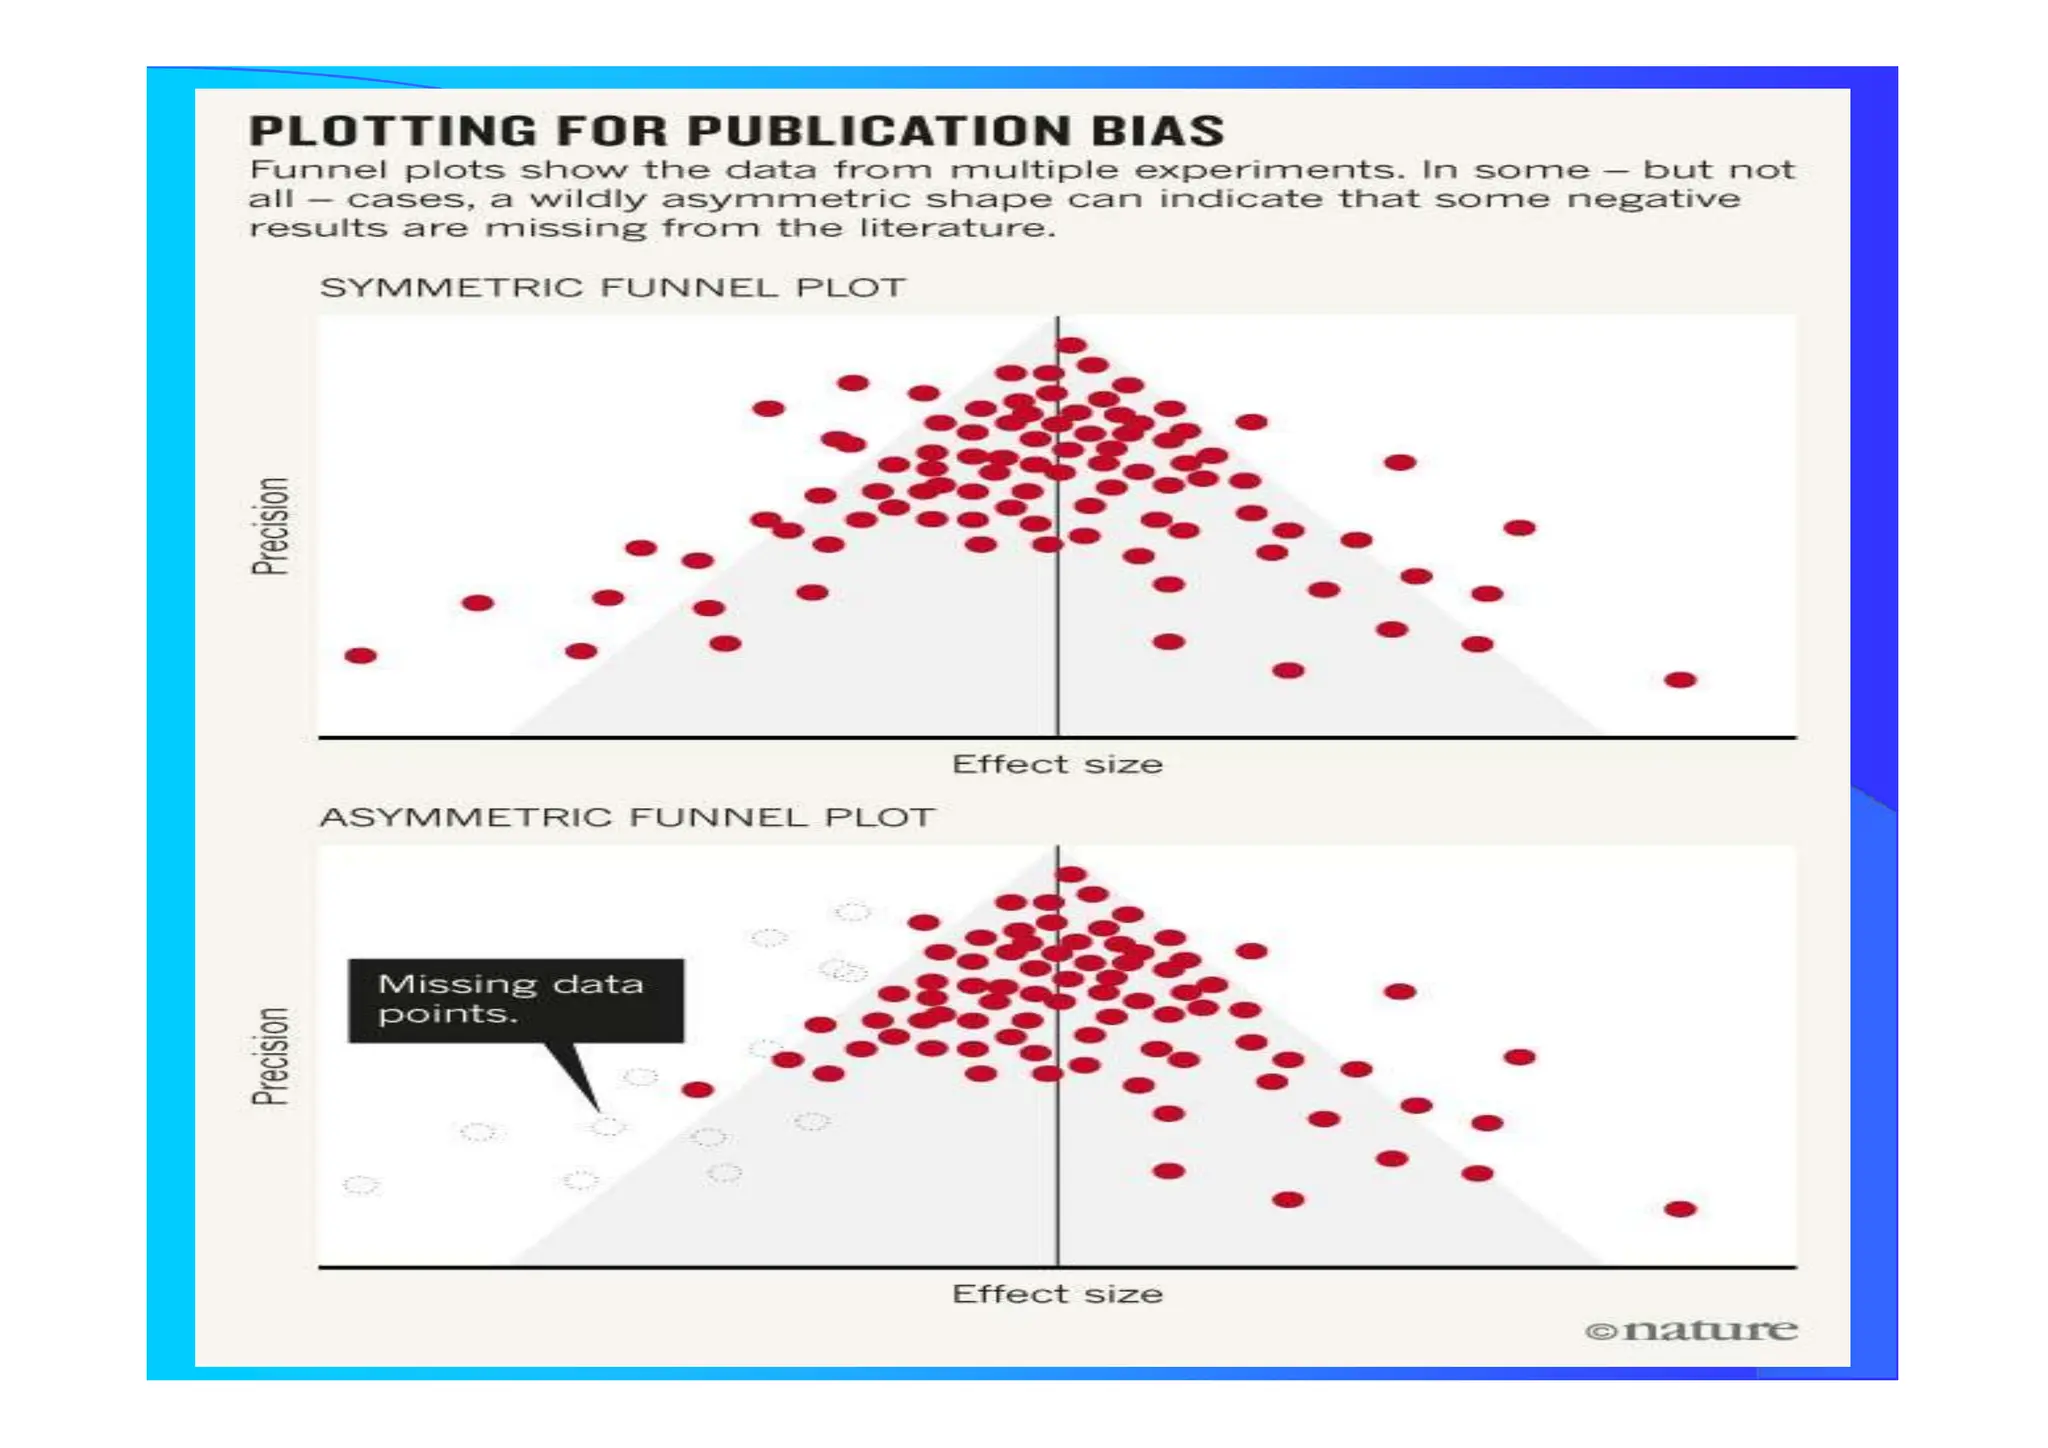
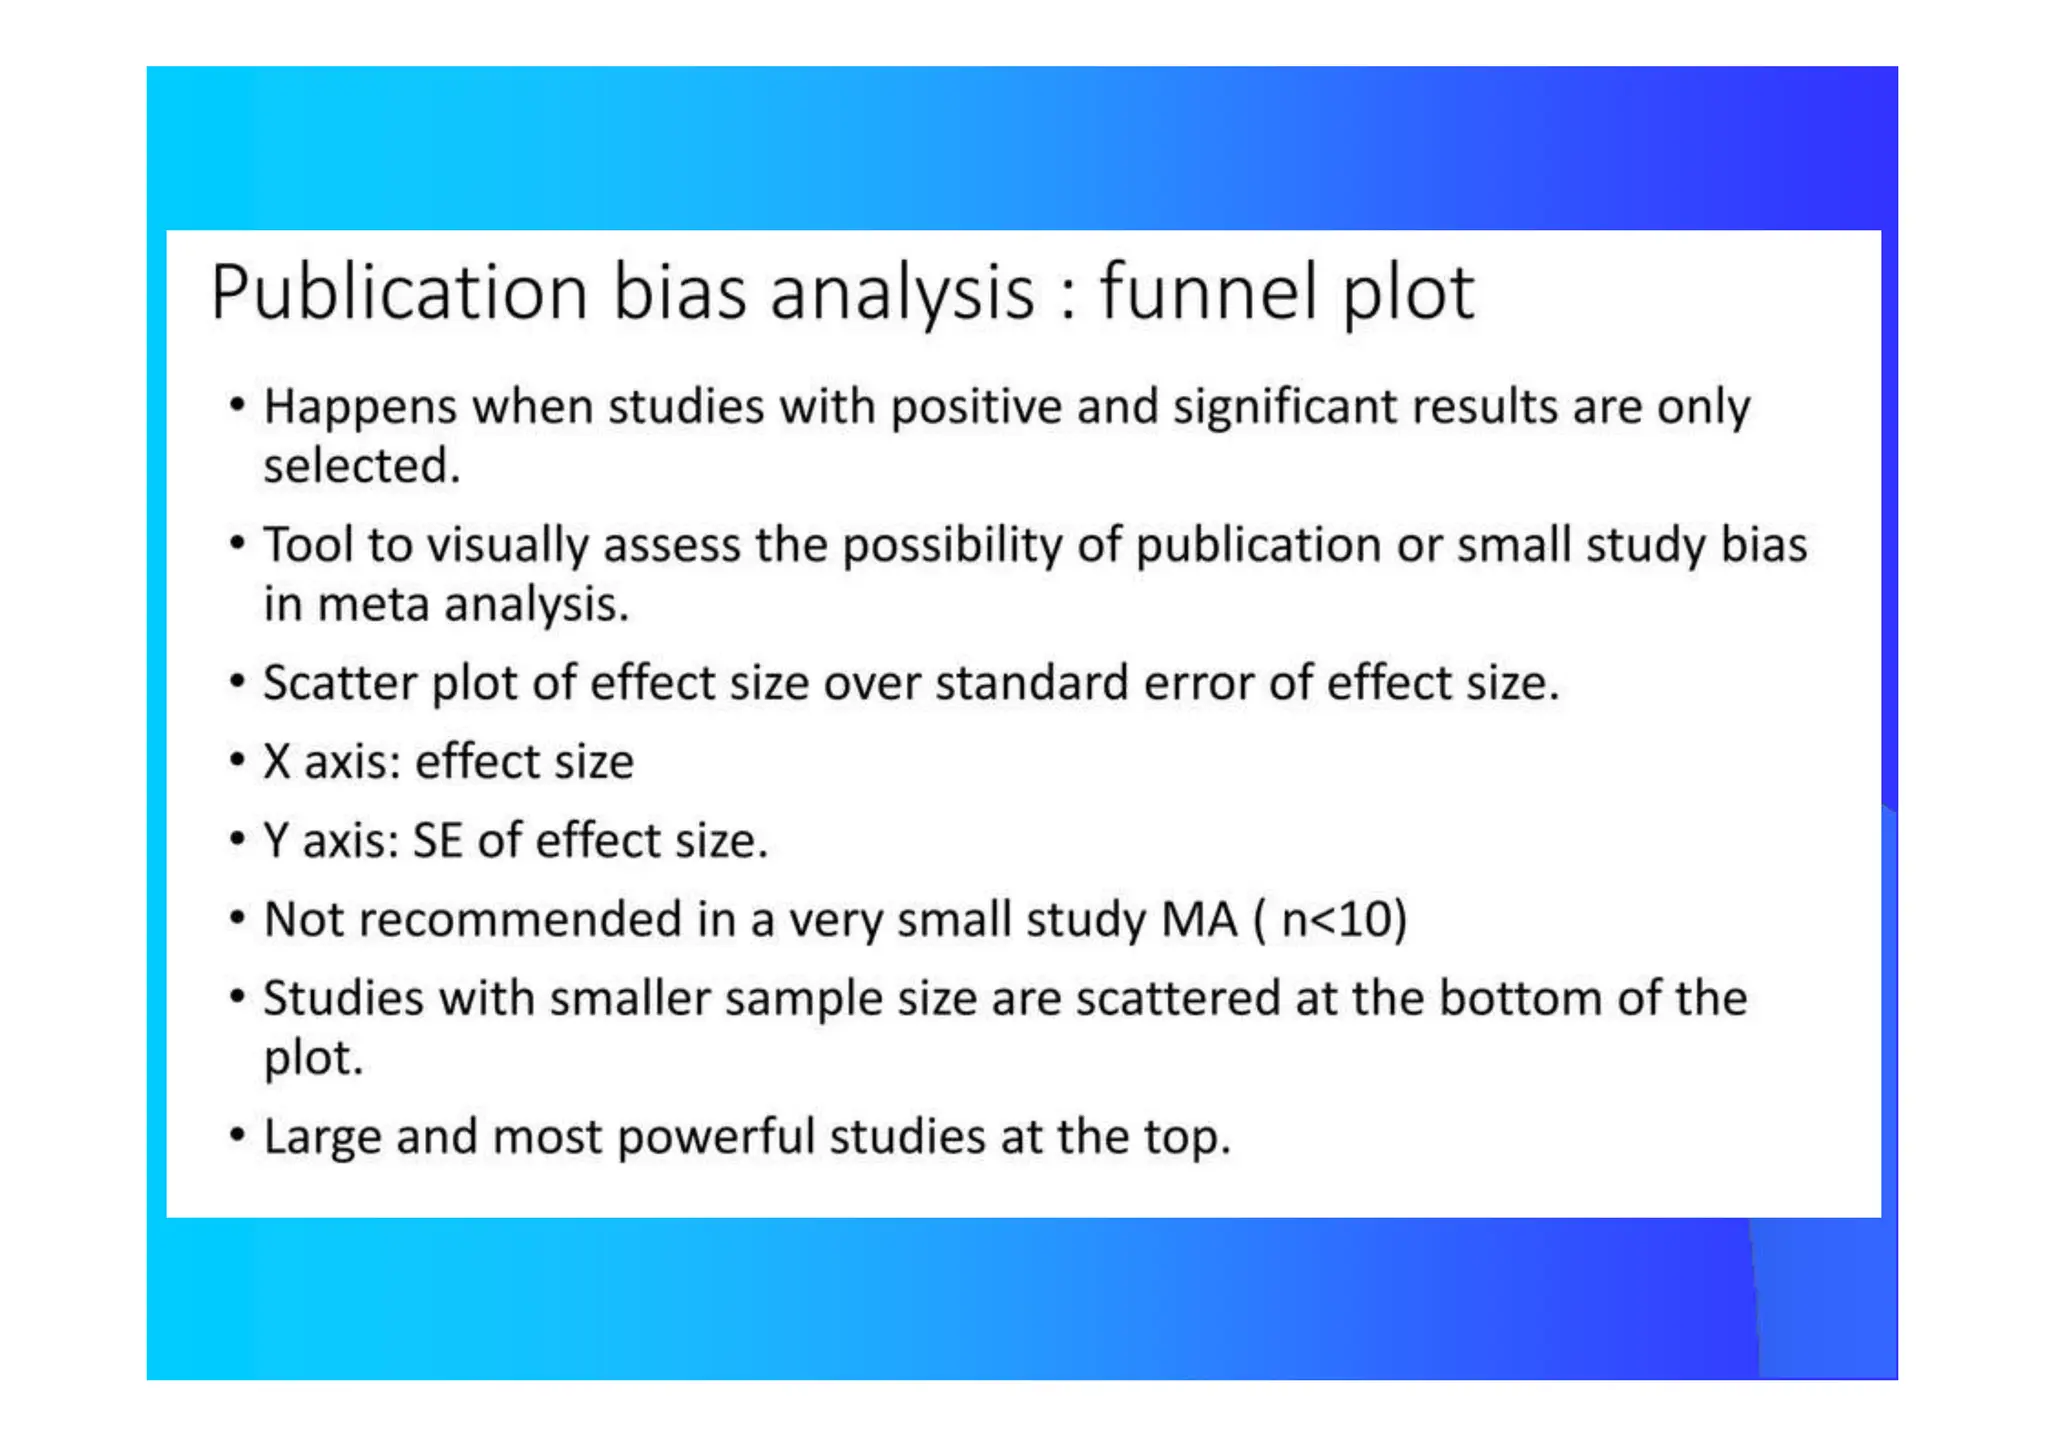
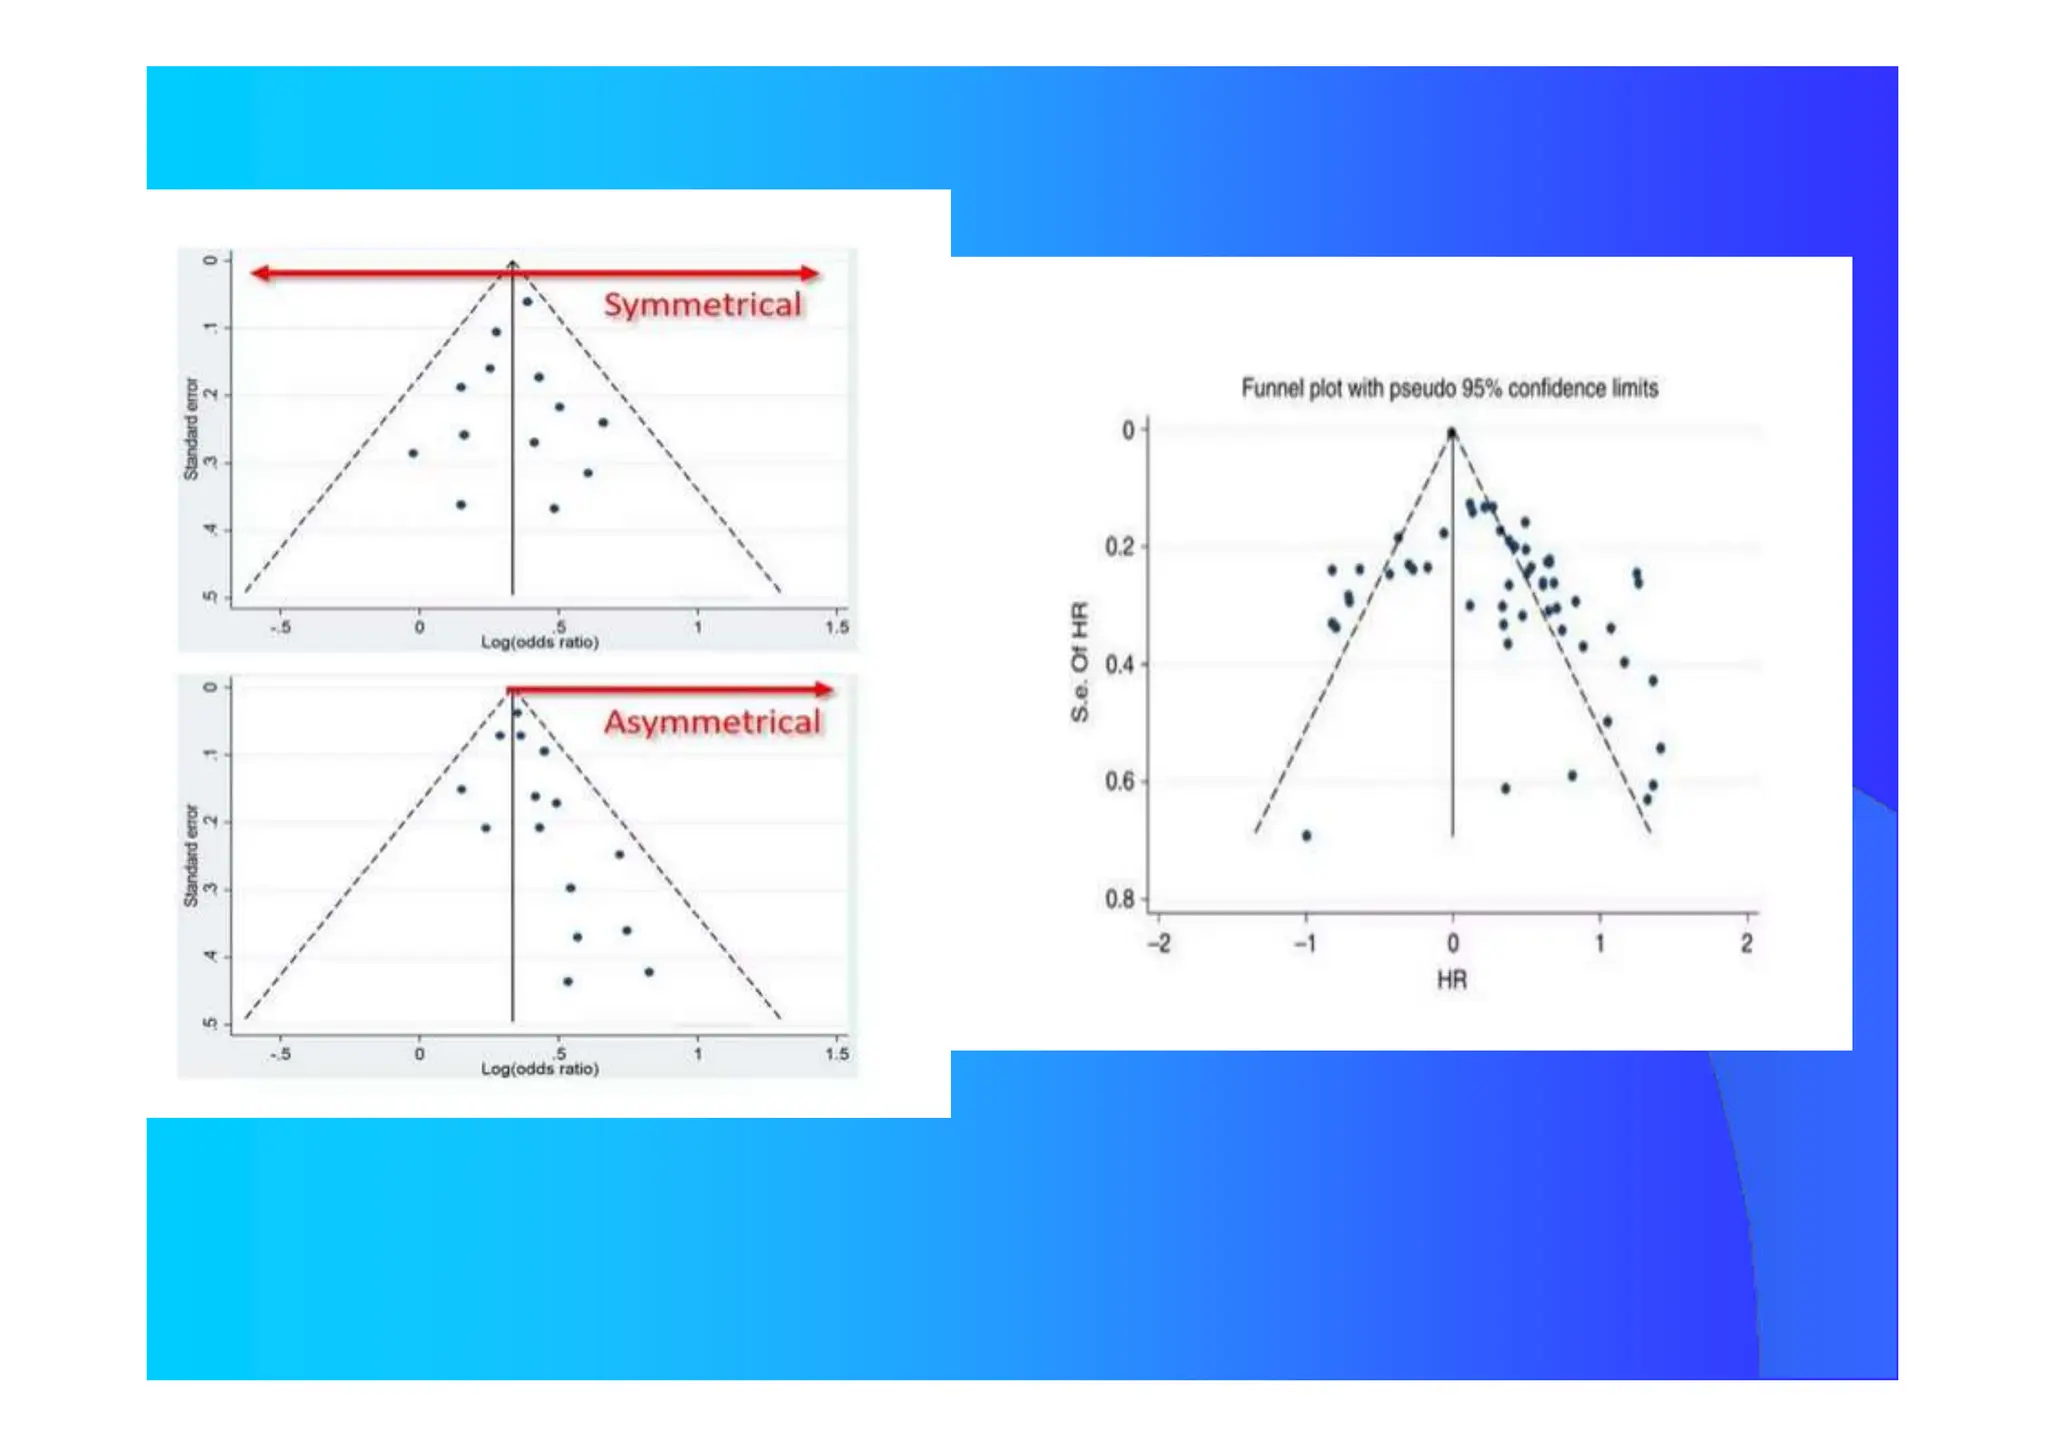
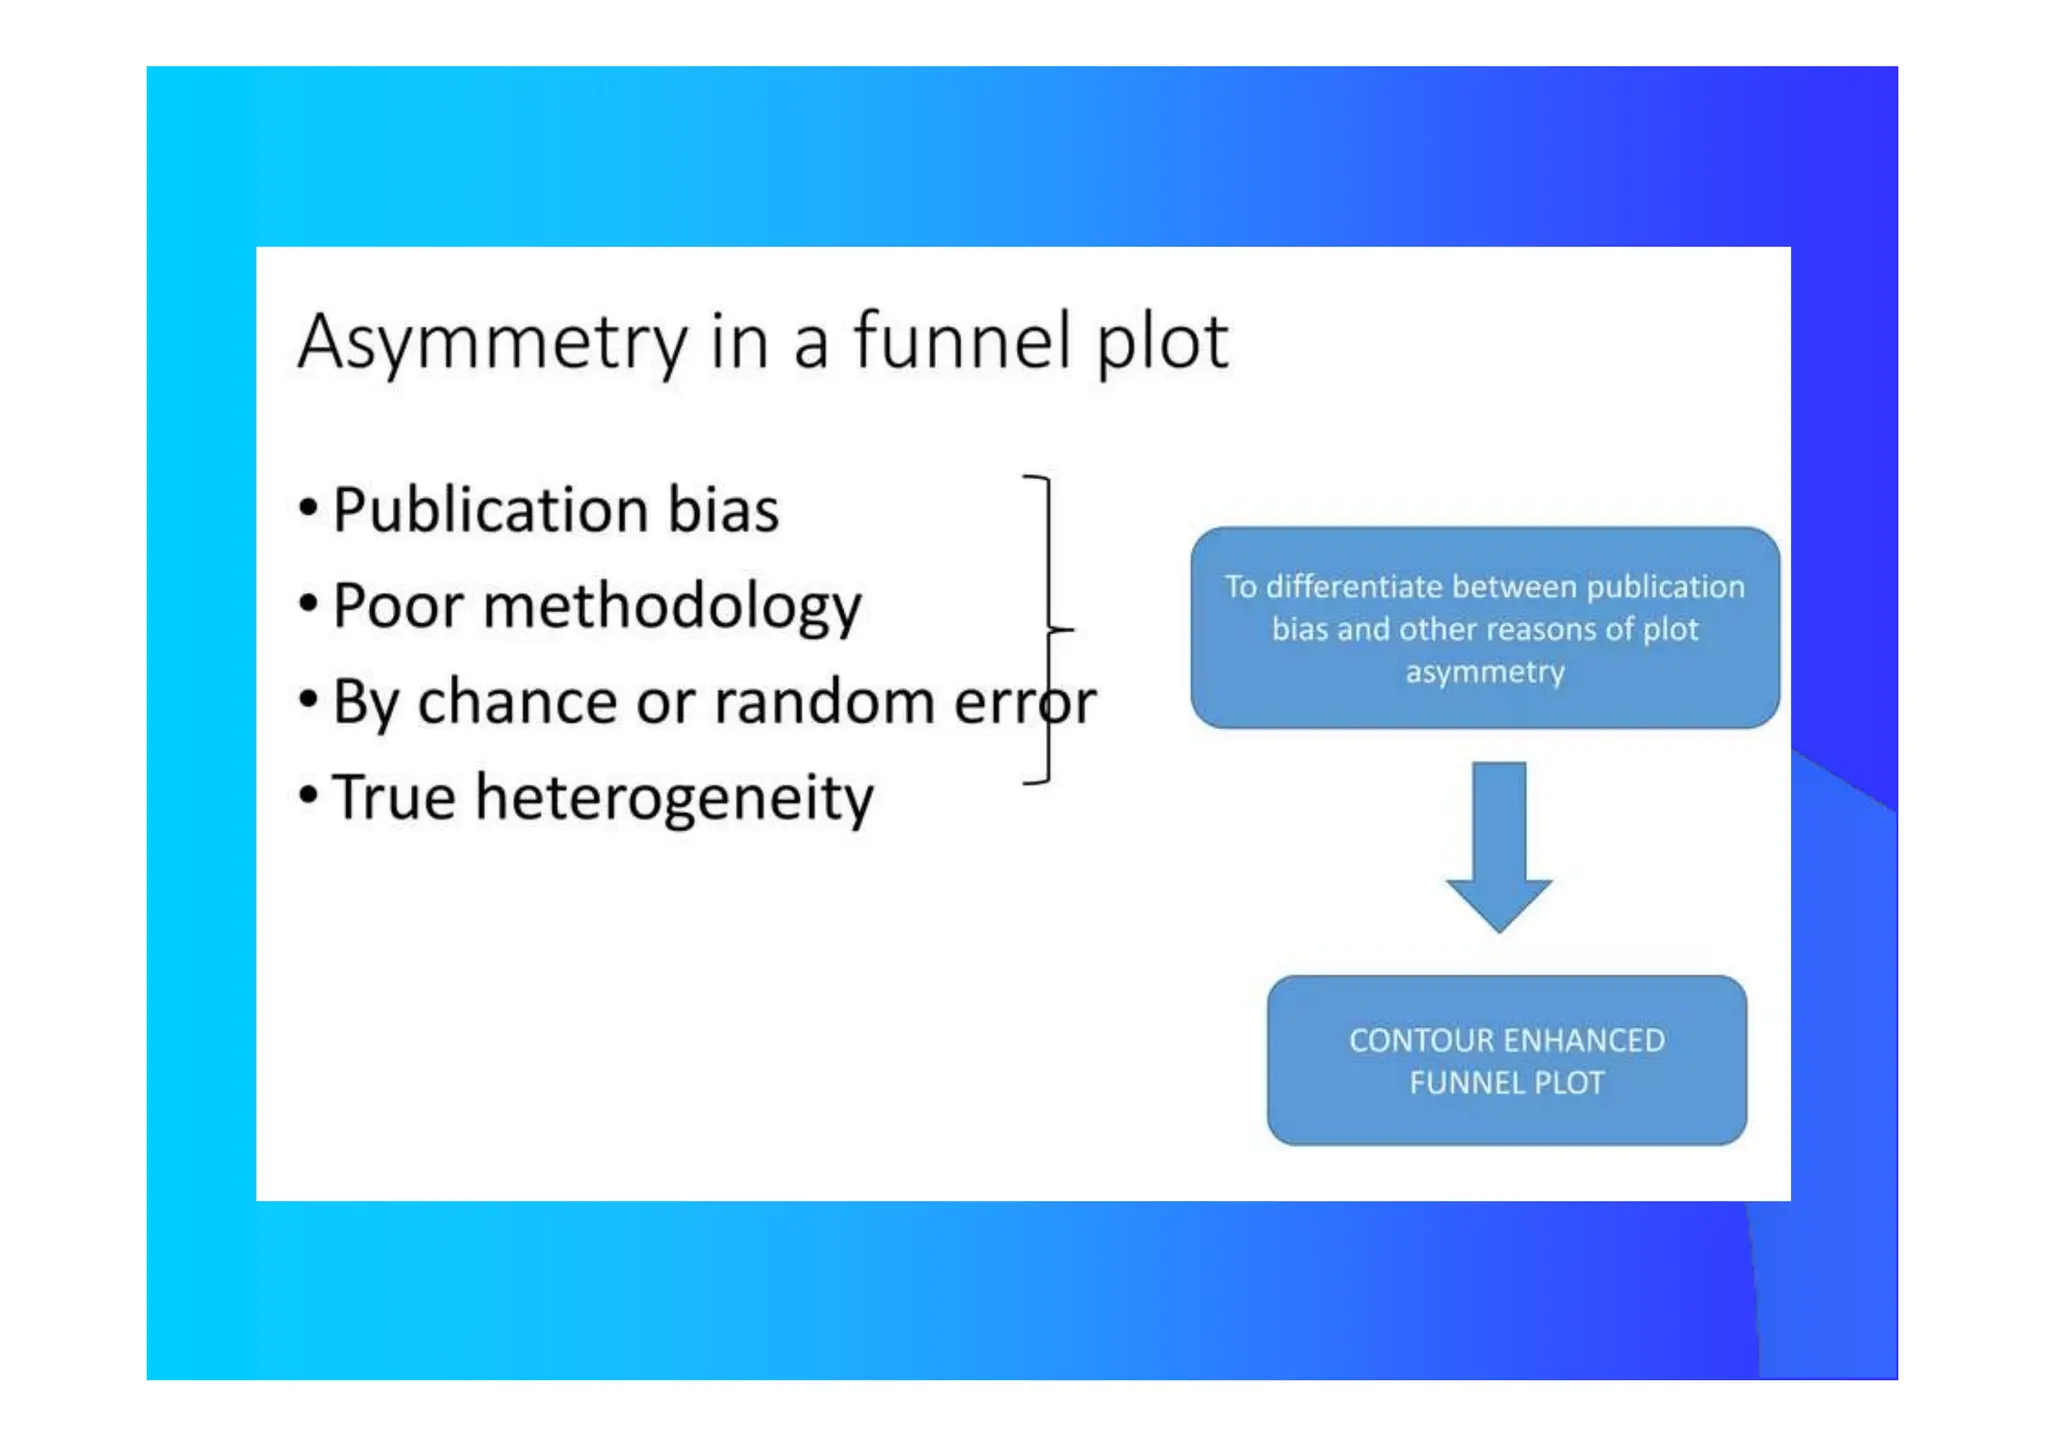
Publication Bias](https://image.slidesharecdn.com/9-240525090115-225b4bcc/75/9-Meta-analysis-Systematic-Review-summary-view-pptx-29-2048.jpg)


![RSS 2013 - A re-analysis of the Cochrane Library data]](https://cdn.slidesharecdn.com/ss_thumbnails/rssnewcastle3sep13-140606083345-phpapp02-thumbnail.jpg?width=640&height=640&fit=bounds)


![[DSC Europe 25] Jon Dajci - Bridging TradFi and DeFi: Building the Future of ...](https://cdn.slidesharecdn.com/ss_thumbnails/fqmhfvlbqhkihjvqvhmu-7-251211083849-6af7e325-thumbnail.jpg?width=640&height=640&fit=bounds)


![[DSC Europe 25] Katherine Forrest - AI NOW: Understanding the Velocity of Cha...](https://cdn.slidesharecdn.com/ss_thumbnails/wvvbruqfrci0sfq9xwgb-4-251212104007-e5ad1987-thumbnail.jpg?width=640&height=640&fit=bounds)

![[DSC Europe 25] Kaja Kandare - LLM as a judge.pptx](https://cdn.slidesharecdn.com/ss_thumbnails/arxyccaxsdsd1ba99wjw-7-251212104007-2b4e3f64-thumbnail.jpg?width=640&height=640&fit=bounds)

![[DSC Europe 25] Ivan Peric - Intelligence Swarm Logic and Techno-Functional M...](https://cdn.slidesharecdn.com/ss_thumbnails/7my7c97fsduiccadgavw-2-251212103249-5a03f7c6-thumbnail.jpg?width=640&height=640&fit=bounds)

![[DSC Europe 25] Branko Urosevic -Rethinking Financial Talent: Integrating Cod...](https://cdn.slidesharecdn.com/ss_thumbnails/8jjrus8ttko6qj64f58f-3-251212103250-642c6374-thumbnail.jpg?width=640&height=640&fit=bounds)
![[DSC Europe 25] Debmalya Biswas - Agentification: the art of transforming man...](https://cdn.slidesharecdn.com/ss_thumbnails/r5azlggvtqiaiiusrqdr-4-251212103249-5a12c89b-thumbnail.jpg?width=640&height=640&fit=bounds)


![[DSC Europe 25] Miodrag Pesovic & Vladislav Radonjic - Federated Data Archite...](https://cdn.slidesharecdn.com/ss_thumbnails/gsbe3y5it5uhndi4e08e-1-251212103249-f1008e0c-thumbnail.jpg?width=640&height=640&fit=bounds)
![[DSC Europe 25] Tatevik Maytesyan - How to actually use AI in marketing: gett...](https://cdn.slidesharecdn.com/ss_thumbnails/tjo626lsqdgfntbgl2mw-4-251216103155-e36cd239-thumbnail.jpg?width=640&height=640&fit=bounds)


![[DSC Europe 25] Hans Kleinsman - The Compliance Gearbox: How Tax Tech Mediate...](https://cdn.slidesharecdn.com/ss_thumbnails/dxdytie1toel0hr90bjs-2-251212103250-174fdbe7-thumbnail.jpg?width=640&height=640&fit=bounds)