9. article azojete vol. 12 83 93 sunmonu
•
1 like•178 views

http://azojete.com.ng/index.php/Azojete/article/view/117

Recommended
Recommended
More Related Content
What's hot
What's hot (17)
Viewers also liked
Viewers also liked (20)
Similar to 9. article azojete vol. 12 83 93 sunmonu
Similar to 9. article azojete vol. 12 83 93 sunmonu (20)
More from Oyeniyi Samuel
More from Oyeniyi Samuel (20)
Recently uploaded
Recently uploaded (20)
9. article azojete vol. 12 83 93 sunmonu
- 1. Arid Zone Journal of Engineering, Technology and Environment. August, 2016; Vol. 12:83-93 Copyright © Faculty of Engineering, University of Maiduguri, Nigeria. Print ISSN: 1596-2490, Electronic ISSN: 2545-5818 www.azojete.com.ng DEVELOPMENT AND PERFORMANCE EVALUATION OF A RE-CIRCULATORY VEGETABLE MOISTURIZER M. O. Sunmonu1 *, M. M. Odewole1 , O. I. Obajemihi1 and A.T. Ayodeji2 (1 Department of Food Engineering, University of Ilorin, Nigeria 2 Department of Agricultural and Biosystems Engineering, University of Ilorin, Nigeria) *Corresponding author’s e-mail address: sholams2000@yahoo.co.uk Tel.: +2348050745127 Abstract A re-circulatory vegetable moisturizer for preventing wilting in vegetables was developed and its performance evaluation carried out. Freshly harvested Amaranthus vegetables were used for the experiments. The temperature and relative humidity were monitored daily. The vitamin A of this produce was determined at intervals of two days for 9 days. The effects of the storage parameters (temperature and relative humidity) on the nutritional value of the produce were determined using statistical analysis of variance (ANOVA). Further analysis by Duncan’s New Multiple Range Test (DNMRT) was carried out to compare the means. The vegetable moisturizer was evaluated by comparing the change in nutritional (vitamin A) of Amaranthus vegetable with hand wetting system and no wetting condition. The results showed that the moisturizer had higher mean vitamin A content (4.93mg/100g)compared to the mean vitamin A content of the manual wetting (4.88mg/100g) and no wetting condition (4.57mg/100g). The sensory characteristics showed that the Moisturizer was more desirable when compared to the manual wetting and no wetting condition after nine days. It was concluded that the Moisturizer preserved the nutritional and sensory characteristics (texture and colour) better than the manual and no wetting condition as a result of lower temperature, higher relative humidity and better water draining of the Moisturizer. Keywords: Moisturizer, vegetable, nutrition, amaranthus, storage 1. Introduction Vegetables are the fresh and edible portions of herbaceous plants. They are important food and highly beneficial for the maintenance of health and prevention of diseases. They contain valuable food ingredients which can be successfully utilized to build up and repair the body. They are valued mainly for their high carbohydrate, vitamin and mineral contents. Vitamins are organic molecules required in trace amounts for normal development, which cannot be synthesized in sufficient quantity by the organism and must be obtained from the diet. The 14 vitamins known today are vitamin A, B complex [B1, B2, B3, B5, B6, B9, biotin, choline and B12) and vitamins C, D, E and K. The vitamins present in vegetables make an important contribution to human nutrition, as they have specific functions in normal body performance. The vitamin content of vegetables shows a wide variation among species (Salunkhe et al., 1991). Differences within cultivars occur, as well as between different batches of the same cultivar grown under different environmental and orchard conditions (Rodriguez-Amaya, 2001).Vegetables are rich and comparatively cheaper source of vitamins. Consumption of these items provides taste, palatability, increases appetite and provides fibre for digestion and to prevent constipation. Postharvest handling of vegetables is the process involved in storing, preserving and transportation of vegetables after harvest. It begins where production ends. Quality cannot be improved after harvest, only maintained; therefore it is important to harvest vegetables at the proper stage and size and at peak quality.
- 2. Sunmonu et al.: Development and Performance Evaluation of a Re-circulatory Vegetable Moisturizer. AZOJETE, 12:83-93. ISSN 1596-2490; e-ISSN 2545-5818, www.azojete.com.ng 84 Leafy vegetables are mostly water (>90%) and have the propensity to lose water through transpiration. Water loss is the main cause of weight loss (loss in saleable weight) and wilting (Acedo, 2010). A loss of 5-10% of fresh weight would make leafy vegetables to appear wilted and become unusable (Kanlayanarat, 2007). Water loss also induces degradation of nutritional components (e.g. vitamin C loss) and imposes stress (i.e. water stress) that increases respiration and ethylene production (Acedo, 2010).Water loss is one of the most visible changes in vegetables, often being the factor that limits marketing life (Ben-Yehoshua and Rodov 2003; Shamaila, 2005). Due to the too much drudgery involved in constant wetting of leafy vegetables manually by green grocers in markets, there is need to develop a re-circulatory vegetable moisturizer to prevent water loss and wilting of vegetables during postharvest handling and to compare the difference in the nutritional content (vitamin A) of Amaranthus vegetable that is exposed to this moisturizing system, manual wetting condition and ambient condition. 2. Materials and Methods 2.1 Design Consideration and Computation The criteria considered in the design of the vegetable moisturizer included the capacity of tank, availability of materials used for construction at affordable price, minimal maintenance cost and simplicity of the design so that its use could be extended to the general public and finally, the efficient use of water to reduce wastage by making the systems a recyclable type. 2.1.1 Design of components of moisturizer 2.1.1.1 Capacity of storage Tank given as (1) With and 2.1.1.2 Flow Velocity (2) Area of pipe, (3) Diameter of main pipe Diameter of delivery pipe 2.1.2 Pump Power Capacity Pump power requirement was calculated using the expression given by Phocaides (2000) as (4) Q is flow rate in L/s, e1 is the pump efficiency which is approximately 0.5 and e2 is the driving efficiency is approximately 0.7 for electric motors. A 0.5hp pump would be used so that additional head can be produced at the different outlet pipes.
- 3. Arid Zone Journal of Engineering, Technology and Environment, August, 2016; Vol. 12: 83-93. ISSN 1596-2490; e-ISSN 2545-5818, www.azojete.com.ng 85 2.1.3 Pressure at the Outlet For the head at the outlets pipe on each shower, H = 0.5x 75x 0.5x0.7/0.5 = 26.25m. Actual total head = total head loss + head at outlets. Head at outlets , average head on one outlet= 20.23/ 6 = 3.37m Pressure at outlet = 3.37x 9.81 x 1000 Pressure from the shower holes = (5) Number of holes on shower cap= 166 and average diameter of hole = 0.1cm Average area of hole= = 7.9 x 10⁻⁷ m2 . The average values of parameters used in the machine design are presented in Table 1. Table 1: Summary of the parameters used in the development of the Vegetable Moisturizer Parameters Measurements Units _____________________________________________________________________________________________ Capacity of Storage Tank 0.048 m3 Area of the Pipe 5.1 X 10⁻⁴ m2 Velocity of Flow 0.98 m/s Area of Delivery Pipe 1.27 X 10⁻⁴ m2 Velocity of Flow of Delivery Pipe 3.94 m/s Velocity of Discharge 0.66 m/s Pump Capacity 0.11 Hp Pressure at Outlet 33059 N/m2 Pressure from the shower holes 192 N/m2 _____________________________________________________________________________ 2.2 Description of Vegetable Moisturizing System The re-circulatory vegetable moisturizer consists of a tank, pump, pipes and shower system. The pipe is made from polyvinyl chloride, while body of the vegetable moisturizer is made from stainless steel. The tank capacity is 0.048m3 while the pump horse power is ½ hp. 2.2.1 Working Principle of the Equipment Water is pump from the re-circulatory tank through the piping system and it is discharged through the shower system on the vegetables which are placed on top of a wire mesh which separates the vegetable from the storage tank. The pressure of the water is controlled by a valve place at the discharge part of
- 4. Sunmonu et al.: Development and Performance Evaluation of a Re-circulatory Vegetable Moisturizer. AZOJETE, 12:83-93. ISSN 1596-2490; e-ISSN 2545-5818, www.azojete.com.ng 86 the pump. The water is being recycled through the pump and the whole process repeats itself. The photographic presentation of the moisturizer is shown in Figure 1, while its assembly drawing showing the components with part list is a presented in Figure 2. Figure 1: Picture of Vegetable Moisturizer 2.3 Performance Evaluation of Vegetable Moisturizer Three storage systems (vegetable moisturizer, manual wetting system and no wetting system-as control) were set up for testing for Vitamin A for nine days. The water in the moisturizer is to be replaced every three days. About 500 g of Amaranthus vegetable was kept in the vegetable moisturizer and the other two systems.The vegetable moisturizer was used to wet the vegetble three times a day and manual wetting was also done three times.Wet-bulb and dry- bulb temperature in the three sysyems were taken using a wet and dry bulb thermometer in the morning and the evening for the nine days of the experiment.Vitamin A content of amaranthus vegetables were taken in the three systems with three replicates on the second, fifth, seventh and nineth days.The three different storage systems - Moisturizer system, Manual hand wetting system and the control (no wetting) were labelled A,B and C respectively.Each storage systems had three different replicate of vegtable for accuracy of values.The method used in the determination of the vitamin A content of the Amaranthus vegetables was a titrimetric method offerred by AOAC (1995). 3. Results and Discussion Figure 3 shows the variations in the temperatures and relative humidity of Amaranthus vegetables in the three different storage media.. The results suggest that temperature variations within Moisturizer System and Manual Hand Wetting seem to be relatively the same on the average. Slightly higher temperatures values were observed in Control Method (no wetting). Relative humidity on the other hand appears to be slightly lower in Control Method (no wetting) compared to Moisturizer System and
- 5. Arid Zone Journal of Engineering, Technology and Environment, August, 2016; Vol. 12: 83-93. ISSN 1596-2490; e-ISSN 2545-5818, www.azojete.com.ng 87 Manual Hand Wetting while Moisturizer System and Manual hand wetting appears to record relative the same relative humidity on the average. Tan and Considine (2006) noted that moisture present in vegetables increases the relative humidity in storage system. This can be a reason for higher relative humidity in the moisturizer (83.11%) and manual hand wetting system (84.89%). Figure 2: Vegetable Moisturizer Assembly ( Vegetable Water Sprinkler)
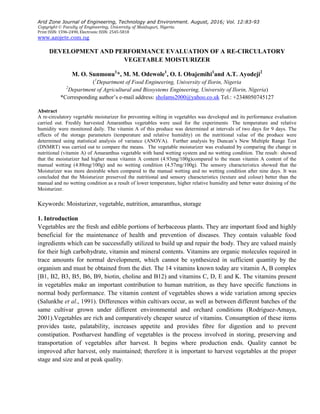
- 6. Sunmonu et al.: Development and Performance Evaluation of a Re-circulatory Vegetable Moisturizer. AZOJETE, 12:83-93. ISSN 1596-2490; e-ISSN 2545-5818, www.azojete.com.ng 88 Figure 3: Variations in Temperature (o C) and Relative Humidity (%) within Storage type The analysis of variance (Table 2) shows that temperature variations within storage types were significant at 10% level of significance However, variations in relative humidity within storage types were not significant. This shows that temperature changes within storage type depend onto a large extent the storage systems used. This was as a result of different water level present in the different storage systems as discussed earlier (Mittal et al., 2006). But relative humidity variations do not depend on storage system (Moisturizer System, Manual Hand Wetting and Control Systems). Since the three systems were exposed to the same ventilations (room), the vapour pressure change should almost be the constant (Bachmann and Earles, 2000). To determine the differences in variations temperature along the levels of the storage conditions, the New Duncan’s Multiple Range Test (NDMRT) was conducted (Table 3). The result of the comparison among the levels of storage conditions shows that Control Method has the highest temperature variations. Moisturizer System and Manual Hand Wetting shows the same temperature variations. The high temperature variation of the control shows that the temperature depends on the ambient temperature of the room but the moisturizer and the manual method depend on the temperature of the water used in wetting. Relative 28.56 28.47 29.56 83.11 84.89 80.33 0 10 20 30 40 50 60 70 80 90 Sprinkler System Manual Hand Wetting Control Method Sprinkler System Manual Hand Wetting Control Method Temperature Relative Humidity Temperature(OC)/RelativeHumidity(%)
- 7. Arid Zone Journal of Engineering, Technology and Environment, August, 2016; Vol. 12: 83-93. ISSN 1596-2490; e-ISSN 2545-5818, www.azojete.com.ng 89 humidity observed in all levels of the storage type as reported by Bachmann and Earles (2000) due to the fact of same room condition. Table 4 compares vitamins A content of the stored vegetables along storage type and it revealed that vitamin A content of the stored vegetables in all storage types are different from each other’s irrespective of the storage days. Figure 4 graphically illustrates the vitamin A content and it shows that the vitamin A content in the moisturizer system and manual hand wetting system is higher compared to the control (no wetting system). Anjum et al. (2008) emphasized that storing vegetables at room temperature gradually decreases beta-carotene (vitamin A) content which is the reason for reduction in vitamin A of the control method. The moisturizer system and the manual hand wetting retained a higher vitamin A which was 4.93mg/100g and 4.88mg/100grespectively because of the water present which causes evaporative cooling and thereby reducing temperature (Mittal et al., 2010). From Table 4, it is also seen that there is decrease in the content of vitamin A as storage progresses. Table 2: Analysis of Variance (ANOVA) of the effect of temperature (O C) and Relative Humidity (%) on storage type Sum of Squares Df Mean Square F Sig. Temperature Storage Types Between ST 13.083 2 6.542 3.030 0.057* Within ST 110.125 51 2.159 Total 123.208 53 Relative Humidity Storage Types Between ST 189.778 2 94.889 1.703 0.192 Within ST 2841.556 51 55.717 Total 3031.333 53 *significant ST- Storage Type Table 3: New Duncan’s Multiple Range Test (NDMRT) of the variations in Temperature (o C) and Relative Humidity (%) on the storage type Main Factor Storage Type Average Value Temperature (o C) Moisturizer System 28.56a Manual Hand Wetting 28.47a Control Method 29.56b Relative Humidity (%) Moisturizer System 83.11a Manual Hand Wetting 84.89a Control Method 80.33a Means with the same alphabet are not significantly different from each other
- 8. Sunmonu et al.: Development and Performance Evaluation of a Re-circulatory Vegetable Moisturizer. AZOJETE, 12:83-93. ISSN 1596-2490; e-ISSN 2545-5818, www.azojete.com.ng 90 Table 4: Effect of storage type on Vitamin A Content (mg/100g) of Amaranthus Vegetable Storage Factors Vitamin Mean Std. D Minimum Maximum Storagecondition Moisturizer System Vitamin A 4.93 0.08 4.85 5.10 Manual Wetting Vitamin A 4.88 0.15 4.65 5.15 Control Method Vitamin A 4.57 0.18 4.40 4.90 Figure 4: Effect of Storage Type on Vitamin A content (mg/100g) of Amaranthus From Table 5, it can be seen that as the day goes by there is decrease in the content of vitamin A. One major reason is that beta- carotene (vitamin A) is rapidly oxidized when exposed to light and oxygen (Howard et al., 1999). The Analysis of variance result of the effect of storage type, and storage days on vitamin A is presented on Table 6. It can be observed that storage type and storage days had significant effect on vitamin A at 5% level of significance. This implies that vitamins A content of stored vegetables differs significantly across the storage type and storage days. It can be concluded that the variation or discrepancies observed in vitamin A were due to the different storage type used and storage days. The storage type affected the variation in vitamin A content because the different storage types have different temperature which implies different vitamin A content. This agrees with Azevedo and Rodriguez-Amaya (2005) that concluded that higher temperatures increase the biosynthesis of vitamin A (carotenoids) which results in loss of Vitamin A. Table 7 shows the comparisons between the different levels of storage type, storage days using the New Duncan Multiple Range Test (NDMRT) and it shows that vitamin A content of the vegetables stored in Moisturizer System and Manual Hand Wetting were statistically the same on the average but were significantly 4.93 4.88 4.57 4.3 4.4 4.5 4.6 4.7 4.8 4.9 5 Sprinkler System Manual Hand Wetting Control Method VitaminA(mg/100g) Storage Type
- 9. Arid Zone Journal of Engineering, Technology and Environment, August, 2016; Vol. 12: 83-93. ISSN 1596-2490; e-ISSN 2545-5818, www.azojete.com.ng 91 higher than the vitamin A contents of vegetables stored in Control Method. This agrees with Kader (2002) that high temperature is a major cause of postharvest loss in nutritional content which was a reason for lower vitamin A content (higher temperature). The mean value of vitamin A content of stored vegetable differs significantly across storage day 2 and day 9 respectively while for day 5 and day 7 the mean value of vitamin A content remain the same. This implies that, depending the storage type, the average vitamin A contents of stored Vegetables of (day 2) (day 5and 7), (day 9) are statistically different due to the degradation of Vitamin A along storage days(Cardoso and Lucia et al., 2009). Table 5: Effect of Storage Days on Vitamin A Content (mg/100g) of Amaranthus Vegetable Storage Factors Vitamin Mean Std. D Minimum Maximum Storage Days 2nd Day Vitamin A 4.97 0.13 4.80 5.15 5th Day Vitamin A 4.80 0.20 4.50 5.10 7th Day Vitamin A 4.74 0.21 4.45 4.95 9th Day Vitamin A 4.67 0.20 4.40 4.90 Table 6: Analysis of Variance (ANOVA) on the Effect of Storage Type and Storage Days on Vitamin A content (mg/100g) of Stored Amaranthus Vegetable Source Sum of Squares Df Mean Square F Sig. ST 0.902 2 0.451 71.41 0.001* SD 0.441 3 0.147 23.30 0.001* ST * SD 0.098 6 0.016 2.58 0.045* Error 0.152 24 0.006 Total 1.593 35 *significant at 5% ST- Storage Type SD- Storage Days Table 7: New Duncan’s Multiple Range Test (NDMRT) to compare the Different Levels of Storage Type and Storage Days on the Vitamin A content (mg/100g) of Amaranthus Vegetable Main Factor Level Vitamin A (mg/100g) Storage Type Moisturizer System 4.93a Manual Hand Wetting 4.88a Control Method 4.57b Storage Days Day 2 4.97a Day 5 4.80b Day 7 4.74b Day 9 4.67c Means with the same alphabet are not significantly different from each other
- 10. Sunmonu et al.: Development and Performance Evaluation of a Re-circulatory Vegetable Moisturizer. AZOJETE, 12:83-93. ISSN 1596-2490; e-ISSN 2545-5818, www.azojete.com.ng 92 Table7 also shows the comparisons between the different levels of storage type, storage days using the New Duncan Multiple Range Test (NDMRT). From Table 7it can be seen that vitamin A content of the vegetables stored in Moisturizer System and Manual Hand Wetting were statistically the same on the average but were significantly higher than the vitamin A contents of vegetables stored in Control Method. This agrees with Kader (2002) that high temperature is a major cause of postharvest loss in nutritional content which was a reason for lower vitamin A content (higher temperature). The mean value of vitamin A content of stored vegetable differs significantly across storage day 2 and day 9 respectively while for day 5 and day 7 the mean value of vitamin A content remain the same. This implies that depending the storage type, the average vitamin A contents of stored Vegetables of day 2, days 5and 7, day 9 are statistically different due to the degradation of Vitamin A along storage days (Cardoso and Lucia et al., 2009). 4. Conclusion A vegetable moisturizer was developed to reduce water loss in vegetables during postharvest storage. The difference in nutritional content (vitamin A) of Amaranthus vegetable that is exposed to this moisturizing system, manual wetting condition and exposed to ambient condition (no wetting) was compared. The following can be concluded 1. The vegetable moisturizer was able to reduce drudgery encountered in manual wetting of vegetables 2. The vegetable moisturizer was more efficient in reducing water loss and thereby preserving the sensory properties better as well as retaining higher value of vitamin A in the system. 3. The percentage vitamin A loss in the moisturizer (4%) was lower when compared to the manual hand wetting (6%) and the no wetting condition (12%). References Acedo, AL. 2010. Postharvest technology for leafy vegetables.AVRDC-ADB Postharvest Projects RETA 6208/6376.AVRDC Publication No. 10.AVRDC - The World Vegetable Centre, Shanhua, Tainan, Taiwan, pp. 67. Anjum, F., Kham,BA.,Noreen, N., Masood,T. and Faisal, S. 2008. Effect of boiling and storage on beta- carotene content of different vegetables. Pakistan Journal of Life and Social Sciences, 6(1): 63- 67. AOAC. 1995.Official methods of analysis.Association of Official Analytical Chemists, 16th edition, vol. 2. Arlington, VA, USA. Azevedo, CH. and Rodriguez- Amaya, DB. 2005. Caroteniod composition of kale as influenced by maturity, season and minimal processing. Journal of the Science of Food and Agriculture, 85(4): 591- 597. Bachmann, J. and Earles, R. 2000. Postharvest handling of fruits and vegetables. Appropriate Technology Transfer for Rural Areas Horticulture Technical Note. Fayetteville, NC, USA, pp. 19.
- 11. Arid Zone Journal of Engineering, Technology and Environment, August, 2016; Vol. 12: 83-93. ISSN 1596-2490; e-ISSN 2545-5818, www.azojete.com.ng 93 Ben-Yehoshua, S. and Rodov, V. 2003. Transpiration and water stress. Postharvest Physiology and Pathology of Vegetables. New York: Marcel Dekker New York, NY, USA, pp 111-159. Cardoso, PS., Lucia, CM., Stringheta, PC., Charles, JB. and Pinheiro- Sant Ana, HM. 2009. Carotene and pro-vitamin A content of vegetables sold in Vicosa, Brazil during spring and winter, Brazilian Journal of Pharmaceutical Sciences, 45: 527–537. Howard, LA., Wong, AD., Perry, AK. and Klein, BP. 1999. Beta- carotene and ascorbic acid retention in fresh and processed vegetable, Journal of Food Science, 64: 929 – 936. Kader, AA. 2002. Quality parameters of fresh cut fruits and vegetables products. In Fresh-cut fruits and Vegetables. Lamikanra O., Ed, Science, Technology and Market, CRC Press, Boca Raton, Florida, pp. 11-20. Kanlayanarat S. 2007. Postharvest technologies for fresh leafy vegetables in Thailand. Paper presented during the RETA 6376 Workshop on Best Practices in Postharvest Management of Leafy Vegetables in GMS Countries, Hanoi, Vietnam. Mittal, A., Kataria, T., Das, GK. and Chatteree, SG. 2006. Evaporative cooling of water in a small vessel under varying ambient humidity, International Journal of Green Energy, 3: 347-368. Phocaides, A. 2000. Technical handbook on pressurized irrigation techniques. Food and Agriculture Organization of the United Nations Rome, 2000. Rodriguez-Amaya, DB. 2001. A Guide to carotenoid analysis in foods. ILSI Press, International Life Sciences Institute, One Thomas Circle, N.W. Washington, DC, USA. Salunkhe, DK., Bolin, HR. and Reddy, NR. 1991. Storage, processing, and nutritional quality of fruits and vegetables. Volume I. Fresh Fruits and Vegetables. CRC Press, Boston, MA, USA. Shamaila, M. 2005. Water and its relation to fresh produce. Produce Degradation: Pathways and Prevention. Boca Raton, FL: Taylor and Francis, Florida, pp 267-291. Tan, SC. and Considine, M., 2006. Storage conditions for fresh fruits and vegetables. Department of Agriculture and Food. Government of Western Australia, Kensington, pp. 145.