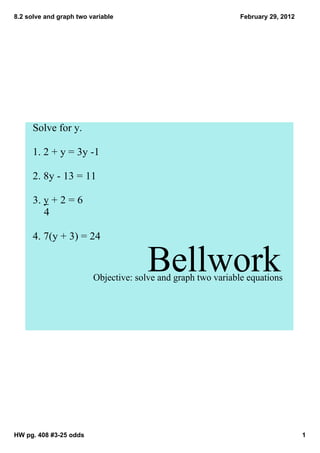
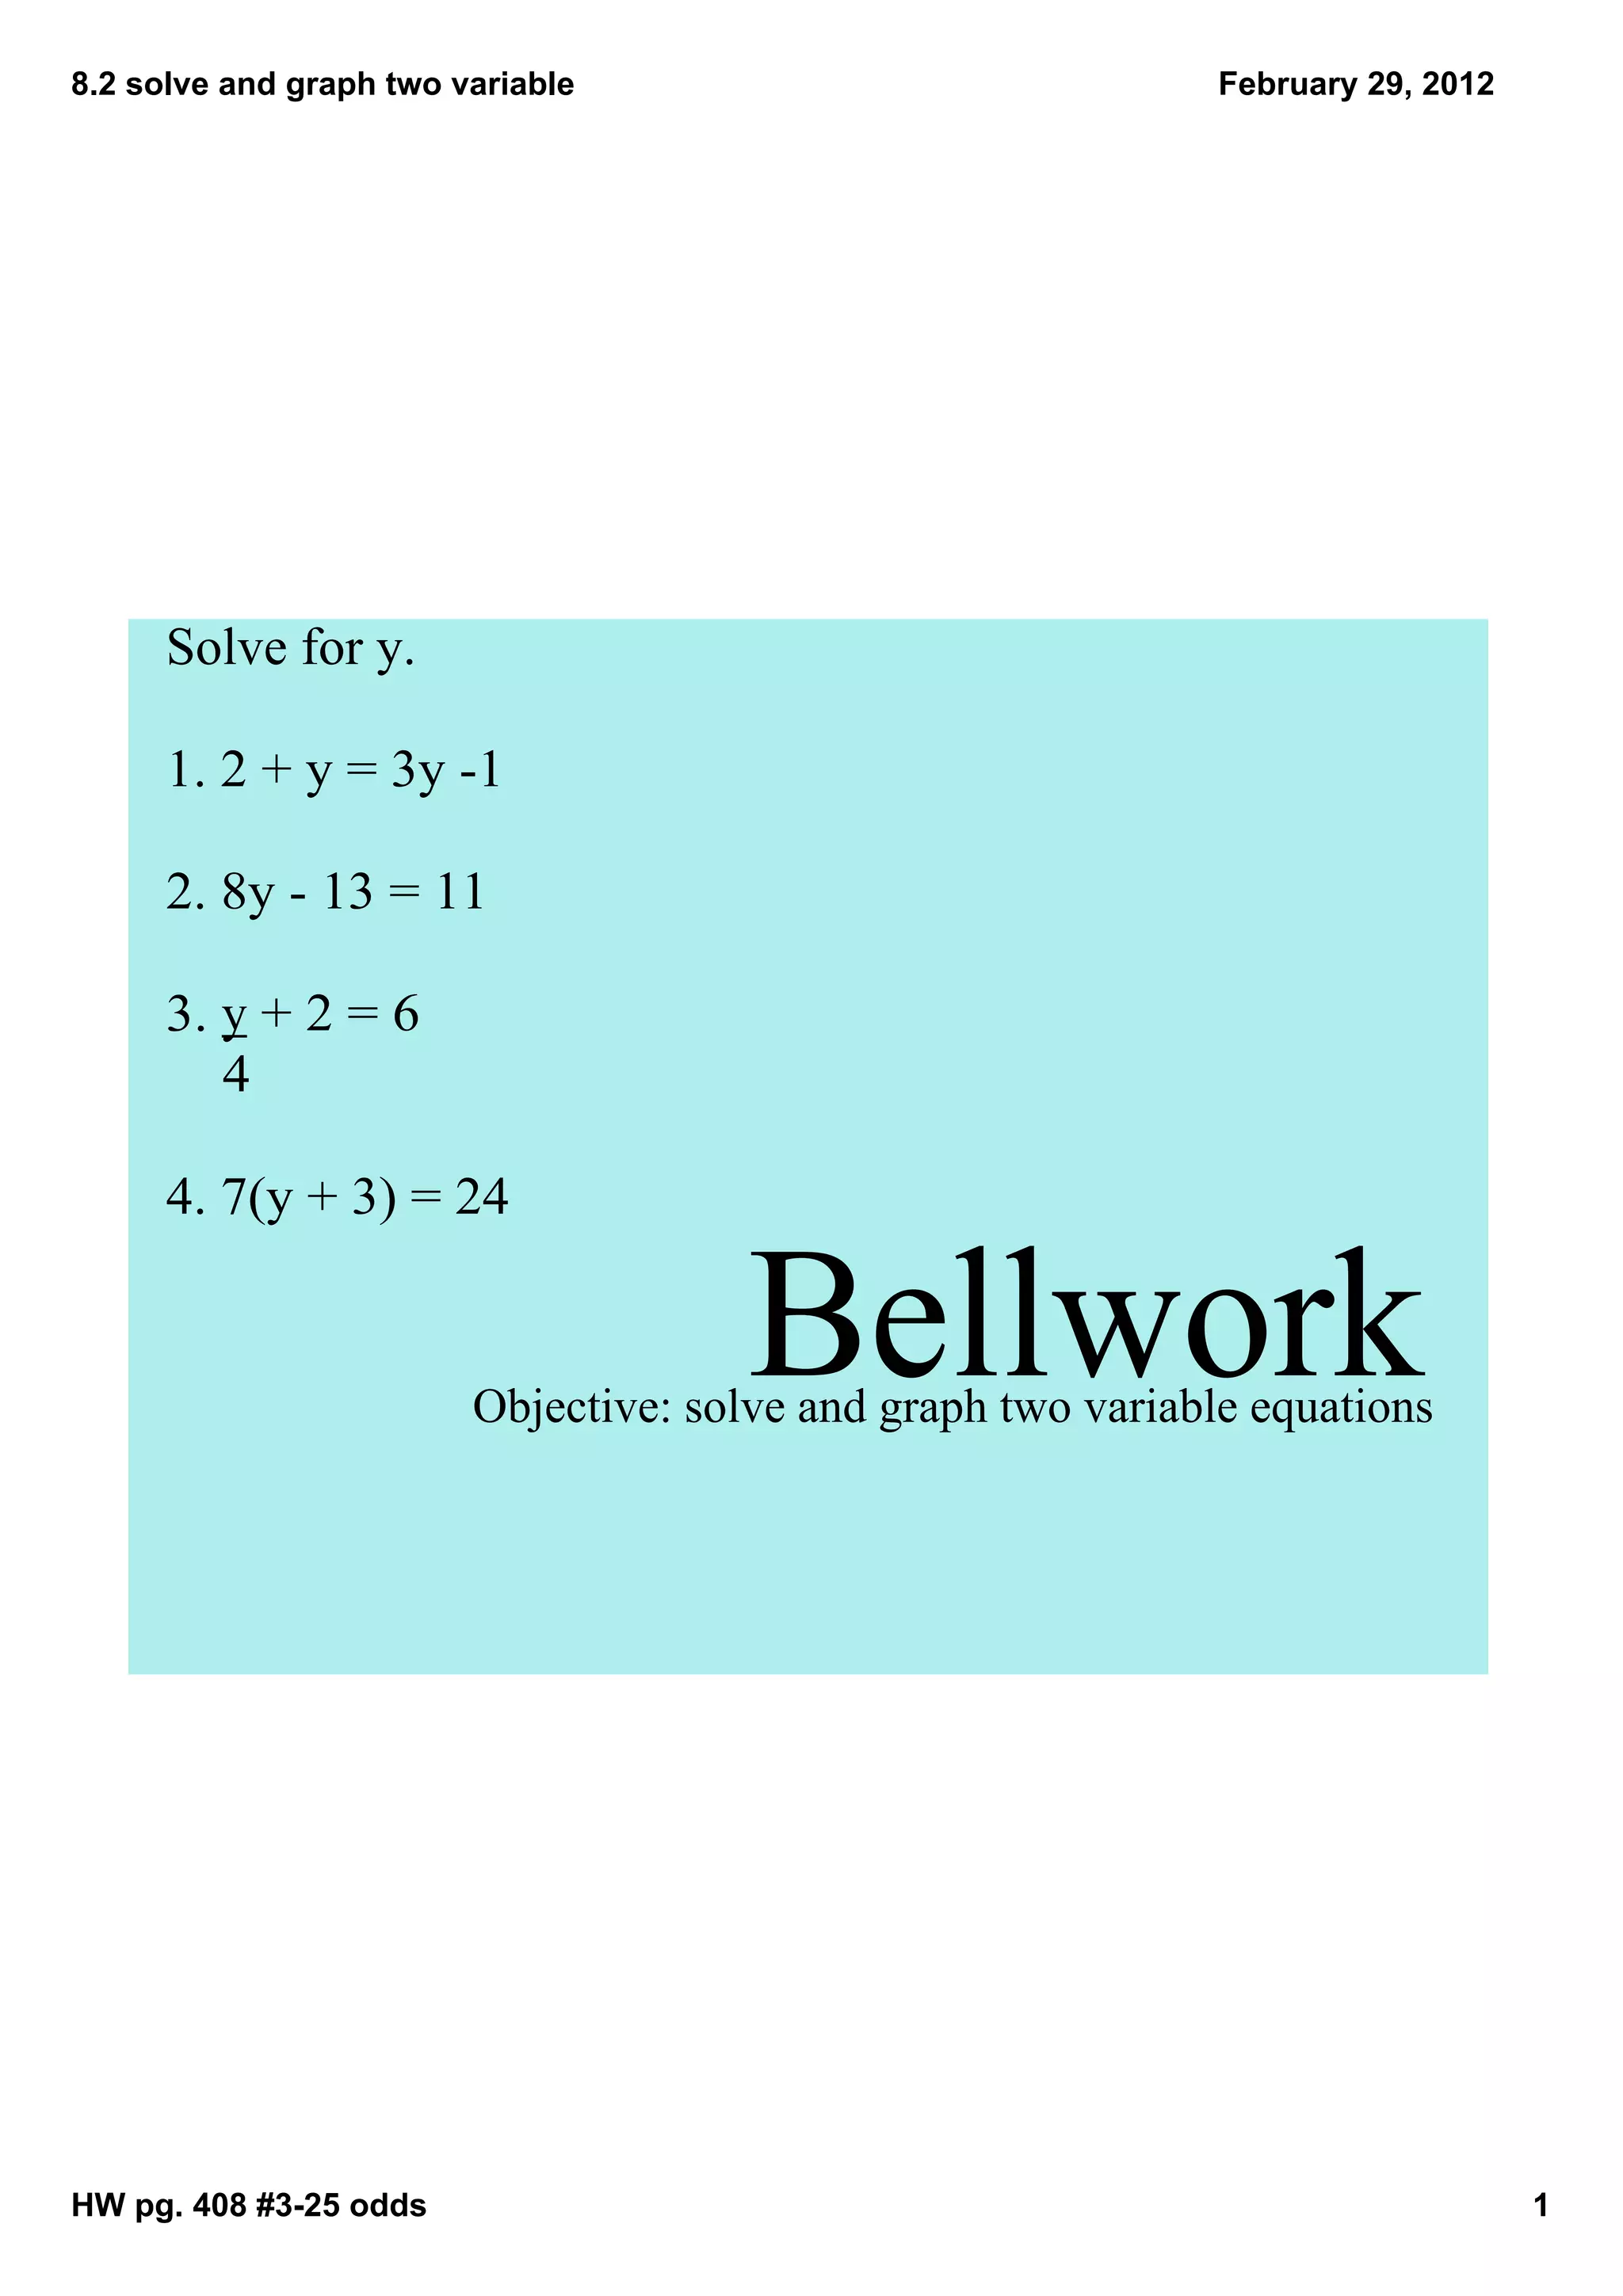
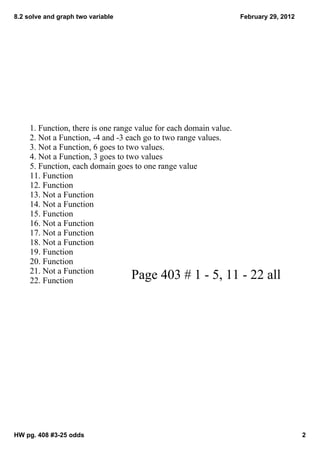
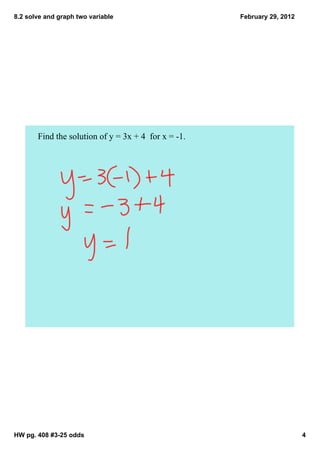
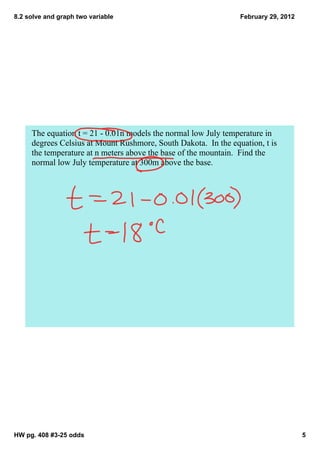
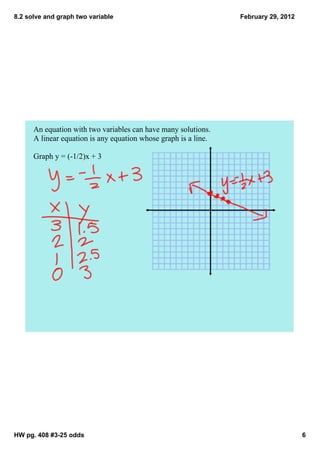
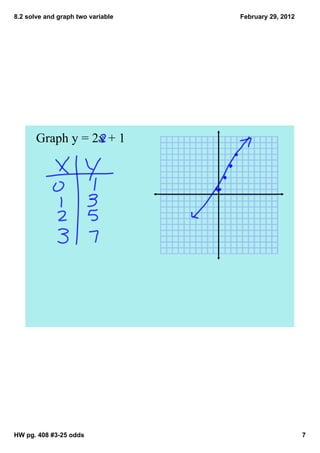
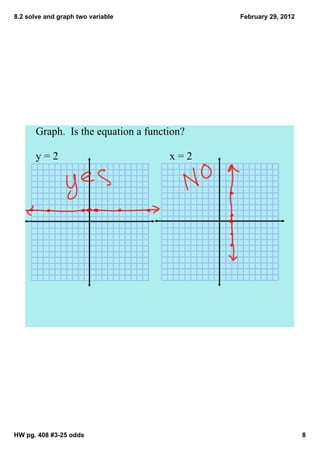
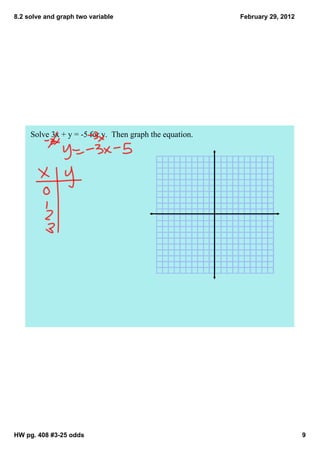
8.2 solve and graph two variable                               February 29, 2012


      Solve for y.

      1. 2 + y = 3y ­1

      2. 8y ­ 13 = 11

      3. y + 2 = 6
          4

      4. 7(y + 3) = 24


                                       Bellwork
                         Objective: solve and graph two variable equations


HW pg. 408 #3­25 odds                                                              1
8.2 solve and graph two variable                                    February 29, 2012


     1. Function, there is one range value for each domain value.
     2. Not a Function, ­4 and ­3 each go to two range values.
     3. Not a Function, 6 goes to two values.
     4. Not a Function, 3 goes to two values
     5. Function, each domain goes to one range value
     11. Function
     12. Function
     13. Not a Function
     14. Not a Function
     15. Function
     16. Not a Function
     17. Not a Function
     18. Not a Function
     19. Function
     20. Function
     21. Not a Function
     22. Function
                                   Page 403 # 1 ­ 5, 11 ­ 22 all


HW pg. 408 #3­25 odds                                                                   2
8.2 solve and graph two variable   February 29, 2012


HW pg. 408 #3­25 odds                                  3
8.2 solve and graph two variable                      February 29, 2012


       Find the solution of y = 3x + 4  for x = ­1.


HW pg. 408 #3­25 odds                                                     4
8.2 solve and graph two variable                                 February 29, 2012


     The equation t = 21 ­ 0.01n models the normal low July temperature in 
     degrees Celsius at Mount Rushmore, South Dakota.  In the equation, t is 
     the temperature at n meters above the base of the mountain.  Find the 
     normal low July temperature at 300m above the base.  


HW pg. 408 #3­25 odds                                                                5
8.2 solve and graph two variable                                   February 29, 2012


      An equation with two variables can have many solutions.  
      A linear equation is any equation whose graph is a line.  

      Graph y = (­1/2)x + 3


HW pg. 408 #3­25 odds                                                                  6
8.2 solve and graph two variable   February 29, 2012


       Graph y = 2x + 1


HW pg. 408 #3­25 odds                                  7
8.2 solve and graph two variable              February 29, 2012


       Graph.  Is the equation a function?

       y = 2                          x = 2


HW pg. 408 #3­25 odds                                             8
8.2 solve and graph two variable                          February 29, 2012


     Solve 3x + y = ­5 for y.  Then graph the equation.


HW pg. 408 #3­25 odds                                                         9
8.2 solve and graph two variable           February 29, 2012


                  HW pg. 408 # 3­25 odds


HW pg. 408 #3­25 odds                                          10

8.2 notes

  • 1.
    8.2 solve and graph two variable February 29, 2012 Solve for y. 1. 2 + y = 3y ­1 2. 8y ­ 13 = 11 3. y + 2 = 6     4 4. 7(y + 3) = 24 Bellwork Objective: solve and graph two variable equations HW pg. 408 #3­25 odds 1
  • 2.
    8.2 solve and graph two variable February 29, 2012 1. Function, there is one range value for each domain value. 2. Not a Function, ­4 and ­3 each go to two range values. 3. Not a Function, 6 goes to two values. 4. Not a Function, 3 goes to two values 5. Function, each domain goes to one range value 11. Function 12. Function 13. Not a Function 14. Not a Function 15. Function 16. Not a Function 17. Not a Function 18. Not a Function 19. Function 20. Function 21. Not a Function 22. Function Page 403 # 1 ­ 5, 11 ­ 22 all HW pg. 408 #3­25 odds 2
  • 3.
    8.2 solve and graph two variable February 29, 2012 HW pg. 408 #3­25 odds 3
  • 4.
    8.2 solve and graph two variable February 29, 2012 Find the solution of y = 3x + 4  for x = ­1. HW pg. 408 #3­25 odds 4
  • 5.
    8.2 solve and graph two variable February 29, 2012 The equation t = 21 ­ 0.01n models the normal low July temperature in  degrees Celsius at Mount Rushmore, South Dakota.  In the equation, t is  the temperature at n meters above the base of the mountain.  Find the  normal low July temperature at 300m above the base.   HW pg. 408 #3­25 odds 5
  • 6.
    8.2 solve and graph two variable February 29, 2012 An equation with two variables can have many solutions.   A linear equation is any equation whose graph is a line.   Graph y = (­1/2)x + 3 HW pg. 408 #3­25 odds 6
  • 7.
    8.2 solve and graph two variable February 29, 2012 Graph y = 2x + 1 HW pg. 408 #3­25 odds 7
  • 8.
    8.2 solve and graph two variable February 29, 2012 Graph.  Is the equation a function? y = 2 x = 2 HW pg. 408 #3­25 odds 8
  • 9.
    8.2 solve and graph two variable February 29, 2012 Solve 3x + y = ­5 for y.  Then graph the equation. HW pg. 408 #3­25 odds 9
  • 10.
    8.2 solve and graph two variable February 29, 2012 HW pg. 408 # 3­25 odds HW pg. 408 #3­25 odds 10