
Recommended
More Related Content
Similar to 8 fhwa tx 0-5860-1
Similar to 8 fhwa tx 0-5860-1 (20)
More from Sierra Francisco Justo
More from Sierra Francisco Justo (20)
Recently uploaded
Recently uploaded (20)
8 fhwa tx 0-5860-1
- 1. Technical Report Documentation Page 1. Report No. FHWA/TX-10/0-5860-1 2. Government Accession No. 3. Recipient’s Catalog No. 4. Title and Subtitle GUIDELINES FOR SPACING BETWEEN FREEWAY RAMPS 5. Report Date November 2009 Published: March 2010 6. Performing Organization Code 7. Author(s) Kay Fitzpatrick, Richard J. Porter, Geza Pesti, Chi-Leung Chu, Eun Sug Park, and Thanh Le 8. Performing Organization Report No. Report 0-5860-1 9. Performing Organization Name and Address Texas Transportation Institute The Texas A&M University System College Station, Texas 77843-3135 10. Work Unit No. (TRAIS) 11. Contract or Grant No. Project 0-5860 12. Sponsoring Agency Name and Address Texas Department of Transportation Research and Technology Implementation Office P. O. Box 5080 Austin, Texas 78763-5080 13. Type of Report and Period Covered Technical Report: September 2007–August 2009 14. Sponsoring Agency Code 15. Supplementary Notes Project performed in cooperation with the Texas Department of Transportation and the Federal Highway Administration. Project Title: Guidelines for Ramp Terminal Spacing for Freeways URL: http://tti.tamu.edu/documents/0-5860-1.pdf 16. Abstract Existing geometric design guidance related to interchange ramp spacing in the Texas Roadway Design Manual and the AASHTO’s A Policy on Geometric Design of Highways and Streets (Green Book) is not speed-dependent even though intuition indicates spacing and speed are related. Understanding the relationship between interchange ramp spacing, speed, and freeway operations is important, especially in developing potential design values for higher speeds (e.g., 85 to 100 mph). The objectives of this project were to: (a) investigate relationships between weaving length, speed, and overall vehicle operations on Texas freeways and (b) propose updates to current Texas Department of Transportation guidance on recommended distances between ramps. Within the research tasks several methods were utilized to assist in developing guidance on ramp spacing lengths. The methods or resources used to generate potential lengths included: guidance provided in Design Manual for Roads and Bridges published by the Highways Agency in England, minimum deceleration and acceleration length for freeway conditions, decision sight distance, sign spacing needs, NCHRP project 3-75 findings, findings from field studies at seven study sites, findings from simulation conducted as part of this research, and safety relationships identified in the literature. Suggested ramp spacings were developed for the entrance ramp to exit ramp and exit ramp to exit ramp conditions. 17. Key Words Freeway, Ramp Spacing, Weaving 18. Distribution Statement No restrictions. This document is available to the public through NTIS: National Technical Information Service Springfield, Virginia 22161 http://www.ntis.gov 19. Security Classif.(of this report) Unclassified 20. Security Classif.(of this page) Unclassified 21. No. of Pages 118 22. Price Form DOT F 1700.7 (8-72) Reproduction of completed page authorized
- 3. GUIDELINES FOR SPACING BETWEEN FREEWAY RAMPS by Kay Fitzpatrick, Ph.D., P.E. Senior Research Engineer Texas Transportation Institute Richard J. Porter, Ph.D. Formerly: Associate Transportation Researcher Texas Transportation Institute Geza Pesti, Ph.D., P.E. Associate Research Engineer Texas Transportation Institute Chi-Leung Chu, Ph.D. Assistant Transportation Researcher Texas Transportation Institute Eun Sug Park, Ph.D. Associate Research Scientist Texas Transportation Institute and Thanh Le Graduate Assistant Researcher Texas Transportation Institute Report 0-5860-1 Project 0-5860 Project Title: Guidelines for Ramp Terminal Spacing for Freeways Performed in cooperation with the Texas Department of Transportation and the Federal Highway Administration November 2009 Published: March 2010 TEXAS TRANSPORTATION INSTITUTE The Texas A&M University System College Station, Texas 77843-3135
- 5. v DISCLAIMER The contents of this report reflect the views of the authors, who are responsible for the facts and the accuracy of the data presented herein. The contents do not necessarily reflect the official view or policies of the Federal Highway Administration (FHWA) or the Texas Department of Transportation (TxDOT). This report does not constitute a standard, specification, or regulation. The engineer in charge was Kay Fitzpatrick, P.E. (TX-86762).
- 6. vi ACKNOWLEDGMENTS This project was conducted in cooperation with the Texas Department of Transportation (TxDOT) and the Federal Highway Administration (FHWA). The authors thank the members of TxDOT’s Project Monitoring Committee: • Tracy Jones, P.E. – TxDOT Abilene District, Project Director • Neil Welch, P.E. – TxDOT Lubbock District, Former Project Director • Julia Brown, P.E. – TxDOT San Antonio District, Project Advisor • Dwayne Halbardier, P.E. – TxDOT Austin District, Project Advisor • Charles Koonce, P.E. – TxDOT Traffic Operations Division, Project Advisor • Jianming Ma, P.E. – TxDOT Traffic Operations Division, Project Advisor • Wade Odell, P.E. – TxDOT Research and Technology Implementation Office, Research Engineer • Loretta Brown – TxDOT Research and Technology Implementation Office, Contract Specialist In addition, the authors would like to thank the following numerous TxDOT officials who assisted the research team in collecting data on Texas freeways including: • Eagen O’Brien – Senior Network Administrator, Houston TranStar • David Fink – Transportation Engineer, Houston TranStar • Rick Cortez – Freeway Management Engineer, Dallas District • Joseph Hunt – Information Systems Analyst, Dallas District • Daniel Loving – ITS Systems Analyst, Dallas District Finally, the authors would like to thank the following Texas Transportation Institute (TTI) employees who provided general guidance during the study, assisted with data collection, or performed data reduction for the field studies: • Curtis Beaty – Associate Research Engineer • Stephanie Bradley – Student Worker • Jordan Easterling – Student Worker • Nam Giao – Student Worker • Katherine Green – Student Worker • Jeremy Johnson – Engineering Research Associate • Ivan Lorenz – Research Specialist • Robert Martin – Student Worker • Thomas McLeland – Student Worker • Jonathan Tydlacka – Associate Transportation Researcher • Dan Walker – Assistant Research Specialist • Diana Wallace – Programmer/Analyst • Tony Voight – Research Engineer
- 7. vii TABLE OF CONTENTS Page LIST OF FIGURES..................................................................................................................... ix LIST OF TABLES....................................................................................................................... xi CHAPTER 1 INTRODUCTION................................................................................................ 1 RESEARCH OBJECTIVES....................................................................................................... 1 RESEARCH APPROACH ......................................................................................................... 2 REPORT ORGANIZATION...................................................................................................... 3 CHAPTER 2 LITERATURE REVIEW.................................................................................... 5 BACKGROUND ........................................................................................................................ 5 PHYSICAL RELATIONSHIPS BETWEEN INTERCHANGE FEATURES .......................... 6 A HISTORIC LOOK AT RAMP SPACING DESIGN DIMENSIONS.................................... 7 OPERATIONAL ANALYSIS OF INTERCHANGE RAMPS AND RAMP SPACING ....... 12 Highway Capacity Manual ................................................................................................... 12 Freeway Weaving ............................................................................................................. 12 Ramps and Ramp Junctions.............................................................................................. 17 Microscopic Simulation........................................................................................................ 17 NCHRP Project 3-75............................................................................................................. 18 INTERNATIONAL GUIDANCE ............................................................................................ 20 MINIMUM LENGTH FROM DECELERATION AND ACCELERATION ......................... 23 DECISION SIGHT DISTANCE .............................................................................................. 25 SAFETY ................................................................................................................................... 27 SIGN SPACING FOR AN EXIT RAMP................................................................................. 31 CHAPTER 3 FIELD STUDIES................................................................................................ 33 OPERATIONAL MEASURES................................................................................................ 33 DATA COLLECTION EQUIPMENT..................................................................................... 34 SITE IDENTIFICATION......................................................................................................... 38 DATA COLLECTION AND REDUCTION ........................................................................... 41 CHAPTER 4 SIMULATION.................................................................................................... 45 MODEL SELECTION ............................................................................................................. 45 SIMULATION TEST BEDS.................................................................................................... 46 INITIAL SIMULATION RUNS .............................................................................................. 48 MODEL CALIBRATION........................................................................................................ 51 SIMULATION OF RAMP SPACING SCENARIOS.............................................................. 53 CHAPTER 5 ANALYZE RESULTS ....................................................................................... 57 EVALUATION OF THE EFFECTS OF WEAVING LENGTH............................................. 57 WEAVING LENGTHS............................................................................................................ 57 SPEED BY VOLUME.............................................................................................................. 60 SPEED LOCATION................................................................................................................. 62 FIELD DATA EVALUATIONS.............................................................................................. 63 5-Minute Bin Counter Data with Weaving Length as a Continuous Variable ..................... 63 5-Minute Bin Counter Data with Weaving Length as a Discrete Variable .......................... 64 5-Minute Bin Video Data with Weaving Length as a Continuous Variable ........................ 69 5-Minute Bin Video Data with Weaving Length as a Discrete Variable ............................. 77
- 8. viii SIMULATION DATA EVALUATION .................................................................................. 77 Analysis of Speed Data at E2................................................................................................ 79 Observations from Simulation.............................................................................................. 88 CHAPTER 6 DEVELOP RECOMMENDATIONS............................................................... 89 ENGLAND............................................................................................................................... 89 MINIMUM DECELERATION AND ACCELERATION LENGTHS ................................... 90 DECISION SIGHT DISTANCE .............................................................................................. 90 NCHRP PROJECT 3-75........................................................................................................... 91 PROJECT 0-5860 FIELD STUDIES AND SIMULATION.................................................... 91 SAFETY ................................................................................................................................... 92 RECOMMENDATION FOR MINIMUM LENGTH.............................................................. 92 Case 1: Entrance Ramp Followed by Exit Ramp.................................................................. 92 Case 2: Exit Ramp Followed by Exit Ramp......................................................................... 93 Case 3: Entrance Ramp Followed by Entrance Ramp and Case 4: Exit Ramp Followed by Entrance Ramp...................................................................................................................... 94 General Note......................................................................................................................... 95 FUTURE NEEDED STUDIES ................................................................................................ 95 CHAPTER 7 SUMMARY AND CONCLUSIONS................................................................. 97 SUMMARY OF RESEARCH.................................................................................................. 97 Weaving................................................................................................................................ 97 Sign Design......................................................................................................................... 100 CONCLUSIONS .................................................................................................................... 100 REFERENCES.......................................................................................................................... 103
- 9. ix LIST OF FIGURES Page Figure 1-1. Arrangements for Successive Ramps from Texas Roadway Design Manual Figure 3-51 (1)........................................................................................................ 2 Figure 2-1. Recommended Minimum Ramp Terminal Spacing, AASHTO 2004 Policy Exhibit 10-68 (2)..................................................................................................... 5 Figure 2-2. Relationship between Longitudinal Interchange and Ramp Dimensions (5)............... 6 Figure 2-3. Arrangements for Successive Ramp Terminals, AASHO 1965 Policy Figure IX-11 (10).................................................................................................... 9 Figure 2-4. Successive Exit Terminals, AASHTO 1973 Policy Figure J-30 (11)........................ 10 Figure 2-5. Recommended Minimum Ramp Terminal Spacing, Leisch, 1975 (12). ................... 11 Figure 2-6. Recommended Minimum Ramp Terminal Spacing, 1984 AASHTO Green Book Figure X-67 (13). .................................................................................................. 11 Figure 2-7. Operating Characteristics of Weaving Sections (23)................................................. 13 Figure 2-8. Relationships between Weaving Length, Weaving Flow Rate, and Speed on a 55 mph Freeway.................................................................................................... 15 Figure 2-9. Relationships between Weaving Length, Weaving Flow Rate, and Speed on an 75 mph Freeway.................................................................................................... 15 Figure 2-10. Nomograph for Design and Analysis of Weaving Sections – One-Sided Configurations (22)............................................................................................... 16 Figure 2-11. Maximum Weaving Length for Volume Ratio Based on Proposed Equation for the 2010 HCM................................................................................................. 19 Figure 2-12. Ramp Terminal Spacing (6) (Figure Converted to U.S. Customary Units)............. 21 Figure 2-13. Weaving Length Diagram for Urban Roads (32) (Figure Converted to U.S. Customary Units).................................................................................................. 22 Figure 2-14. Analysis of Accident Rates by Weaving Areas Length Reported by Cirillo (45). .. 28 Figure 2-15. Summary of Freeway Models from Bared et al. (47). ............................................. 29 Figure 2-16. Summary of Freeway Models from Bared et al. with Results Normalized for Segment Length. ................................................................................................... 30 Figure 3-1. View of SH 288 SB between Reed Road and Airport Boulevard (Viewed from Camera 810 at Reed Road). .................................................................................. 35 Figure 3-2. View of SH 288 NB between Airport Boulevard and Reed Road (Viewed from Camera 811 at Airport Boulevard). ...................................................................... 35 Figure 3-3. Layout of Pneumatic Tubes for Entrance Ramp Followed by Exit Ramp with Auxiliary Lane. ..................................................................................................... 36 Figure 3-4. Layout of Pneumatic Tubes for Entrance Ramp Followed by Exit Ramp without Auxiliary Lane. ..................................................................................................... 37 Figure 3-5. Measurement of Weaving Length (from NCHRP Project 3-75). .............................. 40 Figure 3-6. Weaving Length Definitions (from NCHRP Project 3-75) Adapted to Entrance Ramp followed by Exit Ramp without Auxiliary Lane........................................ 40 Figure 4-1. Desired Speed Distributions for v85 = 60, 80 and 100 mph........................................ 47 Figure 4-2. Simulation Test Beds for Initial Simulations............................................................. 48 Figure 4-3. Post-Processed Speed and Lane-Change Data........................................................... 50 Figure 5-1. Weaving Lengths. ...................................................................................................... 58
- 10. x Figure 5-2. Measured Speed by Short Weaving Length (Long Horizontal Line Represents Average and Shorter Horizontal Lines Represent One Standard Deviation). ...... 58 Figure 5-3. Measured Speed by Base Weaving Length (Long Horizontal Line Represents Average and Shorter Horizontal Lines Represent One Standard Deviation). ...... 59 Figure 5-4. Measured Speed by Long Weaving Length(Long Horizontal Line Represents Average and Shorter Horizontal Lines Represent One Standard Deviation). ...... 59 Figure 5-5. Average Speed by Flow Rate for Sites 1 and 2 (Horizontal Solid Line Represents Speed Limit).......................................................................................................... 60 Figure 5-6. Average Speed by Flow Rate for Sites 3, 4, and 5 (Horizontal Solid Line Represents Speed Limit)....................................................................................... 61 Figure 5-7. Average Speed by Flow Rate for Sites 6 and 7 (Horizontal Solid Line Represents Speed Limit).......................................................................................................... 62 Figure 5-8. Predicted Speed for Range of Weaving Lengths. ...................................................... 73 Figure 5-9. Predicted Speed for Range of Weaving Lengths, Freeway/Ramp Volume, and Weaving Ratio. ..................................................................................................... 75 Figure 5-10. Parameter and Speed Relationship Based on Regression Equation......................... 76 Figure 6-1. Suggested Design Values for Case 1: Entrance Ramp Followed by Exit Ramp. ...... 93 Figure 6-2. Suggested Design Values for Case 2: Exit Ramp Followed by Exit Ramp............... 94 Figure 7-1. Suggested Successive Ramp Dimensions from Research Project 0-5860............... 101
- 11. xi LIST OF TABLES Page Table 2-1. Distance between Successive Ramp Terminals from AASHO 1957 Policy Figure J-5 (9)........................................................................................................... 8 Table 2-2. Distance between Successive Ramp Terminals from AASHO 1965 Policy Figure IX-11 (10).................................................................................................... 9 Table 2-3. Considerations for Ramp Terminal Spacing in the Geometric Design Guide for Canadian Roads (6).............................................................................................. 20 Table 2-4. Guidance for Ramp Terminal Spacing in the Design Manual for Roads and Bridges (32). ......................................................................................................... 21 Table 2-5. Potential Weaving Lengths Based on Deceleration and Acceleration....................... 24 Table 2-6. Decision Sight Distance (2)........................................................................................ 25 Table 2-7. Recommended Decision Sight Distance Values from McGee (40)........................... 26 Table 2-8. Decision Sight Distance Values if Total Times Found in Lerner et al. (44) Study is Used. ....................................................................................................... 26 Table 2-9. Summary of Reported Models in Pilko et al. (48)...................................................... 31 Table 2-10. Desirable and Maximum Units of Information per Freeway Guide Sign Structure (50). ....................................................................................................... 32 Table 3-1. Site Characteristics of Data Collection Locations...................................................... 39 Table 4-1. Features and Characteristics of Candidate Models. ................................................... 46 Table 4-2. Volume, Speed, and Ramp Spacing Combinations for Initial Simulations. .............. 49 Table 4-3. O-D Percentages Used for Initial Simulations. .......................................................... 49 Table 4-4. Raw Data Output........................................................................................................ 50 Table 4-5. Driver Behavior Parameters Considered in Model Calibration. ................................ 52 Table 4-6. Calibrated Driver Behavior Categories and Parameter Sets....................................... 53 Table 4-7. Recommended Parameter Set Variation along Weaving Sections............................. 53 Table 4-8. Simulation Scenario Matrix (Part 1: 60 and 80 mph)................................................. 55 Table 4-9. Simulation Scenario Matrix (Part 2: 100 mph). ......................................................... 56 Table 4-10. Segmentation of Parameter Sets for Different Ramp Spacing................................. 56 Table 5-1. Output for Speeds Using 5-Minute Bin Counter Data and Short Weaving Lengths as a Continuous Variable. ....................................................................... 64 Table 5-2. Weaving Length (L) Groups. ..................................................................................... 65 Table 5-3. Output for Speeds Using 5-Minute Bin Counter Data and Groups of Short Weaving Lengths. ................................................................................................. 66 Table 5-4. Output for Speeds Using 5-Minute Bin Counter Data and Groups of Base Weaving Lengths. ................................................................................................. 67 Table 5-5. Output for Speeds Using 5-Minute Bin Counter Data and Groups of Long Weaving Lengths. ................................................................................................. 68 Table 5-6. Output for Speeds Using 5-Minute Bin Video Data, Short Weaving Length as a Continuous Variable, and Linear Relationship between Speed and Weaving Length. .................................................................................................................. 69 Table 5-7. Output for Speeds Using 5-Minute Bin Video Data, Base Weaving Length as a Continuous Variable, and Linear Relationship between Speed and Weaving Length. .................................................................................................................. 70
- 12. xii Table 5-8. Output for Speeds Using 5-Minute Bin Video Data, Long Weaving Length as a Continuous Variable, and Linear Relationship between Speed and Weaving Length. .................................................................................................................. 70 Table 5-9. Output for Speeds Using 5-Minute Bin Video Data, Short Weaving Length as a Continuous Variable, and Square Root Relationship between Speed and Weaving Length.................................................................................................... 71 Table 5-10. Output for Speeds Using 5-Minute Bin Video Data, Base Weaving Length as a Continuous Variable, and Square Root Relationship between Speed and Weaving Length.................................................................................................... 71 Table 5-11. Output for Speeds Using 5-Minute Bin Video Data, Long Weaving Length as a Continuous Variable, and Square Root Relationship between Speed and Weaving Length.................................................................................................... 72 Table 5-12. Output for Speeds Using 5-Minute Bin Video Data and Long Weaving Length Groups................................................................................................................... 77 Table 5-13. Bivariate Fit of Speeds by Volume at E2................................................................. 78 Table 5-14. Bivariate Fit of Free Flow Speeds by Volume at E2................................................ 80 Table 5-15. Results of Multiple Regression Model Fit Treating Weave Distance as a Continuous Variable. ............................................................................................ 81 Table 5-16. Results of ANACOVA Model Fit Treating Weave Distance as a Discrete Variable and Posted Speed Limit of 60 mph. ....................................................... 82 Table 5-17. Results of ANACOVA Model Fit Treating Weave Distance as a Discrete Variable and Posted Speed Limit of 80 mph. ....................................................... 83 Table 5-18. Results of ANACOVA Model Fit Treating Weave Distance as a Discrete Variable and Posted Speed Limit of 100 mph. ..................................................... 84 Table 5-19. Results of ANACOVA Model Fit Treating Weave Distance as a Discrete Variable and Posted Speed Limit of 60 mph without Outliers............................. 85 Table 5-20. Results of ANACOVA Model Fit Treating Weave Distance as a Discrete Variable and Posted Speed Limit of 80 mph without Outliers............................. 86 Table 5-21. Results of ANACOVA Model Fit Treating Weave Distance as a Discrete Variable and Posted Speed Limit of 100 mph without Outliers........................... 87 Table 6-1. Potential Minimum Deceleration and Acceleration Lengths. .................................... 90 Table 6-2. Potential Decision Sight Distance Values.................................................................. 90 Table 6-3. Suggested Design Values for Case 3: Entrance Ramp Followed by Entrance Ramp or Case 4: Exit Ramp Followed by Entrance Ramp................................... 95
- 13. 1 CHAPTER 1 INTRODUCTION The minimum acceptable distance between ramps is dependent upon the merge, diverge, and weaving operations that take place between ramps as well as distances required for signing. The Texas Roadway Design Manual (RDM) (1) recommends the use of the Highway Capacity Manual (HCM) (2) for analysis of these requirements. The RDM provides a figure to show the minimum distances between ramps for various ramp configurations (reproduced as Figure 1-1 in this report). Key dimensions are: Entrance Ramp Followed by Exit Ramp (see Figure 1-1 for control points) • Minimum weaving length without auxiliary lane = 2000 ft (600 m). • Minimum weaving length with auxiliary lane = 1500 ft (450 m). Other key reference documents that provide information on ramp spacing, such as the 2004 A Policy on Geometric Design of Highways and Streets (commonly known as the Green Book) (3), also encourage the reader to use the Highway Capacity Manual (2) to identify appropriate spacing dimensions. Texas Department of Transportation (TxDOT) Project 0-5544: “Development of High-Speed Roadway Design Criteria and Evaluation of Roadside Safety Features” investigated the effects of design speeds above 80 miles per hour (mph) on various controlling criteria for roadway design. The project also investigated ramp design, specifically the ramp terminal designs for entrance and exit ramps (4). One component of ramp design was ramp spacing. Logically, the ramp spacing should be related to the design speed of the roadway, with more distance required when the design speed is higher. However, the actual design guidance available is not sensitive to the design speed of the roadway. For example, the Texas Roadway Design Manual guidance provides for two minimum ramp spacing lengths: one without an auxiliary lane (2000 ft) and one with the auxiliary lane (1500 ft). These distances apply regardless of design speed. The American Association of State Highway and Transportation Officials’ (AASHTO’s) Green Book similarly provides a minimum ramp spacing of 2000 ft between system and service interchanges and 1600 ft between two service interchanges; but again, these values are independent of design speed. A question to ask is should the design speed of the facility determine the minimum spacing? Intuition indicates that spacing and speed are related. If this is true, guidance on this relationship is important. RESEARCH OBJECTIVES The objectives of this project were to: (a) investigate relationships between weaving length, speed, and overall vehicle operations on Texas freeways and (b) propose updates to current TxDOT guidance on recommended distances between ramps contained in Chapter 3 of the Texas Roadway Design Manual (see Figure 1-1).
- 14. 2 A key relationship for the research to define is the relationship between speed and ramp spacing that provides unconstrained operation. The findings from this research will be used to produce recommendations on minimum weaving lengths that TxDOT could incorporate into the Texas Roadway Design Manual. Freeway design speeds ranging from 60 mph to 100 mph were considered in this research project. EXIT RAMP FOLLOWED BY EXIT RAMP ENTRANCE RAMP FOLLOWED BY EXIT RAMP Minimum weaving length without auxiliary lane 2000 ft [600 m] M h 15 45inimum weaving length wit auxiliary lane 00 ft [ 0 m] Minimum distance 1000 ft [300 m] Desirable control points A-A Minimum control points B-B CASE 2 CASE 1 CASE 3 CASE 4 ENTRANCE RAMP FOLLOWED BY ENTRANCE RAMP EXIT RAMP FOLLOWED BY ENTRANCE RAMP The distance between an exit ramp followed by an entrance ramp will be governed by the geometrics of the connections to the adjacent roadway or connecting roadway. This situation will be encountered only on infrequent occasions and special design treatment will be required. It will usually require an added freeway lane. The distances shown above are generally used but reference should be made to the AASHTO publication "A Policy on Geometric Design of Highways and Streets" and the Highway Capacity Manual for more specific information since operational aspects are influenced by traffic volumes and may require longer distances. ARRANGEMENTS FOR SUCCESSIVE RAMPS Figure 1-1. Arrangements for Successive Ramps from Texas Roadway Design Manual Figure 3-51 (1). RESEARCH APPROACH The research tools utilized in this project include reviews of the literature and previous research projects, field data, and simulation. Simulation allows for flexible modeling of complex weaving environment. Real-world data were collected to calibrate the simulation. The calibrated simulation was used to investigate a variety of different volumes and speeds. These combinations were used to determine the relationship of ramp spacing to design and operating speed on the freeway. In addition to simulation and field data, investigations included a review of the
- 15. 3 literature along with developing logical relationships between driving characteristics and weaving length. REPORT ORGANIZATION This report has seven chapters. Their topics are: Chapter 1 Introduction—includes the objective of the project and the report organization. Chapter 2 Literature Review—includes a summary of previous research relevant to the subject of freeway weaving along with a review of potential methods for calculating the length of an auxiliary lane along with discussion on sign spacing. Chapter 3 Field Studies—includes information on how the speed and volume data were collected in the field. Chapter 4 Simulation—provides a summary of the methodology used to generate the simulation data. Chapter 5 Analyze Results—includes an explanation of the analyses of the field study and simulation data. Chapter 6 Develop Recommendations—includes discussion on the findings from the different procedures investigated by the researchers along with the suggested guidance on minimum ramp spacing lengths. Chapter 7 Summary and Conclusions—provides the summary, key findings from the field and simulation studies, and conclusions of the research.
- 17. 5 CHAPTER 2 LITERATURE REVIEW BACKGROUND Figure 1-1 shows the guidance on ramp spacing included in the Texas Roadway Design Manual. Users of Figure 1-1 are referred to A Policy on Geometric Design of Highways and Streets (Green Book) for additional information. Figure 2-1 illustrates related Green Book guidance. EN-EN or EX-EX EX-EN Turning roadways EN-EX (weaving) Full Freeway Minimum lengths measured between successive ramp terminals CDR or FDR Full Freeway CDR or FDR Service Interchange System Interchange Service Service Interchange toSystem to Service Interchange Full Freeway Full Freeway CDR or FDR CDR or FDR 120 m [400 ft] 300 m [1000 ft] 240 m [800 ft] 150 m [500 ft] 180 m [600 ft] 480 m [1600 ft] 600 m [2000 ft] 480 m [1600 ft] 300 m [1000 ft] 240 m [800 ft] The recommendations are based on operational experience and need for flexibility and adequate signing. They should be checked in accordance with the procedure outlined in the Highway Capacity Manual and the larger of the values is suggested for use. Also a procedure for measuring the length of the weaving section is given in chapter 24 of the 2000 . The "L" distances noted in the figures above are between like points, not necessarily "physical" gores. A minimum distance of 90 m [270 ft] is recommended between the end of the taper for the first on ramp and the theoretical gore for the succeeding on ramp for the EN-EN (similar for EX-EN). Highway Capacity Manual NOTES: FDR - Freeway Distributor Road CDR - Collector Distributor Road EN - Entrance EX - Exit L L L* *Not Applicable to Cloverleaf Loop Ramps L Figure 2-1. Recommended Minimum Ramp Terminal Spacing, AASHTO 2004 Policy Exhibit 10-68 (2). The dimensions in Figure 1-1 and Figure 2-1 are experienced-based and have “proven to be appropriate to accommodate ramp exit or entrance geometric criteria and for driver operational needs in spreading conflict or decision points. This spacing also results in smoother freeway operations with more uniform operating speed” (5). The recommended dimensions are not speed-dependent. Geometric design guidance has traditionally existed for speeds ranging from 15 to 80 mph. Potential values for geometric elements designed for 85 to 100 mph speeds were included in a
- 18. 6 recently completed research project conducted for TxDOT (4). Design elements that were addressed in the final report included: • sight distance, • horizontal and vertical alignment, • cross section, • roadside design and hardware, and • interchange ramps. Recommendations have been incorporated into Chapter 8 of the RDM, “Mobility Corridor (5R) Design Criteria” (1). Researchers noted that current guidance on ramp spacing was not speed- dependent even though intuition and results of current analysis techniques indicate that spacing and speed are related (4). This chapter provides a review of published criteria and existing knowledge on relationships between interchange ramp spacing, speed, and overall freeway operations. PHYSICAL RELATIONSHIPS BETWEEN INTERCHANGE FEATURES Ramp spacing, defined for the remainder of this project as the longitudinal distance between like points on successive interchange ramps, is interrelated to several design dimensions including the following: • interchange spacing (crossroad-to-crossroad), • longitudinal distance from crossroad to entrance and exit ramp gores, • locations and radii of controlling ramp curves on the entrance and exit ramps, and • ramp type. Leisch (2005) provides a logical approach to illustrating these relationships (5) (see Figure 2-2). The figure is not directly applicable to all conditions, especially in Texas due to state-specific and unique characteristics (e.g., an extensive freeway frontage road system). However, it is a sensible starting point for later departure. 4300-5300 ft 1600-2000 ft 300- 500 ft 400-800 ft1000 ft 1000 ft To Cross Road Merging Tip Gore (Nose) Diverging Tip Gore (Nose) To Cross Road Figure 2-2. Relationship between Longitudinal Interchange and Ramp Dimensions (5).
- 19. 7 The profile elevation of the freeway mainline and ramp match at the gore. The crossroad-to-gore dimension is an estimate to obtain the elevation change between freeway and crossroad (e.g., an elevation change of 22 ft between freeway and crossroad profiles that takes place over 1000 ft results in an average 2.2 percent grade on the ramp). It is also a reasonable dimension for storage of queued vehicles on the exit ramp or for ramp metered storage on the entrance ramp. The distance from the gore to the merging or diverging tips is related to the type of ramp design (i.e., parallel or taper) and the location and radius of the controlling curve on the ramp. The distance between merging and diverging tips shown in Figure 2-2 is based on existing guidance in the Green Book (see Figure 2-1). Similar guidance exists in the RDM (see Figure 1-1) and is the focus of this research. Acceleration and deceleration lanes may be oriented to span across all or parts of the labeled dimensions (i.e., crossroad-to-gore, gore-to-tip, and tip-to-tip). The sum of these dimensions represents a crossroad-to-crossroad interchange spacing, in this case, an approximate 1-mile minimum recommended by many state departments of transportation (DOTs) for urban areas. Several conditions may influence the cited dimensions, including: • ramp sequence, • presence and type of frontage roads, • number of ramp lanes, • additional vehicle storage requirements at entrance or exit, • channelized or braided ramps, and • collector-distributor roads. Relationships between interchange-related dimensions are important considerations in developing ramp spacing recommendations. For example, the recommended spacing between successive entrance ramps in the Geometric Design Guide for Canadian Roads is based on the distance required for vehicles from the first entrance ramp to accelerate and merge with mainline traffic (6). Therefore, acceleration lane presence and length may ultimately influence recommended ramp spacing. A HISTORIC LOOK AT RAMP SPACING DESIGN DIMENSIONS Ramp spacing has long been recognized and addressed in geometric design policies of AASHO (American Association of State Highway Officials), which is the former name of AASHTO (American Association of State Highway and Transportation Officials). One of the earliest AASHO publications on geometric design policy, the 1944 edition entitled A Policy on Grade Separations for Intersecting Highways, addressed the issue for the first time (7). This 1944 policy did not suggest any dimensions for ramp spacing; it introduced different ramp sequences and included several examples of ramp combinations. The use of an auxiliary lane to connect an entrance ramp followed by an exit ramp was also suggested in this early AASHO geometric design policy. In the subsequent AASHO publications, more specific recommendations on ramp spacing were developed. The 1954 AASHO policy, A Policy on Geometric Design of Rural Highways (8), recommended conducting weaving analyses using the procedures included in the 1950 edition of the Highway Capacity Manual to determine the distance between an entrance ramp and an exit
- 20. 8 ramp. The next AASHO policy, adopted in 1957 entitled A Policy on Arterial Highways in Urban Areas (9), provided more detailed guidelines on the distance between successive ramp terminals. This edition of AASHO policy suggested that the consecutive ramp terminals should be properly spaced and the ramp maneuver areas should be separated from one another to avoid multiple and complex maneuvers. The policy stated that the required spacing distance between ramps could not be precisely determined. It varied with different conditions such as sufficient sight distance and adequate signing and knowledge of the highway by most drivers through repeat use. The most important improvement of this 1957 edition from the preceding versions was diagrams of various ramp combinations with minimum and desirable spacing distances between ramp terminals. Table 2-1 lists the distances provided in the 1957 AASHO policy. The numbers given as minimum distances between ramp terminals were based on a combined decision and maneuver time of 5 to 6 seconds for operation at average running speeds and the values of desirable spacing lengths were given on the basis of 7 seconds of combined decision and maneuver time and operation at design speed. Table 2-1. Distance between Successive Ramp Terminals from AASHO 1957 Policy Figure J-5 (9). Design speed (mph) 30 or less 40 to 50 60 or more Average running speed (mph) 20 to 25 35 to 40 45 to 50 Distance (ft) Minimum 175 300 400 Desirable 300 450 600 The next edition of AASHO policy on geometric design published in 1965 entitled A Policy on Geometric Design of Rural Highways (10) provided similar diagrams. Minimum and desirable distances between ramp terminals suggested in the 1965 AASHO policy were larger than those included in the preceding edition because these values were computed based on longer decision and maneuver time. Time used for calculation of these recommended ramp spacing distances was 5 to 10 seconds instead of 5 to 6 seconds, or 7 seconds as in the 1957 edition. Average running speeds used in this 1965 AASHO policy were also higher than those included in the previous document and a new category of 80 mph design speed was also added to the table. This publication also noted that in most cases, the required lengths of speed-change lanes should be the governing values and greater values than those shown in the table should be preferred, allowing drivers to have adequate signing distances (and time). The minimum for sufficient signing distances were suggested to be 1000 ft for consecutive exits on a freeway and 600 ft for a freeway exit followed by an exit on a collector-distributor road. Figure 2-3 and Table 2-2 show the aforementioned diagrams and suggested spacing distances included in the 1965 AASHO policy.
- 21. 9 Table 2-2. Distance between Successive Ramp Terminals from AASHO 1965 Policy Figure IX-11 (10). Design speed (mph) 30 or less 40 to 50 60 to 70 80 Average running speed (mph) 23 to 28 36 to 44 53 to 58 64 Distance (ft) Minimum 200 400 500 900 Desirable 400 700 900 1200 Figure 2-3. Arrangements for Successive Ramp Terminals, AASHO 1965 Policy Figure IX-11 (10).
- 22. 10 Unlike the AASHO policies published in 1957 and 1965, the new AASHTO policy entitled A Policy on Design of Urban Highways and Arterial Streets published in 1973 (also known as the 1973 Red Book) (11), did not retain the ramp terminal arrangement diagrams from the previous editions. This document provided suggestions for minimum distances between successive exit ramp terminals of 1000 ft and 800 ft for the spacing lengths between exits on a freeway, and between an exit on a freeway and an exit on a collector-distributor road, respectively. Figure 2-4 illustrates these suggestions. Figure 2-4. Successive Exit Terminals, AASHTO 1973 Policy Figure J-30 (11). The 1973 Red Book (11) also stated that the distance between an entrance ramp followed by an exit ramp should be governed by weaving requirements and it should not be less than 1000 ft. Where an exit ramp is followed by an entrance ramp, the distance between them should be “reasonable” and should be at least 500 ft. This document also suggested connecting the speed- change lanes to provide a continuous lane where the distance between the end of entrance terminal taper and beginning of exit terminal taper was less than about 1500 to 2000 ft. Addressing the same issue, in a paper by J. E. Leisch, presented at the Region 2 AASHTO Operating Committee on Design in 1975 entitled “Application of Human Factors in Highway Design” (12), a table with diagrams and recommended minimum distances between ramp terminals for various ramp terminal combinations were introduced. Figure 2-5 shows these diagrams and recommended values. These diagrams, and the “absolute minimum values” introduced by Leisch were later adopted and included in the 1984 AASHTO policy (see Figure 2-6) (13) and have remained in the succeeding editions of the AASHTO Green Book published in 1990 (14), 1994 (15), and 2001 (16), as well as the latest and current edition published in 2004 (3). Metric measurements with equivalent values were used in the 1994 edition of the AASHTO Green Book (15) instead of U.S. standard units. Both measurement systems were included in 2001 and 2004 Green Books but the recommendations that appeared in the 1984 AASHTO Green Book have been relatively unchanged. The 1984 AASHTO policy also suggested connecting the speed-change lanes to provide an auxiliary lane when the distance between noses of an entrance ramp followed by an exit ramp was less than 1500 ft. This recommendation has also remained in the later editions, including the latest one, the 2004 edition of AASHTO Green Book (3) (see Figure 2-1).
- 23. 11 Figure 2-5. Recommended Minimum Ramp Terminal Spacing, Leisch, 1975 (12). Figure 2-6. Recommended Minimum Ramp Terminal Spacing, 1984 AASHTO Green Book Figure X-67 (13).
- 24. 12 OPERATIONAL ANALYSIS OF INTERCHANGE RAMPS AND RAMP SPACING Figure 1-1 and Figure 2-1 (and their predecessors) are guidelines, intended for use in planning and conceptual design. Detailed operational analyses are recommended during final design (5). Both the Green Book (3) and RDM (1) reference the Highway Capacity Manual (2) in this regard. Highway Capacity Manual The Highway Capacity Manual consists of techniques for estimating capacity and quality of service for: • rural highways, • urban streets, • freeways and interchanges, • intersections, and • transit, pedestrian, and bicycle facilities. The first edition of the HCM was published by the Bureau of Public Roads (BPR) in 1950 (17). Subsequent editions were developed and revised by the Highway Research Board (HRB) (18) and the Transportation Research Board (TRB) (2, 19, 20, 21). The TRB Committee on Highway Capacity and Quality of Service oversees current activities related to the HCM. The committee reviews and approves (for inclusion in the HCM) research results with a goal of providing practitioners a set of consistent and methodologically sound analysis techniques for a range of facility types. The most recent version of the HCM is the 2000 edition (2); research and planning for a 2010 edition is currently under way. Methods most relevant to this research are those for analysis of freeway weaving and ramps and ramp junctions. Freeway Weaving Weaving is defined as “the crossing of two or more traffic streams traveling in the same general direction along a significant length of highway without the aid of traffic control devices” (2). Weaving may be present at several geometric configurations; the configuration most relevant to this research is when an entrance ramp of one interchange is followed by an exit ramp of an adjacent, downstream interchange. The HCM further narrows the scope of weaving by including only successive ramps that are connected with an auxiliary lane. The RDM and Green Book do not make this exact distinction, but RDM spacing recommendations for the entry-exit sequence are dependent on auxiliary lane presence (see Figure 1-1 and Figure 2-1). Weaving is also present within single interchanges with successive loop ramps (e.g., a cloverleaf interchange). However, guidelines in Figure 1-1 and Figure 2-1 are not applicable to this case. As the length of a freeway weaving segment increases, lane changes from entrance and exit maneuvers are spread across additional space and operational characteristics become more like those of a basic freeway segment. The maximum length of a weaving segment when it should be treated as a weaving section rather than an isolated entrance ramp followed by an exit ramp varies. Methods of the HCM generally apply to weaving segments up to 2500 ft in length. Other
- 25. 13 procedures are applicable up to 8000 ft (depending on total weaving volume) (22). A general rule-of-thumb, first offered in Highway Research Board Bulletin 167 (23), is that a weaving segment should be treated as weaving if the number of lane changes per unit length is greater than on similar sections of freeway outside the influence of entrance or exit ramps. Sections that do not meet this criterion are considered “out of the realm of weaving” (e.g., see [22]) and can be treated as three distinct features: (a) an entrance ramp, (b) a basic freeway segment, and (c) an exit ramp. Since the first edition of the HCM, analytical methods, discussions, and supporting data have pointed toward two basic weaving premises: • Vehicles that weave and vehicles that do not weave “separate themselves from each other (in practice) almost as positively as they do in theory” (17). • As the number of weaving vehicles increases and/or the length available for weaving decreases, the weaving maneuver becomes more difficult and drivers will decrease speeds while they search for available gaps and make the weaving maneuver. Figure 2-7 illustrates these operating characteristics, which is a 1957 update to an original figure provided in the 1950 HCM. In general when an outer flow exceeds 600 passenger cars per hour the section should be wide enough to provide a separate lane for these movements. Figure 2-7. Operating Characteristics of Weaving Sections (23).
- 26. 14 The HCM methodology for analyzing weaving segments has been updated on several occasions as additional field data and evaluations of prediction capabilities became available. A modern and comprehensive database of sufficient size for a complete calibration of the weaving methodology does not exist; the Committee on Highway Capacity and Quality of Service has incorporated necessary judgments to compensate for the data deficiencies (24). The product (to date) is a useable analysis technique with results that are generally consistent with intuitive relationships between weaving length, weaving volume, and speed expressed by the following model (2): ⎥ ⎦ ⎤ ⎢ ⎣ ⎡ + − += i i W FFS S 1 10 15 (1) ( ) ( ) d cb i L NvVRa W + = 1 (2) where: iS = average speed of weaving (i = w) and non-weaving (i = nw) vehicle (mph); FFS = average free-flow speed of freeway segments entering and leaving the weaving segment (mph); iW = weaving intensity factor for weaving (i = w) and non-weaving (i = nw) flows; VR = volume ratio, the ratio of weaving flow rate to total flow rate in the weaving segment; v= total flow rate in weaving segment (passenger car/hour, pc/h); N = total number of lanes in weaving segment; L = length of weaving segment (ft); and dcba ,,, = calibration constants. Figure 2-8 and Figure 2-9 illustrate examples of these relationships. Both figures were developed using the methodology in HCM 2000 (2) for Type A weaving segments. A large number of volume-weaving length combinations were tested within the boundaries shown on the graph axes. Free-flow freeway mainline speeds of 60 mph and 80 mph were assumed. The weaving segments consisted of two through lanes plus an auxiliary lane connecting single-lane entrance and exit ramps. The figures show that for a given weaving length, speeds of weaving and non- weaving vehicles decrease as the weaving volume increases. Similarly, speeds increase as weaving length increases for a given weaving volume. The speed differential between a weaving segment and its approach roadway has been suggested as a possible performance measure for operational quality (2). Information presented in the format of Figure 2-8 and Figure 2-9 would be useful in this regard. A separate procedure for design and analysis of weaving sections was developed by Jack E. Leisch in the late 1970s, independent from parallel efforts to develop materials for what would be included in the 1985 edition of the HCM . Information from several sources was used by Leisch (18, 25, 26), along with analytical modeling and rational formulations based on his considerable experience designing and analyzing weaving areas. The procedure was presented in a user-friendly format and is still referenced by several state DOTs (e.g., see [27]). Figure 2-10 illustrates Leisch’s technique for analysis of one-sided weaving configurations. A recalibrated
- 27. 15 version of the nomographs using level of service density thresholds from HCM 2000 is provided in the Freeway and Interchange Geometric Design Handbook (5). Average Speed of Weaving and Non-Weaving Vehicles on 60 mph Freeway (N = 3) 0 200 400 600 800 1000 1200 1400 1600 1800 2000 250 500 750 1000 1250 1500 1750 2000 2250 2500 Weaving Length (feet) TotalWeavingFlowRate(pcph) Sw = 60mph Snw = 60mph Sw = 50mph Snw = 50mph Sw = 40mph Snw = 40mph Sw = 30mph Snw = 30mph Figure 2-8. Relationships between Weaving Length, Weaving Flow Rate, and Speed on a 55 mph Freeway. Average Speed of Weaving and Non-Weaving Vehicles on 80 mph Freeway (N = 3) 0 200 400 600 800 1000 1200 1400 1600 1800 2000 250 500 750 1000 1250 1500 1750 2000 2250 2500 Weaving Length (feet) TotalWeavingFlowRate(pcph) Sw = 80mph Snw = 80mph Sw = 70mph Snw = 70mph Sw = 60mph Snw = 60mph Sw = 50mph Snw = 50mph Sw = 40mph Snw = 40mph Figure 2-9. Relationships between Weaving Length, Weaving Flow Rate, and Speed on an 75 mph Freeway.
- 28. 16 2345 LEVELOF SERVICE N=2b W =2 SM ALLER W EAVIN G VO LU M E -PC PH CAPACITY 2000 B C E D 1900 1250 1550 1000 700 2345 LEVELOF SERVICE N=3b CAPACITY 2000 A B C E D 1900 1350 1600 1100 2345 LEVELOF SERVICE N=4b 2000 A B C E D 1900 1400 1650 1200 850 NomographforDesignandAnalysisofWeavingSections-On-SidedConfigurations 0 2000 4000 6000 8000 10,000 V=TOTALVOLUME-PCPH 400 800 1200 1600 Analysis One-Sided forDesignandOperationof WeavingSections Nomograph N L }WW1+2 Fwy.Fwy. EXITENTR. Seechartbelow fordefinitionsof terms Nb 12'2' V- 1000 1000 20003000 3000 40005000600070008000 2000 L=LengthofWeavingSection-Feet EquivalentPassengerCarsPerHour-PCPH K VALUES W EAVIN G IN TENSITY FAC TO R 1.0 2.0 3.0 1.5 2.5 W+W= 12TOTALWEAVINGVOLUME LEVEL O F SERVICE A B C E D TURNINGLINEFORK 25-30MPH*MAX.FORE 30MPH* MAX.FORD 40MPH* MAX.FOR C 45 M PH * M AX.FO R B >50MPH* A MAX.FOR OUT OF REALM OF WEAVING NOTE: Lane-BalancedWeavingSections ImbLane-alancedWeavingSections *AverageRunningSpeed,WeavingTraffic N=NumberofLanesinWeavingSection 66 MAX.FORE MAX.FOR C MAX.FOR A SV=SERVICEVOLUME PCPH PERLANE MAX.FORE MAX.FOR C M AX.FOR A SV=SERVICEVOLUME PCPH PERLANE SV=SERVICEVOLUME PCPH PERLANE CAPACITY MAX.FOR C M AX.FOR A MAX.FORE 800 Figure2-10.NomographforDesignandAnalysisofWeavingSections–One-SidedConfigurations(22). NomographforDesignandAnalysisofWeavingSections–One-SidedConfigurations
- 29. 17 Ramps and Ramp Junctions Ramp-freeway junctions take two general forms: (a) merge areas where vehicles from an entrance ramp enter freeway mainline traffic to form a single traffic stream and (b) diverge areas where the freeway traffic stream separates into two traffic streams at an exit ramp. Merge and diverge areas are places of potential operational turbulence; vehicles wishing to merge or diverge compete for space with through moving vehicles. The amount of turbulence generally depends on: • freeway and ramp volumes, • distribution of traffic across available lanes (i.e., lane usage), • gap acceptance behavior, and • speed differentials between through and merging or diverging vehicles. Increased turbulence coincides with higher traffic densities and slower speeds. Capacities of merge and diverge areas are not influenced by the intensity of traffic turbulence, but by capacities of the roadways themselves. The capacity of a merge area is normally limited by the capacity of the downstream freeway segment (2). The capacity of a diverge area may be limited by: • the freeway capacity upstream or downstream of the diverge, • the capacity of the ramp proper, or • the capacity of the ramp-crossroad terminal (2). Discussions and data in early HCM editions primarily focused on ramp capacities and lane usage (17, 18, 19). Analysis techniques in the HCM from 1994 onward are based on results of National Cooperative Highway Research Program (NCHRP) Project 3-37. The current techniques account for influences of adjacent upstream and downstream ramps on vehicle density for six-lane freeway cross sections (2). Effects are seen through increased lane usage on the side of the freeway with the ramp (normally the right-hand side). The magnitude of the effect depends on the distance to the adjacent ramps (i.e., ramp spacing); the effect does not appear as elastic to overall freeway operations as weaving length. The presence and length of an acceleration lane influence lane usage, density, and speed estimates at merge areas in the HCM 2000 methodology. Presence and length of a deceleration lane influence density estimates in diverge areas (2). Microscopic Simulation Microscopic simulation models are increasingly becoming operational analysis alternatives, especially for complex highway networks and geometric conditions including closely spaced interchange ramps (5). While the HCM is macroscopic, based primarily on relationships between average measures of speed, density, and flow, microscopic simulation models are based on vehicle-to-vehicle car-following phenomena and individual driver and vehicle characteristics. The models are still in relatively early stages of development and use; their algorithms are commonly evaluated on whether the simulated results match user-intuition and conform to relationships consistent with those in the HCM (e.g., see [24]).
- 30. 18 Microscopic simulation has been applied to modeling weaving, merge, and diverge areas (e.g., 28, 29). The most important step during the application of microscopic simulation is calibration, where the ability of the simulation model to replicate real-world conditions is tested. Roess and Ulerio provided the following recommendations for a definitive study on weaving sections that uses a combination of field data and simulation (24): • Collect enough data to be able to calibrate and test a simulator over a range of configurations, lengths, widths, flow levels, and proportions of weaving vehicles. • Calibrate an existing simulator or develop and calibrate a new simulator to more accurately duplicate lane-changing behavior and other microscopic characteristics of weaving operations within weaving areas. • Use a simulator to produce a wide range of results for all important variables to supplement field data and for use in calibrating a new, more comprehensive procedure (than in the HCM). NCHRP Project 3-75 A new model to analyze performance in freeway weaving sections, developed as part of NCHRP Project 3-75, is currently being evaluated by the TRB Committee on Highway Capacity and Quality of Service for possible inclusion in the 2010 HCM (30, 31). The proposed model has one notable difference from the HCM 2000 methods that is of particular importance to this research project: “Speed-prediction algorithms are not separated by weaving configuration (i.e., Type A, B or C) or by relative operational quality of weaving and non-weaving vehicles (i.e., constrained or unconstrained). There is a single algorithm for predicting weaving speeds and a single algorithm for predicting non-weaving speeds, both of which require the output of new algorithms that predict lane- changing activity. The lane changing algorithm is intended to capture the impact of weaving configuration and type of operations on resulting speeds and densities.” NCHRP Project 3-75 researchers also revisited and redefined the measurement of weaving length, historically defined as “the length from a point at the merge gore where the right edge of the freeway shoulder lane and the left edge of the merging lane(s) are 2 ft apart to a point at the diverge gore where the two edges are 12 ft apart” (2). Chapter 3 discusses their proposed weaving length measurements: short length, base length, and long length. Within their methodology they discussed the concept of “maximum length” of a weaving section. Maximum length is the length at which weaving turbulence no longer has an impact on the operations within the section or, alternatively, on the capacity of the weaving section. They noted that the definition selected will impact the value. Weaving turbulence can have an impact on operations (i.e., weaving and non-weaving vehicle speeds) for distances far in excess of those defined by when the capacity of the section is no longer affected by weaving. The methodology proposed for the 2010 HCM uses the latter definition because if longer lengths were treated as weaving sections, the methodology would produce a capacity for the weaving section that exceeds that of a basic freeway section with the same number of lanes and conditions. The
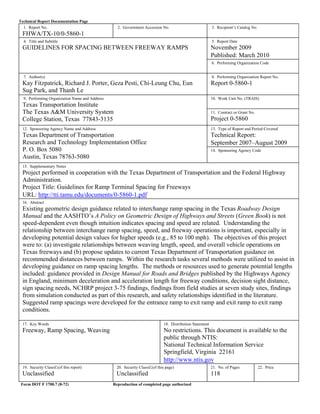
- 31. 19 following equation is to be used to determine the length at which the capacity of the weaving section is the same as a basic freeway section with the same number of lanes: Lmax = [5728(1+VR)1.6]-[1566*NWL] (3) where: Lmax = the maximum weaving section length (using the short-length definition); VR = volume ratio: VR = vW/v; v = total demand flow rate in the weaving section (pc/h); vW = weaving demand flow rate in the weaving section (pc/h): vW = vRF + vFR; vRF = ramp-to-freeway demand flow rate in the weaving section (pc/h); vFR = freeway-to-ramp demand flow in the weaving section (pc/h); and NWL = number of lanes from which a weaving maneuver may be made with one or no lane changes (for a section with an auxiliary lane, NWL = 2). The equation was derived by setting the per-lane capacity of a weaving section (with the prevailing conditions that exist) equal to the per-lane capacity of a basic freeway section (with the same prevailing conditions). The equation is not a function of the design speed of the facility; therefore, it can be implied that the proposed procedure assumes that design speed does not impact the operations of a weaving area. The equation is sensitive to the volume ratio, as shown in Figure 2-11. As VR increases the impact of weaving turbulence would extend further. If the weaving demand is about 30 percent of the total demand, a length of approximately 5600 ft would be needed to have all the weaving influenced area be between the two ramps. 0.0 0.2 0.4 0.6 0.8 1.0 2,000 4,000 6,000 8,000 10,000 VolumeRatio Maximum Weaving Length (ft) Figure 2-11. Maximum Weaving Length for Volume Ratio Based on Proposed Equation for the 2010 HCM.
- 32. 20 INTERNATIONAL GUIDANCE Geometric design guidance documents from Canada and England include speed-dependent ramp spacing criteria (6, 32). Personal correspondence with design and research colleagues from both countries indicated the guidance has been around for some time; its origin and the existence of supporting research results were unknown. General freeway, interchange, and ramp design considerations and principles in Canada and England are similar to United States practice. A review of their procedures is therefore well within this project scope. The Transportation Association of Canada (TAC) bases its ramp terminal spacing guidance contained in the Geometric Design Guide for Canadian Roads on the principle that drivers must be able to “make decisions in sufficient time to make safe maneuvers” (6). Table 2-3 summarizes specific considerations for alternative scenarios. Accompanying design values are illustrated in Figure 2-12. Values are not provided for successive entrance ramps; however, consideration of acceleration and merging indicate that spacing will generally increase as mainline design speeds increase due to the presence of longer acceleration lanes. Weaving lengths of 2600 to 3300 ft for freeway-to-arterial interchanges and 1800 to 2300 ft for arterial-to-arterial interchanges are generally recommended for efficient operations (6). However, the need for shorter lengths imposed by site-specific constraints is recognized. Weaving lengths longer than 3300 ft are considered “out of the realm of weaving” (6). Ramp spacing guidance contained in the Design Manual for Roads and Bridges published by the Highways Agency in England is based on effective signing and signaling and the specific characteristics of different roadway types (32). It is summarized in Table 2-4 and Figure 2-13. Recommended spacing is dependent only on design speed for all ramp sequence combinations except an entrance followed by exit (i.e., weaving). Recommended weaving lengths range from 3300 to 6600 ft for rural roadways and are speed and volume dependent for urban roadways. The maximum possible weaving length, interpreted as meaning the boundary between weaving sections and sections out of the realm of weaving, is 9800 ft on rural motorways and 6600 ft on all-purpose rural roads. Table 2-3. Considerations for Ramp Terminal Spacing in the Geometric Design Guide for Canadian Roads (6). Ramp Sequence Spacing Consideration Exit followed by exit Provision of adequate signing Exit followed by entrance Allow vehicle on a through lane to prepare for the merge ahead after passing the exit nose Entrance followed by entrance Required length for acceleration and merging Entrance followed by exit HCM weaving analysis
- 33. 21 L1 Successive Exits on a Freeway Successive Exits on a Ramp L2 Exit Followed by Entrance L3 Entrance ExitFollowed by Successive Entrances L4 L5 L5 L5 Successive Entrances on Opposite Sides (applicable to express- collector systems) L6 Spacing (ft) 1 50 980 660 490 55 1070 740 490 60 1150 820 570 70 1230 1230 570 75 1230 980 660 80 1390 1070 660 Based on weaving requirements Subsection 2.1.7.3 Sufficient to allow for acceleration and merging length before second entrance 60% of L5 1 Minimum lengths from bullnose to bullnose Main line design speed (mph) Figure 2-12. Ramp Terminal Spacing (6) (Figure Converted to U.S. Customary Units). Table 2-4. Guidance for Ramp Terminal Spacing in the Design Manual for Roads and Bridges (32). Ramp Sequence Recommended Spacing and Weaving Length Exit followed by exit 19.8*V ft (with V in mph) Exit followed by entrance 19.8*V ft (with V in mph) Entrance followed by entrance 19.8*V ft (with V in mph) Entrance followed by exit Rural motorways: 6600 ft Rural all-purpose roads: 3300 ft Urban roads: greater of two lengths from Figure 2-13
- 34. 22 Minimum Length of Weaving Section - Feet TotalWeavingFlow(QW1+QW2)Vph 3400 3400 3400 3400 3400 3400 3400 3400 3400 3400 3400 3400 3400 3400 3400 3400 3400 0 660 1320 1980 2640 3300 D is the hourly flow from para 3.3 and V the design speed (mph) of the mainline upstream of the weaving section D/V =48 32 24 D/V = 21 AbsoluteMinimum WeavingLength(ft) Design Speed - mph 980 660 330 To determine the minium length of weaving section (Lmin) for insertion within the formula of Paragraph 2.71 1. For known total weaving flow and chosen D/V value read off the minimum length of weaving section from the graph above 2. Check the absolute minimum weaving length allowable for chosen design speed from the graph on the left 3. Select the greater of the two lengths 30 40 45 50 55 60 Figure 2-13. Weaving Length Diagram for Urban Roads (32) (Figure Converted to U.S. Customary Units).
- 35. 23 MINIMUM LENGTH FROM DECELERATION AND ACCELERATION Exit ramp design is based on the assumption that vehicles exiting from a freeway have the space to decelerate to the ramp’s limiting design speed feature (typically a horizontal curve) after clearing the through-traffic lane. The length provided between the freeway departure point and the ramp’s limiting design speed feature should be at least as great as the distance needed to accomplish the appropriate deceleration, which is governed by the speed of traffic on the through lane and the speed to be attained on the ramp. The deceleration length values in the 2004 Green Book are based upon assumed running speed for the limited-access highway and the ramp along with deceleration rates based on 1930s studies. The need to update the speed assumption for the highway and the ramp curve is clear, although determining appropriate deceleration rates is not as simple (4, 33). Previous research demonstrates that drivers select speeds at or above the design speed on horizontal curves, rather than the much lower average running speed that had been previously assumed for several design elements including exit ramps. For entrance ramp design, the AASHTO Green Book (3) notes that drivers entering a highway from a turning roadway accelerate until the desired highway speed is reached. Because the change in speed is usually substantial, provision is made for accomplishing acceleration on an auxiliary lane, called an acceleration lane, to minimize interference with through traffic and to reduce crash potential. The 2004 Green Book (3) contains acceleration lane lengths. The procedure identified to reproduce these values used assumed running speed for the limited-access highway and the ramp along with acceleration rates from 1930s studies (4, 34). Potential acceleration length values were then calculated by (a) updating the assumptions within the identified procedure and (b) using spreadsheets that can generate second-to-second acceleration. A recent TxDOT study (4) suggested lengths that are based upon more realistic speed assumptions and more current acceleration lengths along with findings from recent research. The intent of an auxiliary weaving area is to provide room for drivers to weave onto or off of the freeway. In theory, the length required to accelerate (for an entrance) or decelerate (for an exit) occurs on the ramp and not in the auxiliary weaving area. A method of determining the desired length of the auxiliary weaving area, however, could be the length needed for a driver to come to a complete stop at the start of the auxiliary area followed by the length needed for a driver to accelerate from the complete stop to the freeway speed. Table 2-5 lists potential distances along with the assumptions used to generate the values. Potential acceleration lengths and deceleration lengths were calculated as part of the TxDOT 0-5544 project for speeds up to 100 mph (4). These lengths could be used as the deceleration and acceleration values. As documented in the 0-5544 report (4) and elsewhere (33, 34), there are concerns with the methodology and assumptions in the existing acceleration and deceleration length calculations. Table 2-5 also lists the potential distances if the assumptions in the acceleration and deceleration procedures are updated. For deceleration two sets of assumptions were used. The first set assumed the initial speed is the freeway design speed rather than the lower running speed and the deceleration rates were extrapolated into the higher design speeds. The second set of assumptions assumed a constant deceleration rate for the entire deceleration equal to the deceleration rate
- 36. 24 used in stopping sight distance. For acceleration, the revised assumptions included using the design speed of the freeway for the final speed and using an acceleration rate of 3.5 ft/sec2 based on previous research (34). When using design speed for the freeway speed (rather than the lower assumed running speed) and deceleration and acceleration values identified from research, the rounded suggested weaving length would be: • 60 mph = 1500 ft, • 70 mph = 2000 ft, • 80 mph = 2600 ft, • 90 mph = 3300 ft, and • 100 mph = 4100 ft. Table 2-5. Potential Weaving Lengths Based on Deceleration and Acceleration. Variable Lengths (ft) for Freeway Design Speed (mph) of 60 70 80 90 100 Extrapolating existing Green Book values: Values from extrapolating criteria in the Green Book (see TxDOT 0-5544-1 (4) report) Speed = running speed Deceleration without brakes and with brakes = extrapolated from Green Book values (without brakes range from 4.0 to 6.2 ft/sec2 , with brakes range from 7.3 to 8.8 ft/sec2 ) Acceleration = value used in Green Book for 70 mph also assumed for 80 to 100 mph (1.9 ft/sec2 ) Deceleration 530 615 605 695 900 Acceleration 1199 1597 1979 2403 3372 Weaving Length 1729 2212 2584 3098 4272 Updating freeway speed assumption: Speed = design speed Deceleration without brakes and with brakes = extrapolated from Green Book values (without brakes range from 4.0 to 6.2 ft/sec2 , with brakes range from 7.3 to 8.8 ft/sec2 ) Acceleration = value used in Green Book for 70 mph also assumed for 80 to 100 mph (1.9 ft/sec2 ) Deceleration 643 836 1042 1259 1485 Acceleration 1955 2786 3639 4606 5687 Weaving Length 2598 3622 4681 5865 7172 Updating freeway speed and deceleration/acceleration rate assumptions: Speed = design speed Deceleration with brakes = values assumed for stopping sight distance (11.2 ft/sec2 ) (3, 35) Acceleration = value identified in Canadian study (3.5 ft/sec2 ) (36) Deceleration 348 473 617 781 965 Acceleration 1111 1512 1976 2501 3087 Weaving Length 1459 1985 2593 3282 4052
- 37. 25 DECISION SIGHT DISTANCE Decision sight distance, as defined by the AASHTO Green Book (2), is “the distance required for a driver to detect an unexpected or otherwise difficult-to-perceive information source or hazard in a roadway environment that may be visually cluttered, recognize the hazard or its threat potential, select an appropriate speed and path, and initiate and complete the required maneuver safely and efficiently.” According to AASHTO the decision sight distance requires about 6 to 10 seconds to detect and understand the situation and 4 to 4.5 seconds to perform the appropriate maneuver. Table 2-6 lists the suggested decision sight distance resulting if one assumes the 11.2 to 14.5 seconds is applicable for the higher design speeds. These distances could serve as the minimum weaving lengths. Table 2-6. Decision Sight Distance (2). Speed (mph) Time (sec) Decision Sight Distance Calculated Distance (ft) Distance in Green Book Exhibit 3-3 for Avoidance Maneuver C and E (ft) 60 70 80 90 100 11.2 to 14.5 11.2 to 14.5 11.2 to 14.5 11.2 to 14.5 11.2 to 14.5 988 to 1279 1152 to 1492 1317 to 1705 1482 to 1918 1646 to 2132 990 to 1280 1105 to 1445 1260 to 1650 Not provided Not provided Baker and Stebbins (37) originally developed a model for decision sight distance to quantify sufficient distances based on the principle of hazard avoidance. This hazard-avoidance model was later modified by Leisch (38) and Pfefer (39). In a study published in 1979, McGee expanded this concept and conducted field tests to validate the model (40). In his study, McGee outlined a sequence of events to avoid a hazardous situation, starting from sighting the hazard, detection and then recognition of the hazard, to decision, response to the hazard, and completion of required maneuver. A field validation procedure was designed and conducted with 19 test subjects driving through a course and responding to certain geometrics. The study results reinforced the analytical assessments of the preceding studies. However, the study also revealed that not all previously recommended values were supported by the field test results. Based on the field test, a table of decision sight distance values was recommended, as shown in Table 2-7. In the McGee study, the use of decision sight distance was recommended in highway design in general, especially at locations with special features including interchanges, toll plazas, and any other location requiring unexpected or unusual maneuvers. The use of decision sight distance at interchanges was again restated and recommended in 1993 by Lunenfeld (41), Leisch (42), and Keller (43). In a study conducted by Lerner et al. (44) for the Federal Highway Administration, published in 1995, the total time for decision sight distance was measured in heavily traveled urban freeway conditions and found to be longer than the value of 14.5 seconds that was recommended by McGee (40) and included in the AASHTO Green Book (3). The decision sight distance measurements were conducted for three age groups; 20 to 40, 65 to 69, and 70 and older at six freeway lane-drop locations. The recommended times are as follows:
- 38. 26 • 16.5 sec for the 20 to 40 year old group, • 17.6 sec for the 65 to 69 year old group, and • 18.8 seconds for the 70 and older group. The researchers of the FHWA study (44) discussed the difference between their results and the values currently in the Green Book, noting that their study was conducted under heavy traffic conditions in which drivers were required to wait for acceptable gaps for lane-changing maneuvers. The AASHTO recommended value, by comparison, was likely to be the result of a study conducted in free-flow conditions where no driver was required to wait for a gap before performing lane-changing maneuvers. Table 2-8 provides the suggested decision sight distance values if using the results of Lerner et al. (44). Table 2-7. Recommended Decision Sight Distance Values from McGee (40). Design Speed (mph) Time (sec) Decision Sight Distance (ft)Before Maneuver Maneuver (Lane Change) Total Detection and Recognition Decision and Initiation of Response Computed Rounded for Design 25 37 50 62 74 87 1.5-3.0 1.5-3.0 1.5-3.0 2.0-3.0 2.0-3.0 2.0-3.0 4.2-6.5 4.2-6.5 4.2-6.5 4.7-7.0 4.7-7.0 4.7-7.0 4.5 4.5 4.5 4.3 4.0 4.0 10.2-14.0 10.2-14.0 10.2-14.0 11.2-14.5 10.7-14.0 10.7-14.0 372-510 558-766 744-1021 1021-1322 1170-1531 1365-1786 375-525 575-775 750-1025 1025-1325 1175-1525 1350-1800 Note: Values converted from metric Rounded up to the nearest 25 ft for the low value and up or down to the nearest 25 ft for the upper value Table 2-8. Decision Sight Distance Values if Total Times Found in Lerner et al. (44) Study is Used. Speed (mph) Time (sec) Distance (ft) Time (sec) Distance (ft) Time (sec) Distance (ft) Calc Rounded Calc Rounded Calc Rounded 60 70 80 90 100 16.5 16.5 16.5 16.5 16.5 1455 1698 1940 2183 2426 1500 1700 1900 2200 2400 17.6 17.6 17.6 17.6 17.6 1552 1811 2070 2328 2587 1600 1800 2100 2300 2600 18.8 18.8 18.8 18.8 18.8 1658 1935 2211 2487 2764 1700 1900 2200 2500 2800 The total times found by Lerner et al. by age group: 16.5 sec for the 20 to 40 year old group, 17.6 sec for the 65 to 69 year old group, and 18.8 seconds for the 70 and older group.
- 39. 27 SAFETY A review of the literature regarding the safety relationships between weaving length and crashes revealed few studies. Even within the few studies available, researchers identified contrary results. Cirillo (45) examined the relationship between accident rates and weaving area lengths using Interstate data from 20 states. Approximately 700 urban weaving segments were included in the data set. New analyses of the accident rates, measured as accidents per million vehicle miles (accidents per MVM), were conducted and are summarized in Figure 2-14. Trends show that, for a given level of traffic volume, accident rates tend to increase as weaving area lengths decrease. Results also show that, for a given weaving area length, accident rates decrease as volume decreases. Cirillo aggregated accident rates by five levels of one way mainline average daily traffic (ADT) in the original work (ADT < 10,000; 10,000 ≥ ADT < 20,000; 20,000 ≥ ADT < 30,000; 30,000 ≥ ADT < 40,000; 40,000 ≥ ADT), but reported a limited sample size in the lowest volume area category. More consistent general trends were found by this research team when the three lowest volume categories were combined into one (ADT < 30,000). Figure 2-14 reflects this change. Results from a later study showed opposite trends; accident rates decreased as weaving length decreased (46). The sample size was limited to 21 locations. The locations were not selected randomly, but were included due to poor accident histories (a possible selection bias problem). Traffic volumes were not considered in the analysis other than their use in accident rate calculations. Non-linear trends between accidents and volumes are well established. Segregating accident rates by level of traffic volume is desirable if accident rates are the safety measure of choice. The results reported by Cirillo (45), while older, are likely more reliable. Bared et al. (47) modeled the safety effects of interchange spacing using California freeway data (1998–2002). Interchange spacing was defined as the smallest distance between gore points of ramps from consecutive interchanges (the authors define gore point and ramp nose synonymously). Negative binomial regression models for total accidents and fatal plus injury accidents were estimated using data from 58.5 miles of California Interstates; number of lanes varied from 6 to 14. Reported models had the following functional form: ( ) 321 bbb RampADTSLADTaN ∑×××= (4) where: N = expected number of accidents per year; ADT = average daily traffic on the freeway mainline (veh/day); SL = segment length, defined as interchange spacing (mi); ADTRamp∑ = the sum of ADT for the two entrance ramps and two exit ramps associated with a defined interchange spacing segment (veh/day); and =3,2,1, bbba parameters estimated using available data.
- 40. 28 0 100 200 300 400 500 600 700 400 450 500 550 600 650 700 750 800 Length of weaving area (feet) Accidentrate(accidentsper100MVM) One-way ADT < 30,000 30,000 ≥ One-way ADT < 40,000 One-way ADT ≥ 40,000 One-way ADT ≥ 40,000 One-way ADT < 30,000 30,000 ≥ One-way ADT < 40,000 Figure 2-14. Analysis of Accident Rates by Weaving Areas Length Reported by Cirillo (45). Figure 2-15 summarizes and illustrates model results by length of weaving area. The model parameters generally make intuitive sense. However, a closer look at the segment length variable reveals potential challenges associated with their study objective: determining the safety effect of interchange spacing. The traffic and segment length components of an accident frequency model represent measures of exposure; respective regression parameters generally have a value around one. The parameter for ADT may be slightly greater than or less than one, depending on the crash type of interest. The parameter for segment length is sometimes constrained to equal one. In the model reported by Bared et al. (47), the parameter associated with segment length represented the net effect of several potential confounding factors. Exposure was the most predominant, resulting in an overall positive effect of segment length. However, the interchange spacing effect is confounded with the exposure effect because every segment in the database is defined with an entrance gore on one side and an exit gore on the other side. Shorter segment lengths represent reduced exposure, but with increased ramp interaction, these two factors are expected to have opposite effects on accident frequency. The segment length, as defined by Bared et al., may also be correlated with additional interchange related features that influence safety. For example, shorter segment lengths are likely associated with an increased presence of auxiliary lanes between the entrance and exit ramps of two consecutive crossroads, a feature not captured in the data.
- 41. 29 0 50 100 150 200 250 0.0 0.5 1.0 1.5 2.0 2.5 3.0 3.5 ExpectedCrashFrequency(peryear) Segment Length Defined as Interchange Spacing (miles) Total crashes, High volume Total crashes, Medium volume F+I crashes, High volume F+I crashes, Medium volume Total crashes, Low volume F+I crashes, Low volume Low volume: ADT = 66,600 veh/day; ΣRampADT = 6,900 veh/day Medium volume: ADT = 188,000 veh/day; ΣRampADT = 34,100 veh/day High volume: ADT = 274,000 veh/day; ΣRampADT = 120,700 veh/day Total crashes = 6.18×10⁻⁶ ADT1.122 × Segment Length0.6394 × ΣRampADT0.2213 F+I crashes = 5.44×10⁻⁵ ADT0.8618 × Segment Length0.5918 × ΣRampADT0.2088 Figure 2-15. Summary of Freeway Models from Bared et al. (47). One possible solution was explored by Bared et al. and is recreated in Figure 2-16. The expected number of accidents predicted from the regression models in Figure 2-15 are normalized (i.e., divided by) the segment length. The resulting rate, with units of accidents per mile per year, follows an intuitive trend: the expected number of accidents per unit length increases as interchange spacing decreases. The procedure assumes the segment length parameter associated with exposure is equal to one and that the difference between the originally estimated segment length parameter and one is attributable to the interchange spacing effect. This concept is illustrated by: ( ) ( ) 30.121 bbb RampADTSLADTa SL N ∑×××= − (5) where: SL N = expected number of accidents per mile per year; SL= interchange spacing (miles); and =∑ 3,2,1,,, bbbaRampADTADT same as previously defined.
- 42. 30 0 50 100 150 200 250 0.0 0.5 1.0 1.5 2.0 2.5 3.0 3.5 ExpectedCrashFrequency (permileperyear) Interchange Spacing (miles) Total crashes, High volume Total crashes, Medium volume F+I crashes, High volume F+I crashes, Medium volume Total crashes, Low volume F+I crashes, Low volume Low volume: ADT = 66,600 veh/day; ΣRampADT = 6,900 veh/day Medium volume: ADT = 188,000 veh/day; ΣRampADT = 34,100 veh/day High volume: ADT = 274,000 veh/day; ΣRampADT = 120,700 veh/day Total crashes = 6.18×10⁻⁶ ADT1.122 × Spacing-0.3606 × ΣRampADT0.2213 F+I crashes = 5.44×10⁻⁵ ADT0.8618 × Spacing-0.4082 × ΣRampADT0.2088 Figure 2-16. Summary of Freeway Models from Bared et al. with Results Normalized for Segment Length. The slope of the line representing the expected accident frequency versus interchange spacing relationship approaches zero as interchange spacing increases, indicating minimal safety influence from the ramps at the segment termini (i.e., from a safety perspective, the segment operates as a normal freeway segment without deleterious interchange or ramp effects). The interchange spacing at which this occurs becomes longer as mainline and ramp volumes increase. The normalizing technique is promising if one can be fairly certain that effects other than exposure and interchange spacing are not fully or partially captured in the segment length definition. Pilko et al. (48) conducted a follow-up effort to the study by Bared et al. (47) with some notable changes: • The size of the California data set was increased to include 95 spacing observations representing 134 freeway miles (compared to 53 observations representing 58.5 miles). • A Washington freeway data set consisting of 100 spacing observations representing 144 freeway miles was added and used for model estimation and validation. • Mainline traffic was specified as vehicles per lane per day. • Ramp volumes were expressed at the ratio of ramp ADT to mainline ADT for the California models.
- 43. 31 • Cross-section variables representing median width, median type, and high-occupancy vehicle (HOV) lane presence were included in some models. • The definition for interchange spacing was changed to represent the distance between crossroads of consecutive interchanges. Model estimation results are summarized in Table 2-9. The graphical displays in Figure 2-16 represent general trends that are also seen when the models in Table 2-9 are plotted. Discussion and analysis associated with Figure 2-16 are also applicable. Therefore, the figures and analysis are not repeated here. Table 2-9. Summary of Reported Models in Pilko et al. (48). Data and Specification Accident Types Expected accident frequency per year CA only TOTAL ( )MTMWHOVRRatioSL LN ADT ∗+∗−∗+∗⎟ ⎠ ⎞ ⎜ ⎝ ⎛ ×= − 27.001.037.050.1exp1097.4 57.0 39.1 5 F+I ( )MTMWHOVRRatioSL LN ADT ∗+∗−∗+∗⎟ ⎠ ⎞ ⎜ ⎝ ⎛ ×= − 35.001.034.042.1exp1081.1 57.0 37.1 5 CA for WA validation TOTAL ( )MWRampADTSL LN ADT ∗⎟ ⎠ ⎞ ⎜ ⎝ ⎛ ×= ∑− 0072.0exp1061.3 34.052.0 11.1 5 F+I ( )MWRampADTSL LN ADT ∗⎟ ⎠ ⎞ ⎜ ⎝ ⎛ ×= ∑− 0051.0exp1064.1 35.051.0 07.1 5 Joint CA and WA F+I ( )MWRampADTSL LN ADT ∗⎟ ⎠ ⎞ ⎜ ⎝ ⎛ ×= ∑− 0032.0exp1063.1 26.062.0 37.1 6 ADT = average daily traffic on freeway mainline (veh/day); LN = number of lanes at the segment midpoint (includes through lanes, HOV lanes, and auxiliary lanes greater than 0.2 mile long); SL = segment length, defined as interchange spacing (mi); RRatio = the sum of ADT for the two entrance ramps and two exit ramps associated with a defined interchange spacing segment divided by average daily traffic on the freeway mainline; HOV = indicator for presence of an HOV lane (1 = present); MW = median width (ft); MT = indicator for median type (1 = unpaved, 0 = paved); and ∑RampADT = the sum of ADT for the two entrance ramps and two exit ramps associated with a defined interchange spacing segment. SIGN SPACING FOR AN EXIT RAMP The Texas Manual on Uniform Traffic Control Devices TMUTCD (49) and the TxDOT Freeway Signing Handbook (50) provide information on freeway signing. Included in those discussions is a table on desirable and maximum units of information per freeway guide sign structure (see Table 2-10). In section 2E.30 of the TMUTCD, the guidance is to place advance guide signs at 0.5 and 1 mile in advance of the exit with a third advance guide sign placed at 2 miles in advance of the exit if spacing permits.
- 44. 32 Hawkins et al. (51) examined guide sign characteristics for a 90 mph freeway. They identified typical design parameters such as a maximum sign width of 24 ft, height of center of sign (20 ft above driver eye height), a city name that would represent approximately the 85th percentile value for number of characters, and other parameters. The recommendation for the letter height of an overhead guide sign was based on both the sign width and legibility height analyses. The sign width analysis showed that the maximum letter height for the word “San Antonio” is 22 inches. The legibility height analysis was used to determine the minimum letter height required for an overhead guide sign. Historically, signs have been designed using a 50 ft/inch legibility index but the MUTCD now recommends using a 40 ft/inch index, and suggests that 33 ft/inch can be beneficial. Using a 40 ft/inch legibility index and two methods for determining required reading time found that the letter height of 22 inches would satisfy legibility requirements for: • 10 units of information or less and • 12 units of information using two panel signs. Based on their findings, the researchers recommended that the legend on guide signs be a minimum of 22 inches and that additional guide sign installations be provided in advance of the exit. Furthermore, sign sheeting for overhead signs should be limited to sheeting types that will provide adequate luminance. The amount of information on a guide sign is the key limiting factor for maintaining the legibility of longer names for destinations. Therefore, the authors recommended using more redundancy of signs for the high speed facilities. The redundancy will allow the use of fewer units of information per sign so that a driver can read the sign. The tradeoff is that more signs and probably a greater distance will be needed in advance of the ramp to adequately sign for the exit. Table 2-10. Desirable and Maximum Units of Information per Freeway Guide Sign Structure (50). Number of Sign Panels Units of Information per Structure Desirable Maximum 2 3 4 5 12 16 18 Undesirable Design 16 18 20 20 Source: McNees, R. W. and C. J. Messer. Reading Time and Accuracy of Response to Simulated Urban Freeway Guide Signs in Transportation Research Record 844, Transportation Research Board, Washington, D.C., 1982.
- 45. 33 CHAPTER 3 FIELD STUDIES OPERATIONAL MEASURES Highway Capacity Manual algorithms for entrance ramps followed by exit ramps with an auxiliary lane (i.e., weaving) have traditionally included speed estimation as the primary predictive step. Conversions to density, and subsequently level of service, are made for consistency with basic freeway segment and ramp junction analysis. The capacity of a weaving segment is defined as any combination of flows that cause density to reach 43 passenger cars per mile per lane (pc/mi/ln). A direct solution is not possible so trial and error is used. Recently proposed weaving algorithms that are currently being considered for future HCM editions include predictive steps for lane changing, as well as new predictive structures for speed and capacity. Conversions to density are still made for level of service estimates. In the supporting research, the number and longitudinal positions of lane changes as well as average speeds were used to calibrate microscopic simulation models (52). The simulation results ultimately complemented field data and supported the new algorithm development (52). HCM algorithms for entrance ramps followed by exit ramps without an auxiliary lane treat each ramp separately. Flow rates in the merge and diverge influence areas are compared to respective capacity values to determine the likelihood of congestion. The capacities of merge and diverge areas are limited by the capacities of the upstream, downstream, and ramp facilities themselves and are not influenced by the intensity of traffic turbulence from lane changing maneuvers. Densities are directly computed and used to determine level of service. Average speeds in ramp influence areas are estimated as a secondary performance measure, most often when the computations are part of a larger, multi-facility analysis. Unrelated research aimed at real-time freeway monitoring and incident response has begun to link operational measures to accident occurrence (53). Relationships between speed variance and the likelihood of a downstream accident have been reported (53). All of the aforementioned performance measures are inextricably linked to traffic volumes and the distributions of origins and destinations (e.g., freeway through movement, freeway to exit ramp, entrance ramp to freeway, entrance ramp to exit ramp). Given these discussions, the target operational measures for the field data collection efforts were: • volumes by lane and location; • speed magnitudes by lane, location, and movement; • speed variability by lane, location, and movement; and • number, direction, and location of lane changes. The level of detail and disaggregation for these measures were limited by practicality and safety issues associated with field data collection.
- 46. 34 DATA COLLECTION EQUIPMENT The 0-5860 proposal identified camera trailers, supplemental camcorders, and traffic management cameras as alternatives to collect lane changing and volume data. Traffic sensors and light detection and ranging (lidar) guns were identified as options for speed data acquisition. Some technologies were field tested on SH 6 (Earl Rudder Freeway) southbound between SH 30 (Harvey Road) and Southwest Parkway East, a low-volume weaving segment in College Station, Texas. Other options were evaluated subjectively based on prior data collection experience combined with observed behavior at weaving segments. The following conclusions were reached: • Ideal positioning for the camera trailer was upstream of the painted entrance gore or downstream of the painted exit gore (depending on the direction of the vertical grade). The trailer presented a possible safety hazard at these locations, potentially blocking sight lines and occupying emergency recovery areas. • Winds affected the stability of the camera trailer arm. Although this is not an issue for most trailer applications, the desire to identify lane change locations made constant camera movement undesirable, even if it was minimal. • Collecting speeds with lidar was difficult and impractical. Individual vehicles could not be tracked through the entire entrance-exit segment, as sight lines to those vehicles were often blocked by other vehicles as a result of lane changing. In addition, the positions needed by lidar gun operators to capture speeds of entering, exiting, and through vehicles were very conspicuous to drivers. A decision was made to use traffic management center (TMC) cameras combined with pneumatic tubes as the first data collection alternative. Closed circuit television (CCTV) cameras are located along major roadways in Houston, Dallas, and San Antonio and are operated through TranStar, DalTrans, and TransGuide, respectively. TTI researchers have used TMC cameras for data collection on previous studies through coordination with TxDOT and appropriate TMC staff. The use of these cameras offers several advantages, including height, stability, and ease of video recording. There are also disadvantages associated with their use. Site selection is controlled more by available camera views than by the originally identified site selection factors in the 0-5860 proposal. Camera views at each location are likely to vary, requiring flexibility in data reduction techniques. Finally, cameras are used for traffic and incident management. TxDOT may take control of camera operation at anytime during data collection. Extended time periods with the camera aimed away from weaving areas during the specified data collection period was expected. Figure 3-1 and Figure 3-2 show two examples of weaving areas as viewed from TranStar cameras in Houston, Texas. Figure 3-3 (entrance-exit with auxiliary lane) and Figure 3-4 (entrance-exit without auxiliary lane) illustrate the general pneumatic tube layouts used for data collection. The tube layouts are a compromise between collecting all desired data (i.e., speeds and volumes in every lane) and issues regarding safety and practicality of installation, durability, and removal on a multi-lane freeway. Two pairs of tubes were placed in the rightmost through travel lane to capture speeds and volumes immediately upstream and downstream of the entrance and exit movements for
- 47. 35 both ramp configurations. A single tube was placed on the entrance and exit ramps to collect entering and exiting volumes for both ramp configurations. Figure 3-1. View of SH 288 SB between Reed Road and Airport Boulevard (Viewed from Camera 810 at Reed Road). Figure 3-2. View of SH 288 NB between Airport Boulevard and Reed Road (Viewed from Camera 811 at Airport Boulevard).