Prepared by:
Ayman Naalweh
MustafaMayyaleh
Nidal Turkoman
An-Najah National University
Faculty of Engineering
Civil Engineering Department
Graduation Project:
3D Dynamic Soil Structure Interaction Design For Al-Manar Building
Supervised By
Dr: Imad AL-Qasem
SUBJECTS TO BECOVERED
Abstract
Chapter One : Introduction
Chapter Two : Slab
Chapter Three : Beams
Chapter Four : Columns
Chapter Five : Footing
Chapter Six : Checks
Chapter Seven : Dynamic Analysis
Chapter Eight : Soil Structure Interaction
4.
Abstract
AL-Manar buildingcomposed of seven stories office
building. Each floor is composed of equal surface area
of 1925 m2
with 3.5 meter height and long spans.
The building analyzed under static loads using SAP
2000v12.
After that the building was analyzed dynamically.
Finally it was designed based on Soil Structure
Interaction (SSI).
5.
INTRODUCTION
About theproject:
(AL-Manar) building in Ramallah, is an office building
consists of seven floors having the same area and height,
the first floor will be used as a garage.
Philosophy of analysis & design:
SAP2000 V12 is used for analysis and ultimate design
method is used for design of slab, the slab are carried over
drop beams.
6.
INTRODUCTION
Materials of construction:
Reinforced concrete:
(ρ) = 2.4 ton/m3
,
The required compressive strength after 28 days is
fc = 250 kg/cm2
,
For footings fc =280 kg/cm2
For columns fc = 500 kg/cm2
Fy =4200 kg/cm2
Soil capacity = 3.5 kg/cm²
7.
INTRODUCTION
loads:
Liveload: LL=0.4 ton/m2
Dead load: DL=(Calculated By SAP) , SID= 0.3 ton/m2
Earthquake load: its represents the lateral load that comes
from an earthquake.
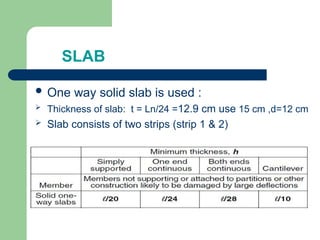
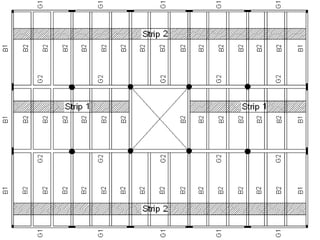
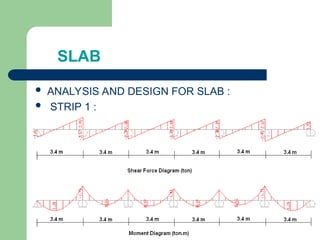
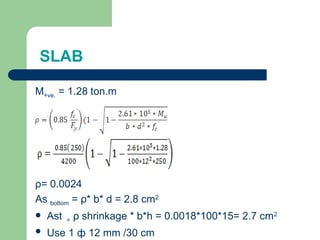
SLAB
M+ve. = 1.28ton.m
ρ= 0.0024
As bottom = ρ* b* d = 2.8 cm2
Ast = ρ shrinkage * b*h = 0.0018*100*15= 2.7 cm2
Use 1 ф 12 mm /30 cm
13.
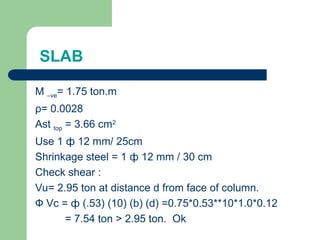
SLAB
M –ve= 1.75ton.m
ρ= 0.0028
Ast top = 3.66 cm2
Use 1 ф 12 mm/ 25cm
Shrinkage steel = 1 ф 12 mm / 30 cm
Check shear :
Vu= 2.95 ton at distance d from face of column.
Ф Vc = ф (.53) (10) (b) (d) =0.75*0.53**10*1.0*0.12
= 7.54 ton > 2.95 ton. Ok
14.
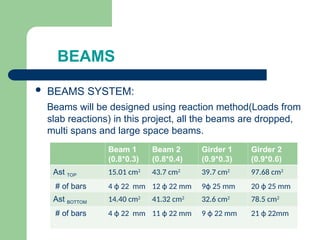
BEAMS
BEAMS SYSTEM:
Beamswill be designed using reaction method(Loads from
slab reactions) in this project, all the beams are dropped,
multi spans and large space beams.
Beam 1
(0.8*0.3)
Beam 2
(0.8*0.4)
Girder 1
(0.9*0.3)
Girder 2
(0.9*0.6)
Ast TOP 15.01 cm2
43.7 cm2
39.7 cm2
97.68 cm2
# of bars 4 ф 22 mm 12 ф 22 mm 9ф 25 mm 20 ф 25 mm
Ast BOTTOM 14.40 cm2
41.32 cm2
32.6 cm2
78.5 cm2
# of bars 4 ф 22 mm 11 ф 22 mm 9 ф 22 mm 21 ф 22mm
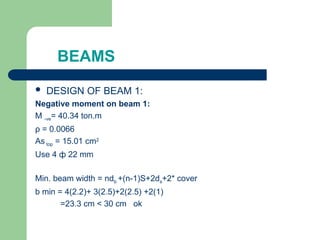
BEAMS
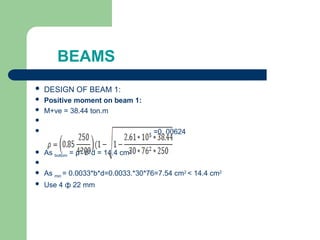
DESIGN OFBEAM 1:
Positive moment on beam 1:
M+ve = 38.44 ton.m
=0. 00624
As bottom = ρ* b*d = 14.4 cm2
As min = 0.0033*b*d=0.0033.*30*76=7.54 cm2
< 14.4 cm2
Use 4 ф 22 mm
18.
BEAMS
DESIGN OFBEAM 1:
Negative moment on beam 1:
M -ve= 40.34 ton.m
ρ = 0.0066
As top = 15.01 cm2
Use 4 ф 22 mm
Min. beam width = ndb +(n-1)S+2ds+2* cover
b min = 4(2.2)+ 3(2.5)+2(2.5) +2(1)
=23.3 cm < 30 cm ok
19.
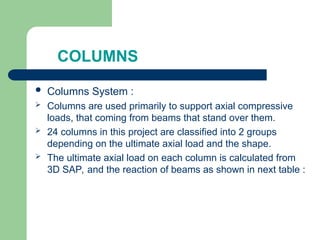
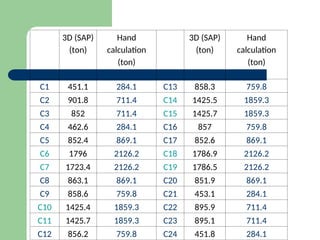
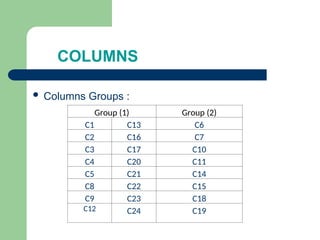
COLUMNS
Columns System:
Columns are used primarily to support axial compressive
loads, that coming from beams that stand over them.
24 columns in this project are classified into 2 groups
depending on the ultimate axial load and the shape.
The ultimate axial load on each column is calculated from
3D SAP, and the reaction of beams as shown in next table :
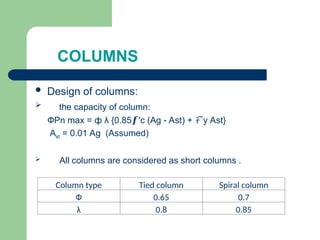
COLUMNS
Design ofcolumns:
the capacity of column:
ФPn max = ф λ {0.85 'c (Ag - Ast) + y Ast}
𝒇 ℱ
Ast = 0.01 Ag (Assumed)
All columns are considered as short columns .
Column type Tied column Spiral column
Ф 0.65 0.7
λ 0.8 0.85
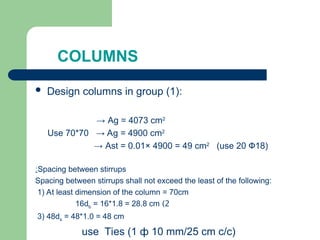
COLUMNS
Design columnsin group (1):
Pu = 980 ton
Check buckling:
The column is short
K: The effective length coefficient (=1 braced frame )
Lu: unbraced length of the column
r: radius of gyration of the column cross section
Let = 1 , = 16.67 < 22 → ok short column.
ФPn max = ф λ {0.85 'c (Ag - Ast) + y Ast}
𝒇 ℱ
Let
b
b
M
M
2
1
= 1
25.
COLUMNS
Design columnsin group (1):
→ Ag = 4073 cm2
Use 70*70 → Ag = 4900 cm2
→ Ast = 0.01× 4900 = 49 cm2
(use 20 Ф18)
Spacing between stirrups
:
Spacing between stirrups shall not exceed the least of the following:
1) At least dimension of the column = 70cm
2
)
16db = 16*1.8 = 28.8 cm
3) 48ds = 48*1.0 = 48 cm
use Ties (1 ф 10 mm/25 cm c/c)
Let
= 1
26.
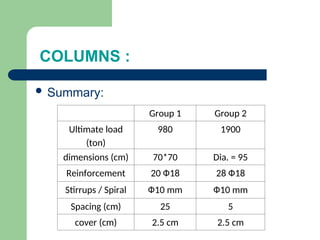
COLUMNS :
Summary:
Group1 Group 2
Ultimate load
(ton)
980 1900
dimensions (cm) 70*70 Dia. = 95
Reinforcement 20 Ф18 28 Ф18
Stirrups / Spiral Ф10 mm Ф10 mm
Spacing (cm) 25 5
cover (cm) 2.5 cm 2.5 cm
27.
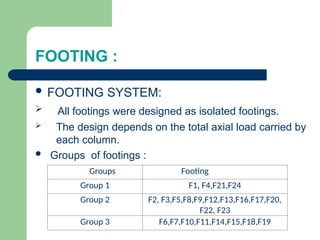
FOOTING :
FOOTINGSYSTEM:
All footings were designed as isolated footings.
The design depends on the total axial load carried by
each column.
Groups of footings :
Groups Footing
Group 1 F1, F4,F21,F24
Group 2 F2, F3,F5,F8,F9,F12,F13,F16,F17,F20,
F22, F23
Group 3 F6,F7,F10,F11,F14,F15,F18,F19
28.
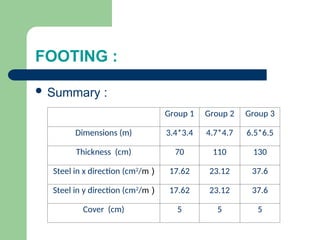
FOOTING :
Summary:
Group 1 Group 2 Group 3
Dimensions (m) 3.4*3.4 4.7*4.7 6.5*6.5
Thickness (cm) 70 110 130
Steel in x direction (cm2
/m ) 17.62 23.12 37.6
Steel in y direction (cm2
/m ) 17.62 23.12 37.6
Cover (cm) 5 5 5
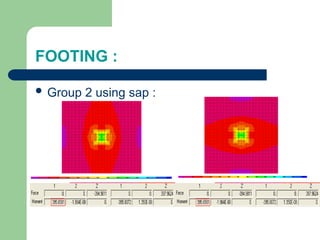
FOOTING :
Group2 using sap :
Moment per meter in x& y =395.66/4.7= 84.18 ton.m/m
Compare it with hand calculation Mu= 88.73 ton.m
% of error = 88.73-84.18/84.14 = 5.4 %
31.
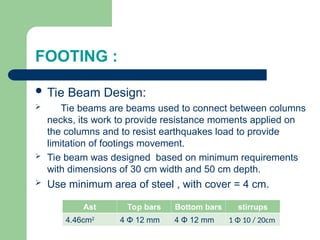
FOOTING :
TieBeam Design:
Tie beams are beams used to connect between columns
necks, its work to provide resistance moments applied on
the columns and to resist earthquakes load to provide
limitation of footings movement.
Tie beam was designed based on minimum requirements
with dimensions of 30 cm width and 50 cm depth.
Use minimum area of steel , with cover = 4 cm.
Ast Top bars Bottom bars stirrups
4.46cm2
4 Φ 12 mm 4 Φ 12 mm 1 Φ 10 / 20cm
32.
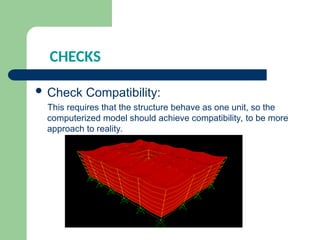
CHECKS
Check Compatibility:
Thisrequires that the structure behave as one unit, so the
computerized model should achieve compatibility, to be more
approach to reality.
33.
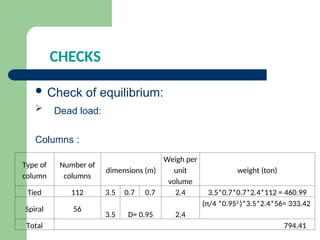
CHECKS
Check ofequilibrium:
Dead load:
Columns :
Type of
column
Number of
columns
dimensions (m)
Weigh per
unit
volume
weight (ton)
Tied 112 3.5 0.7 0.7 2.4 3.5*0.7*0.7*2.4*112 = 460.99
Spiral 56
3.5 D= 0.95 2.4
(π/4 *0.952
)*3.5*2.4*56= 333.42
Total 794.41
34.
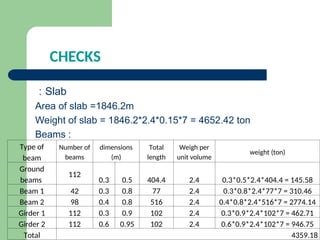
CHECKS
Slab
:
Area of slab=1846.2m
Weight of slab = 1846.2*2.4*0.15*7 = 4652.42 ton
Beams :
Type of
beam
Number of
beams
dimensions
(m)
Total
length
Weigh per
unit volume
weight (ton)
Ground
beams
112
0.3 0.5 404.4 2.4 0.3*0.5*2.4*404.4 = 145.58
Beam 1 42 0.3 0.8 77 2.4 0.3*0.8*2.4*77*7 = 310.46
Beam 2 98 0.4 0.8 516 2.4 0.4*0.8*2.4*516*7 = 2774.14
Girder 1 112 0.3 0.9 102 2.4 0.3*0.9*2.4*102*7 = 462.71
Girder 2 112 0.6 0.95 102 2.4 0.6*0.9*2.4*102*7 = 946.75
Total 4359.18
35.
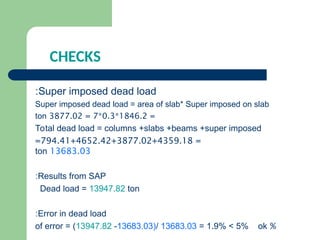
CHECKS
Super imposed deadload
:
Super imposed dead load = area of slab* Super imposed on slab
=
1846.2
*
0.3
*
7
=
3877.02
ton
Total dead load = columns +slabs +beams +super imposed
=
794.41+4652.42+3877.02+4359.18
=
13683.03
ton
Results from SAP
:
Dead load = 13947.82 ton
Error in dead load
:
%
of error = (13947.82 -13683.03)/ 13683.03 = 1.9% < 5% ok
36.
CHECKS
Live load
:
Live load= area of slab* live load
=
1846.2
*
0.4
*
7
=
5169.36
ton
Results from SAP
:
Live load = 5169.36
Error in live load
:
%
of error = (5169.36 - 5169.36 )/5169.36 = 0% < 5% ok
37.
CHECKS
Check stress strainrelationship:
Taking beam 1 as example:
Stress –Strain relationship is more difficult check compared with
others, because of the large difference between values of 1D and
3D model, which usually appears during check .
Max M+
Ext. (Ton.m) Max M-
Int. (Ton.m)
1D 3D %
of error 1D 3D %
of error
38.44 43.18 12.3 40.34 35.4 13.9
38.
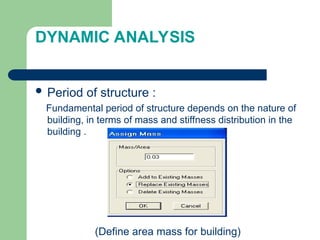
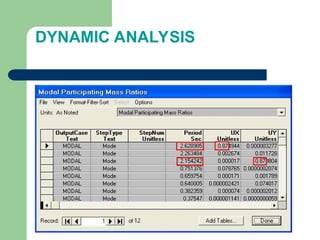
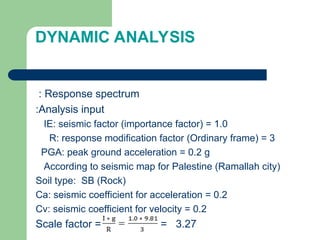
DYNAMIC ANALYSIS
Periodof structure :
Fundamental period of structure depends on the nature of
building, in terms of mass and stiffness distribution in the
building .
(Define area mass for building)
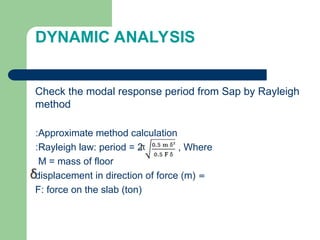
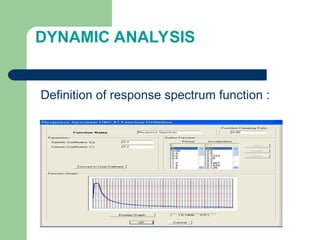
DYNAMIC ANALYSIS
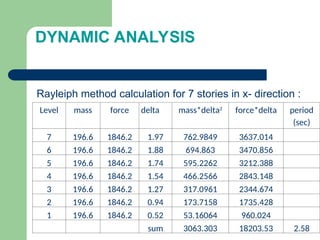
Check themodal response period from Sap by Rayleigh
method
Approximate method calculation
:
Rayleigh law: period = 2 , Where
:
M = mass of floor
=
displacement in direction of force (m)
F: force on the slab (ton)
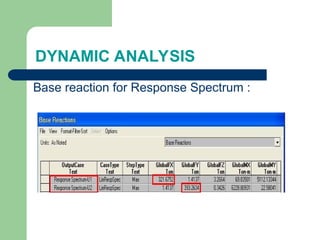
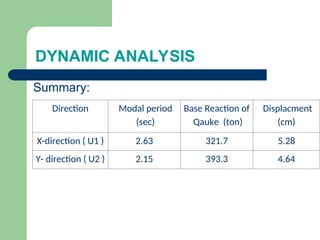
DYNAMIC ANALYSIS
Summary:
Direction Modalperiod
(
sec
)
Base Reaction of
Qauke (ton)
Displacment
(
cm
)
X-direction ( U1 ) 2.63 321.7 5.28
Y- direction ( U2 ) 2.15 393.3 4.64
47.
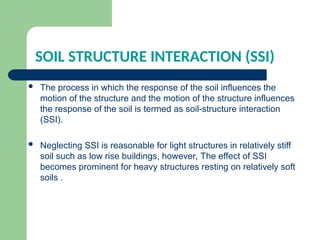
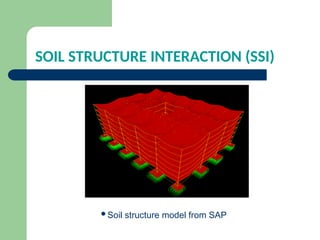
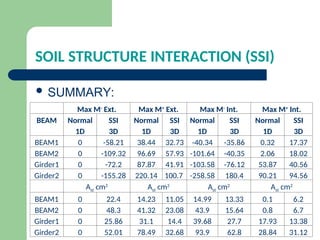
SOIL STRUCTURE INTERACTION(SSI)
The process in which the response of the soil influences the
motion of the structure and the motion of the structure influences
the response of the soil is termed as soil-structure interaction
(SSI).
Neglecting SSI is reasonable for light structures in relatively stiff
soil such as low rise buildings, however, The effect of SSI
becomes prominent for heavy structures resting on relatively soft
soils .
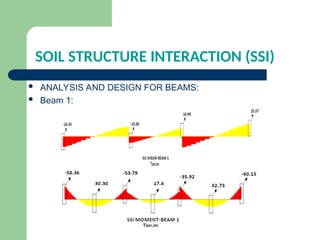
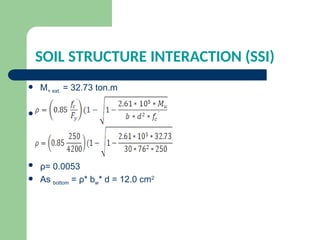
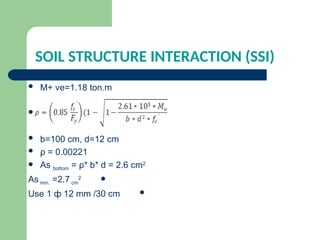
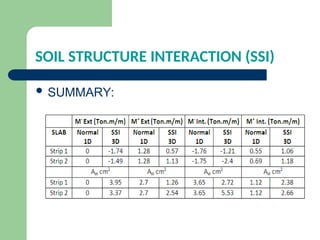
SOIL STRUCTURE INTERACTION(SSI)
M+ ve=1.18 ton.m
b=100 cm, d=12 cm
ρ = 0.00221
As bottom = ρ* b* d = 2.6 cm2
As min. =2.7 cm
2
Use 1 ф 12 mm /30 cm