Download to read offline
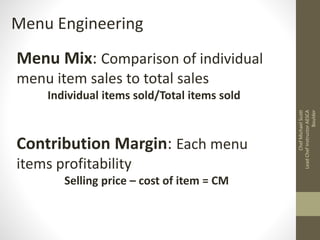
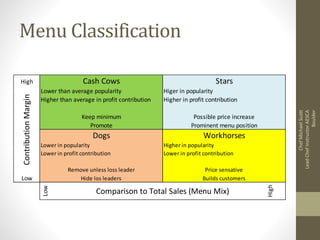
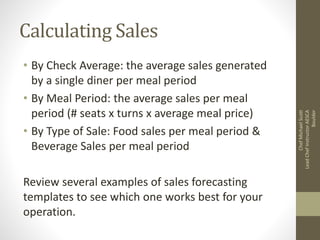

This document discusses how to forecast sales and maximize a restaurant menu. It recommends forecasting total sales based on seating capacity, table sizes, takeout, and bar service. Menus should be engineered using menu mix and item contribution margins. Menu items are classified as stars, cash cows, dogs, or plow horses based on popularity and profitability to determine pricing and placement on the menu. Sales can be calculated by average check, meal period, or type of sale. Forecasting is educated estimates while tracking uses actual sales numbers to monitor menu performance.


