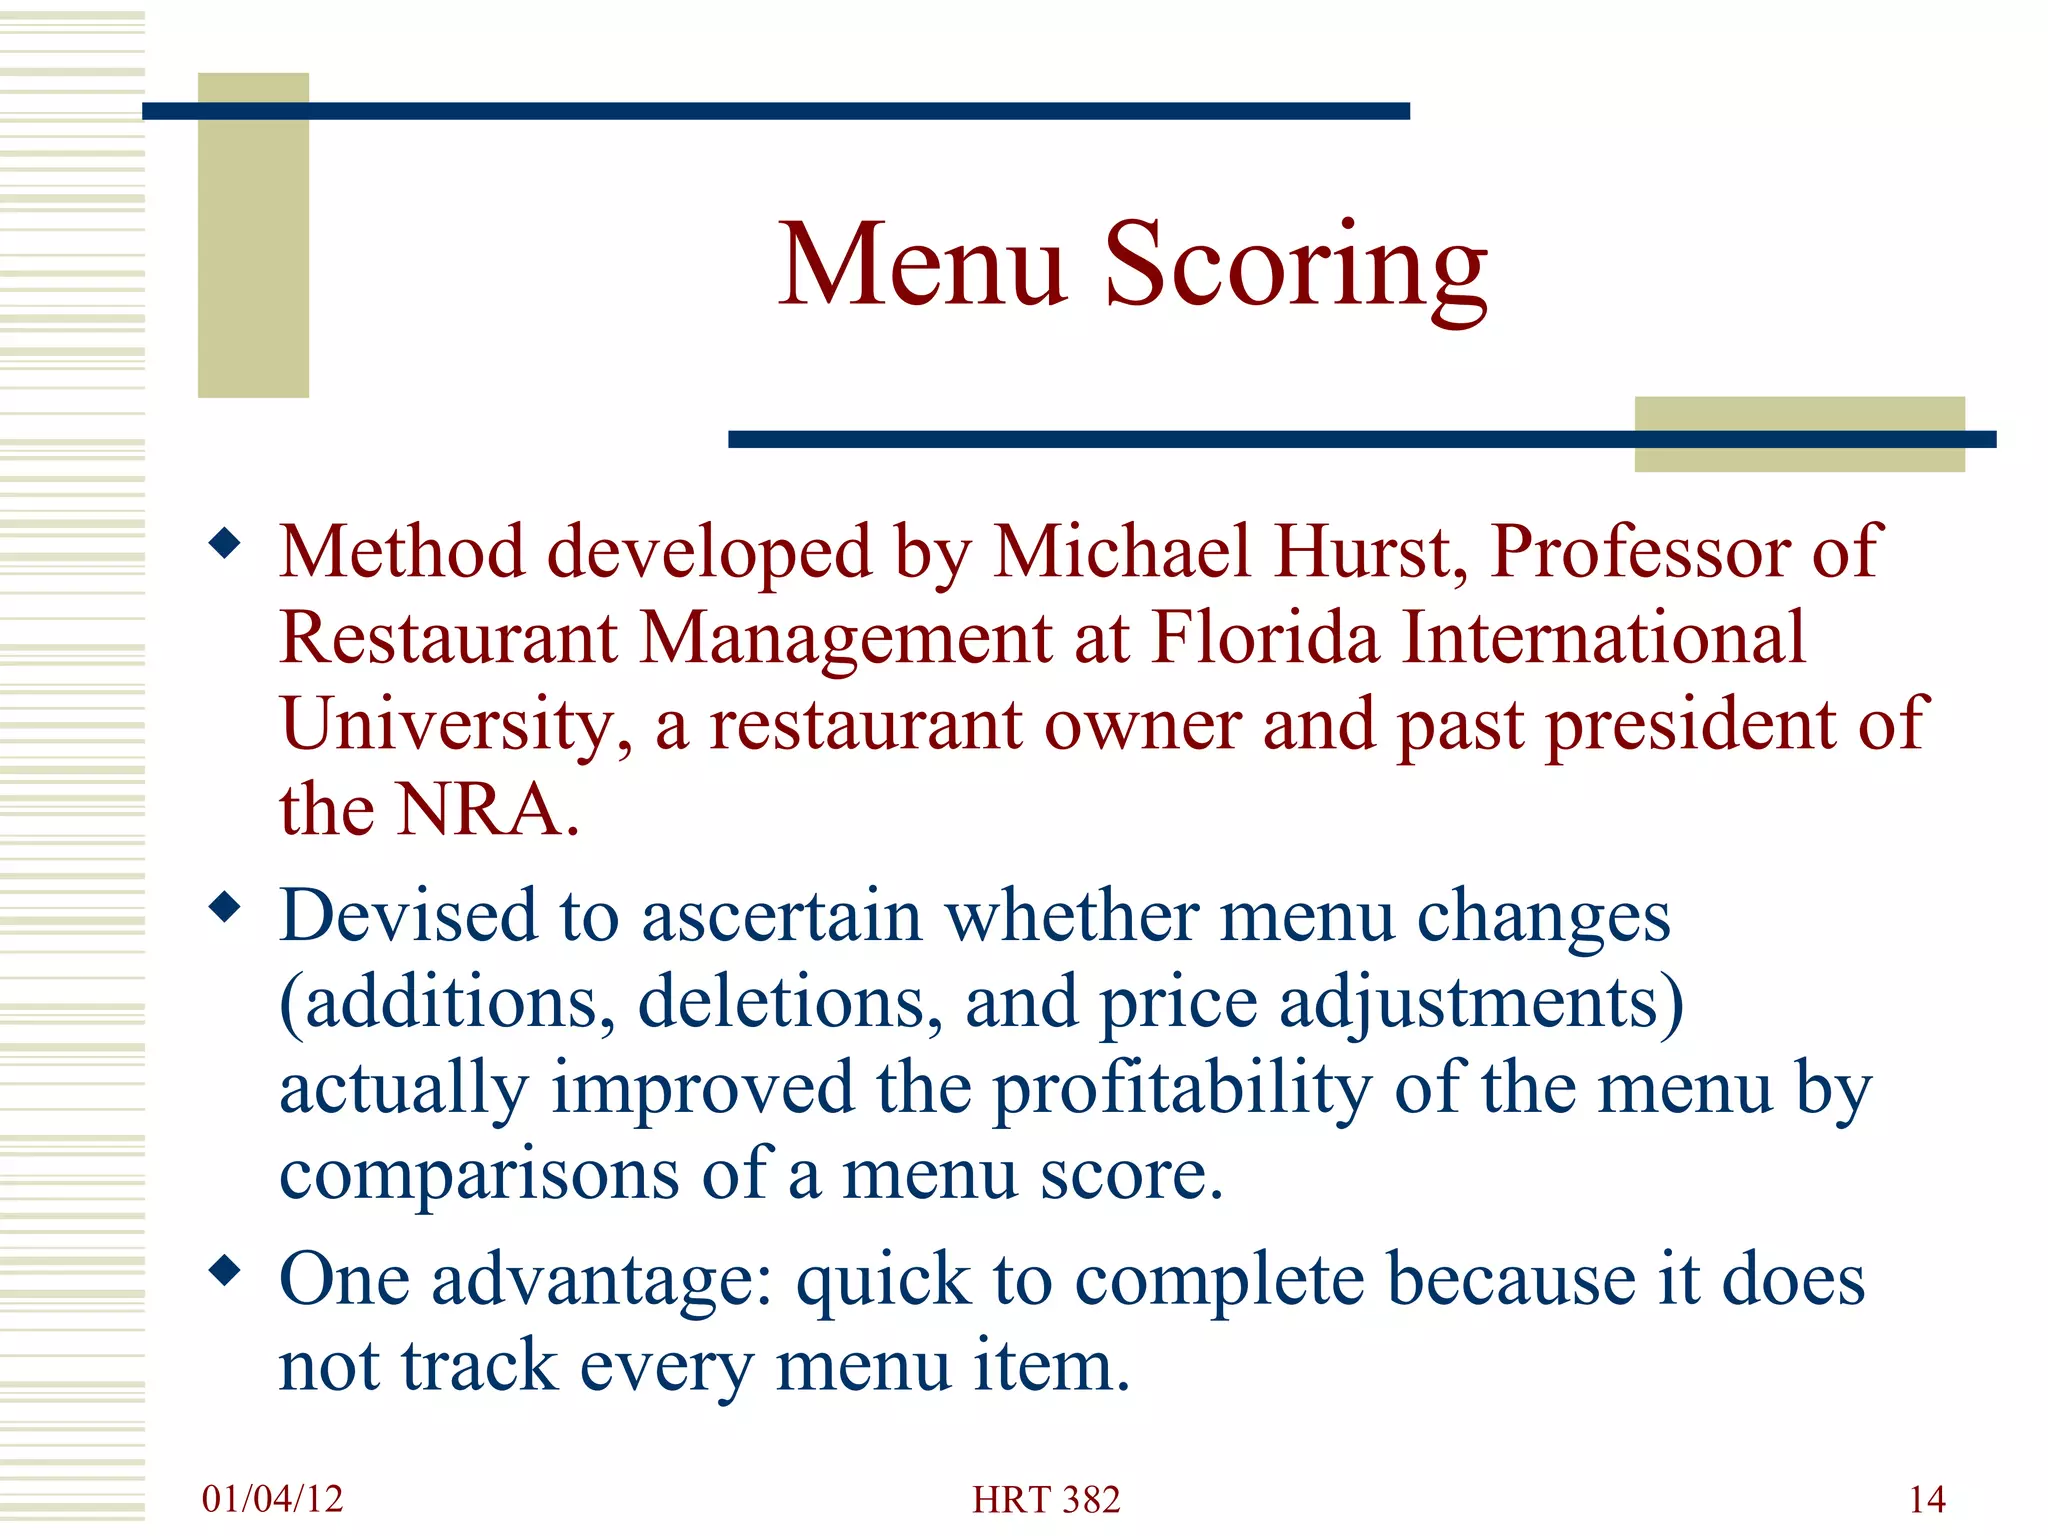
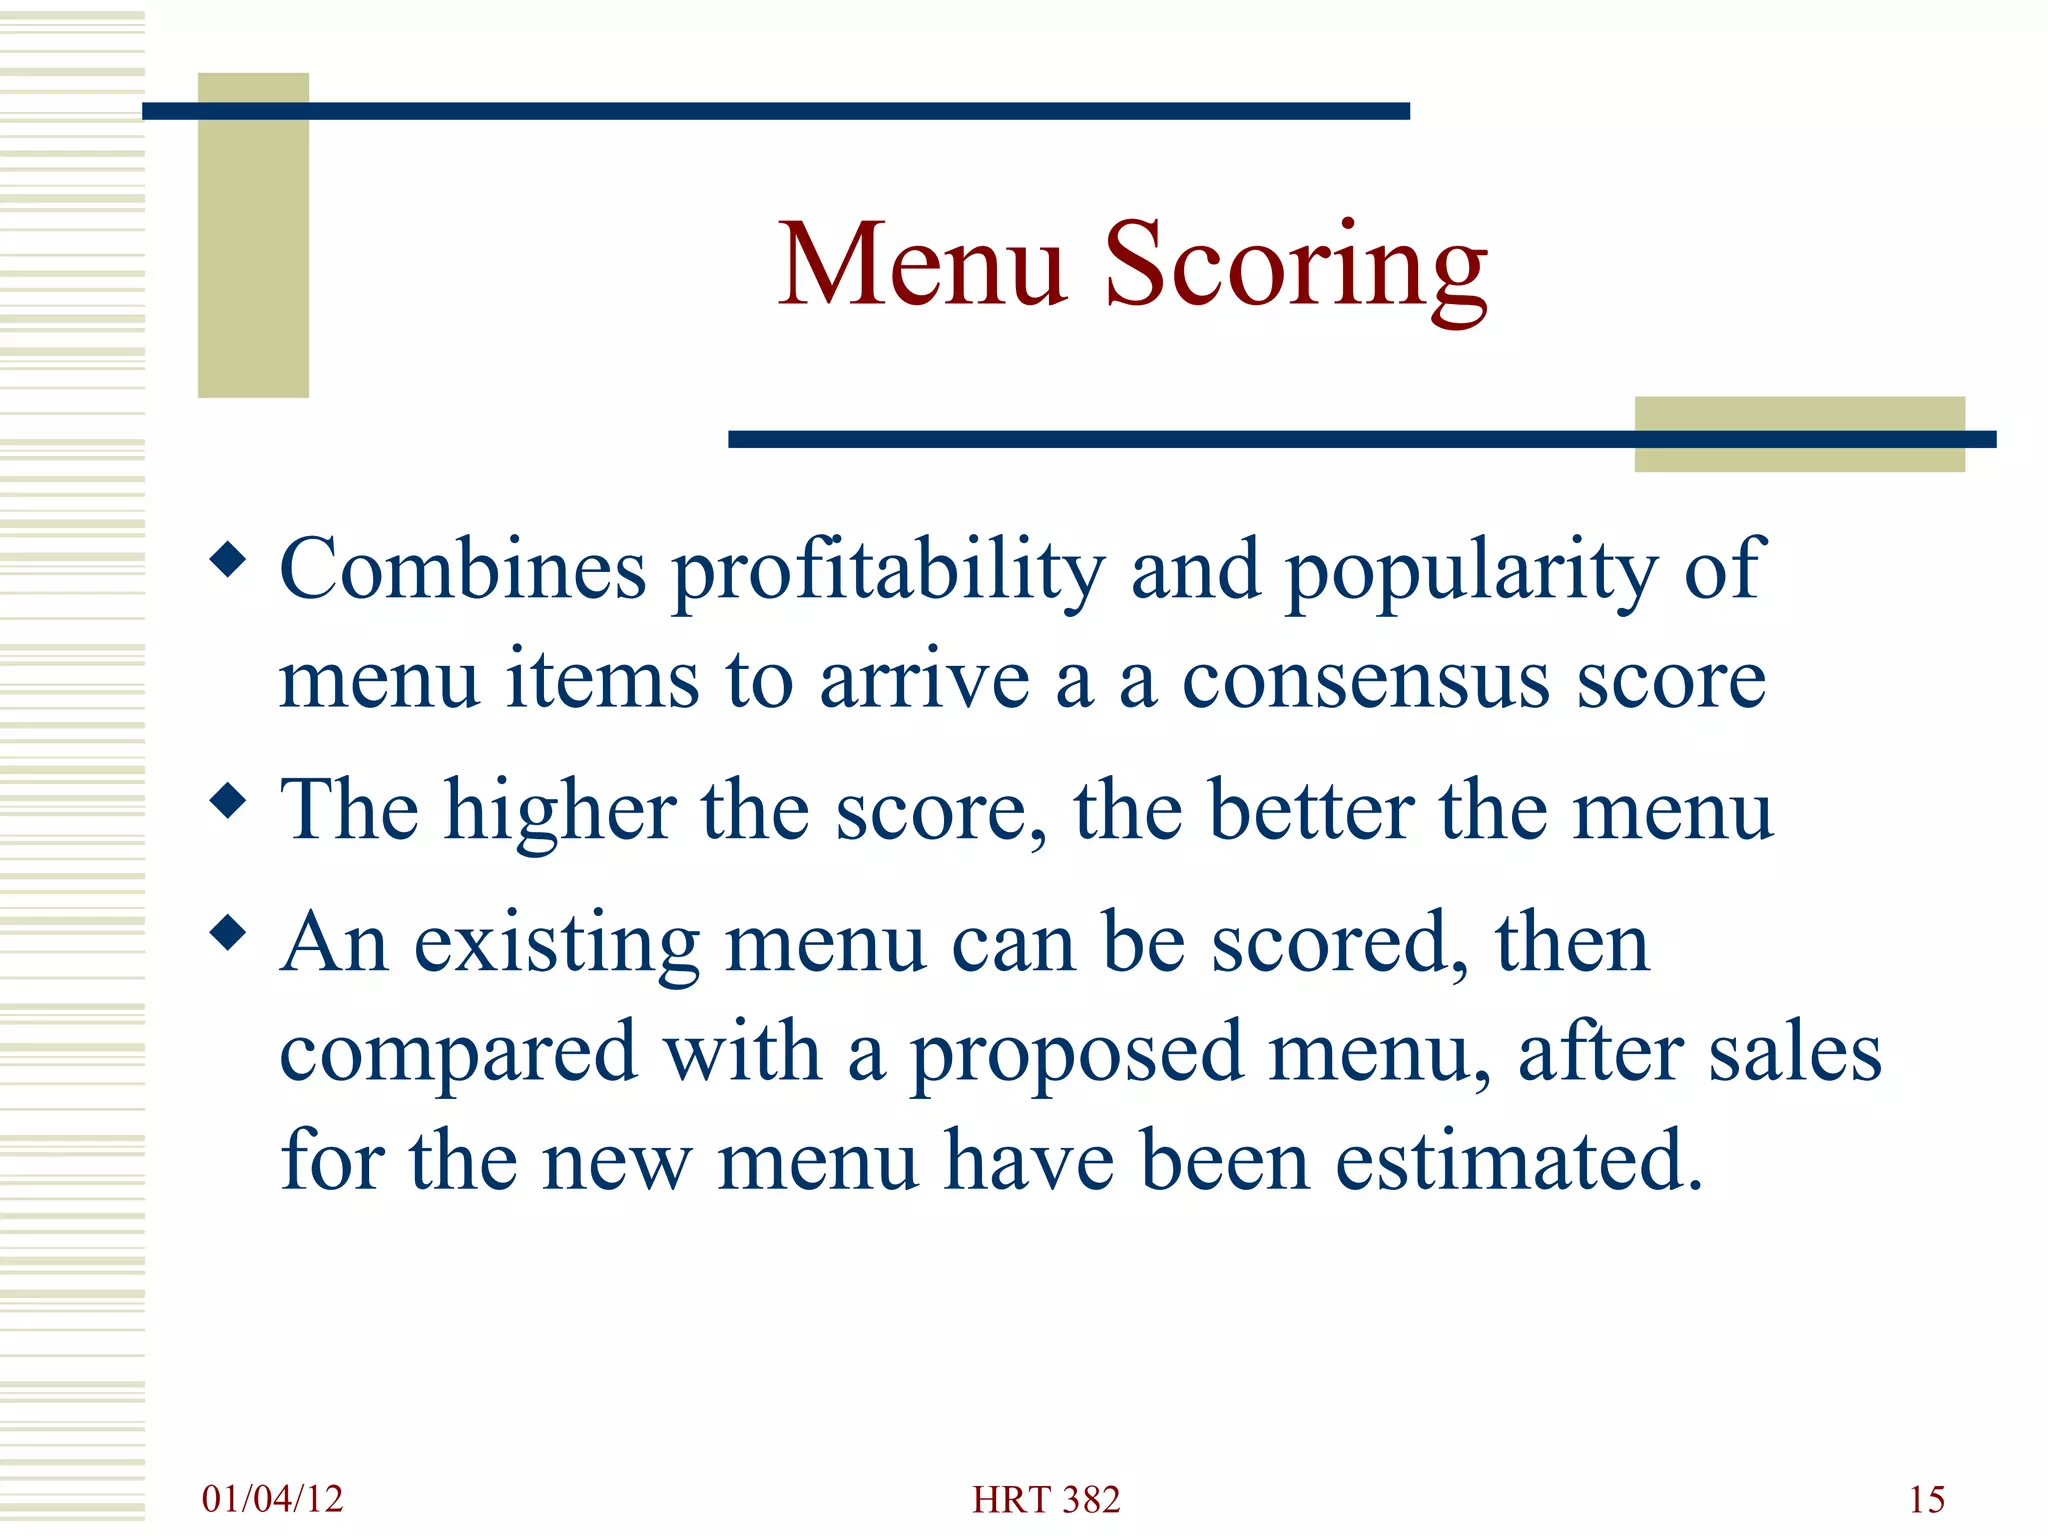
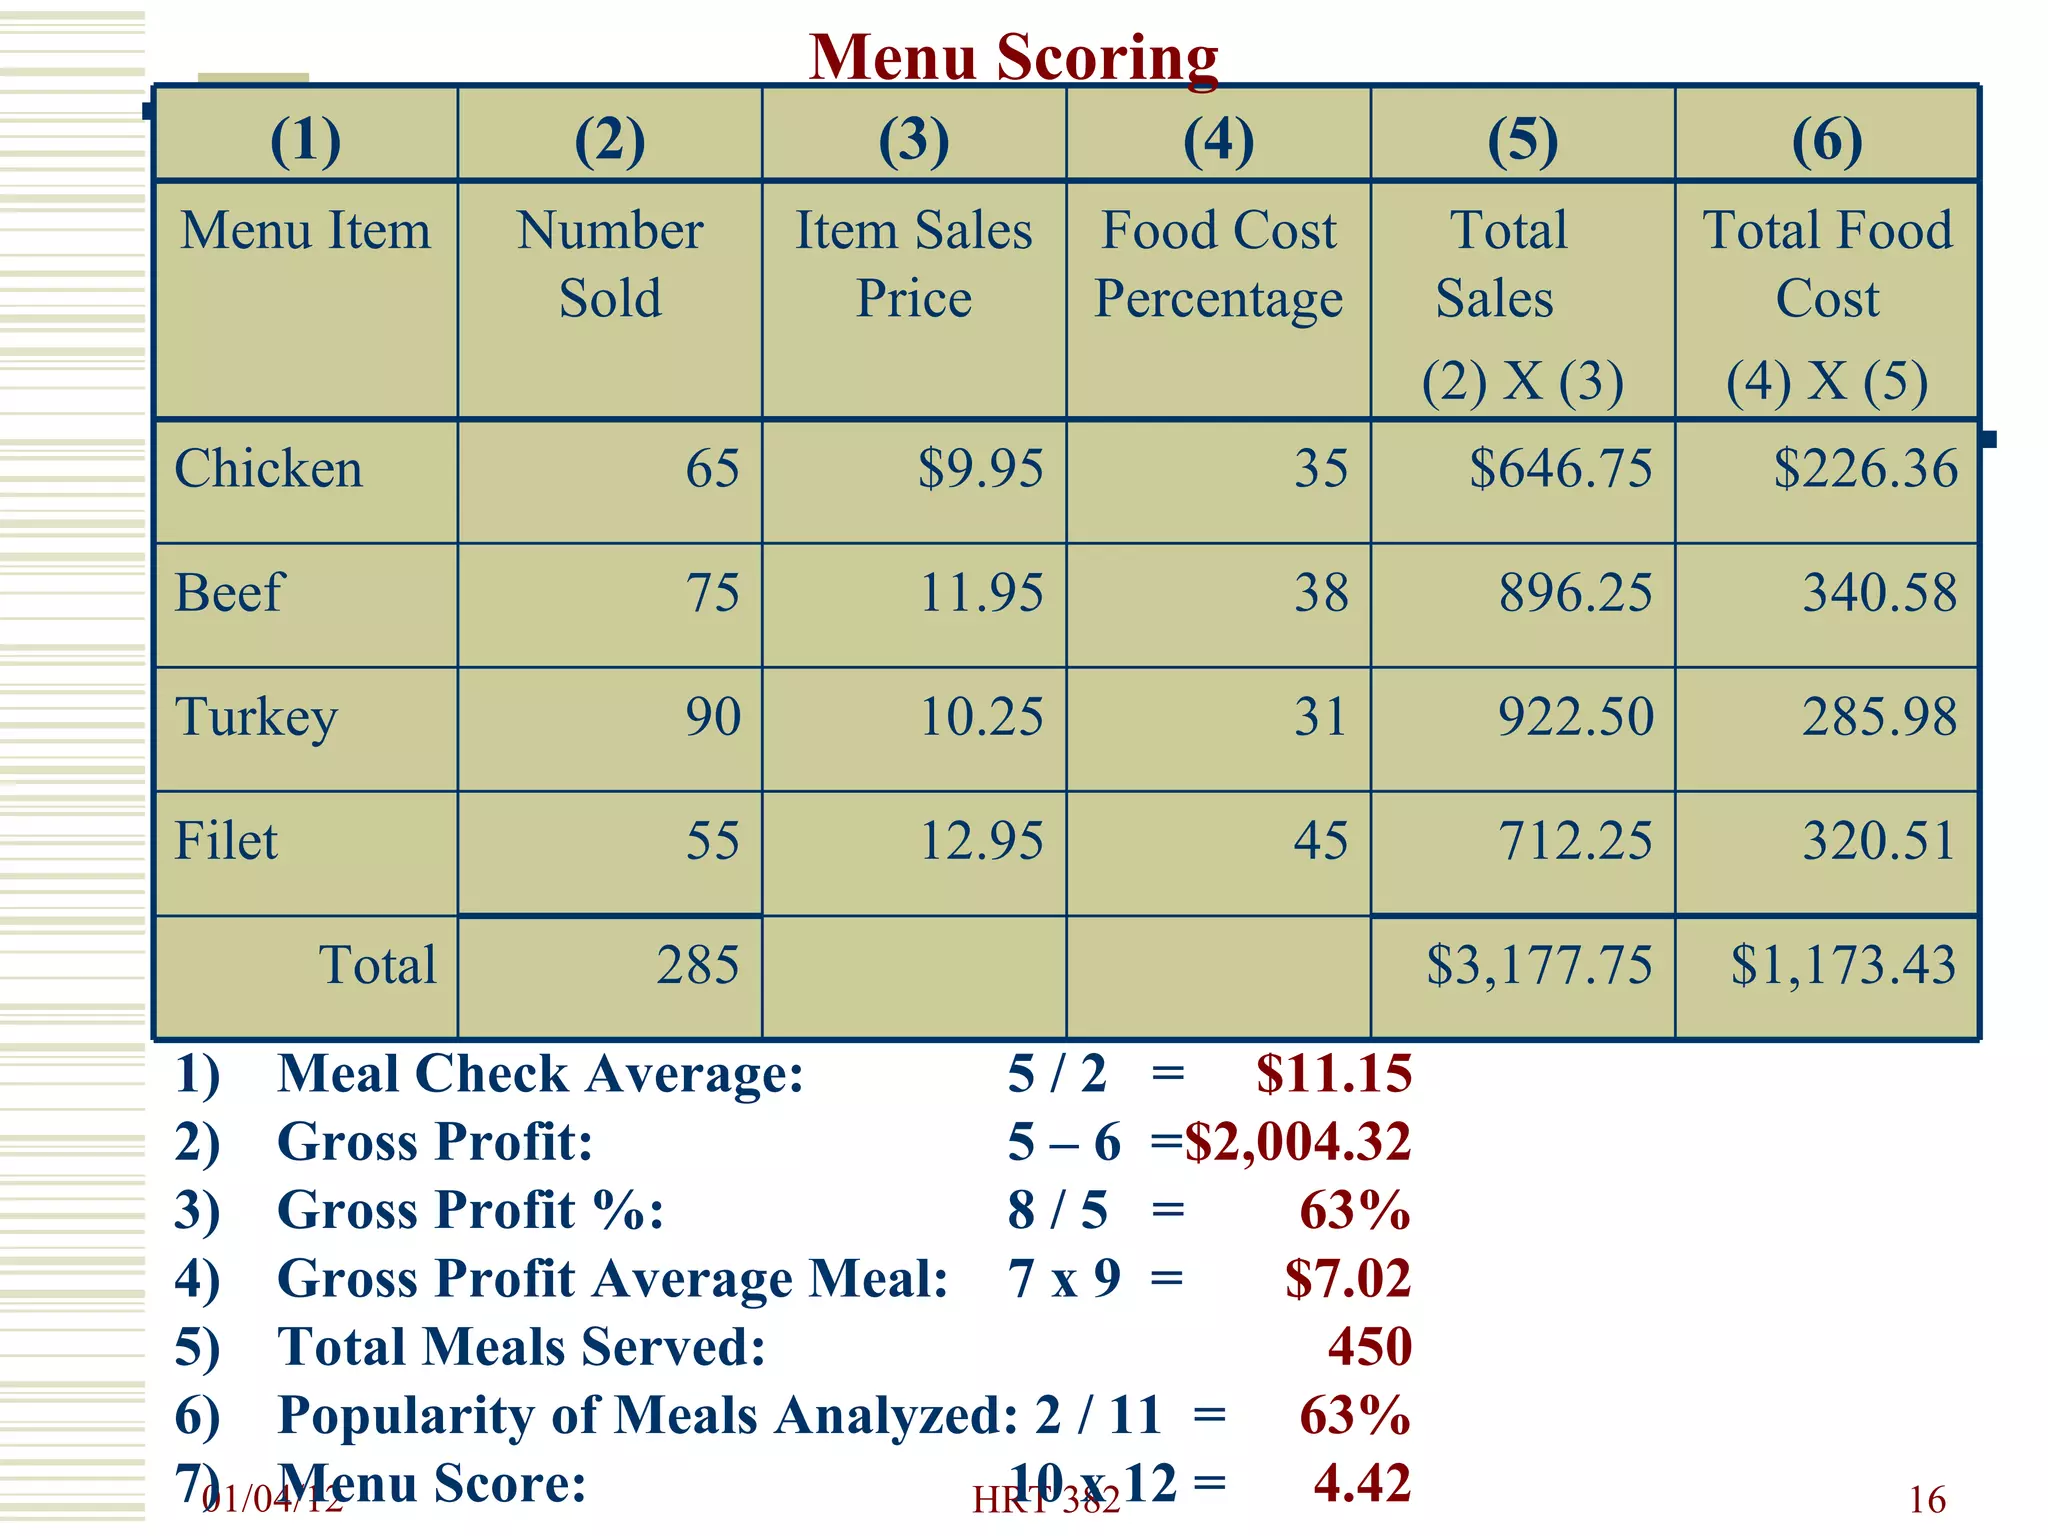
Downloaded 395 times

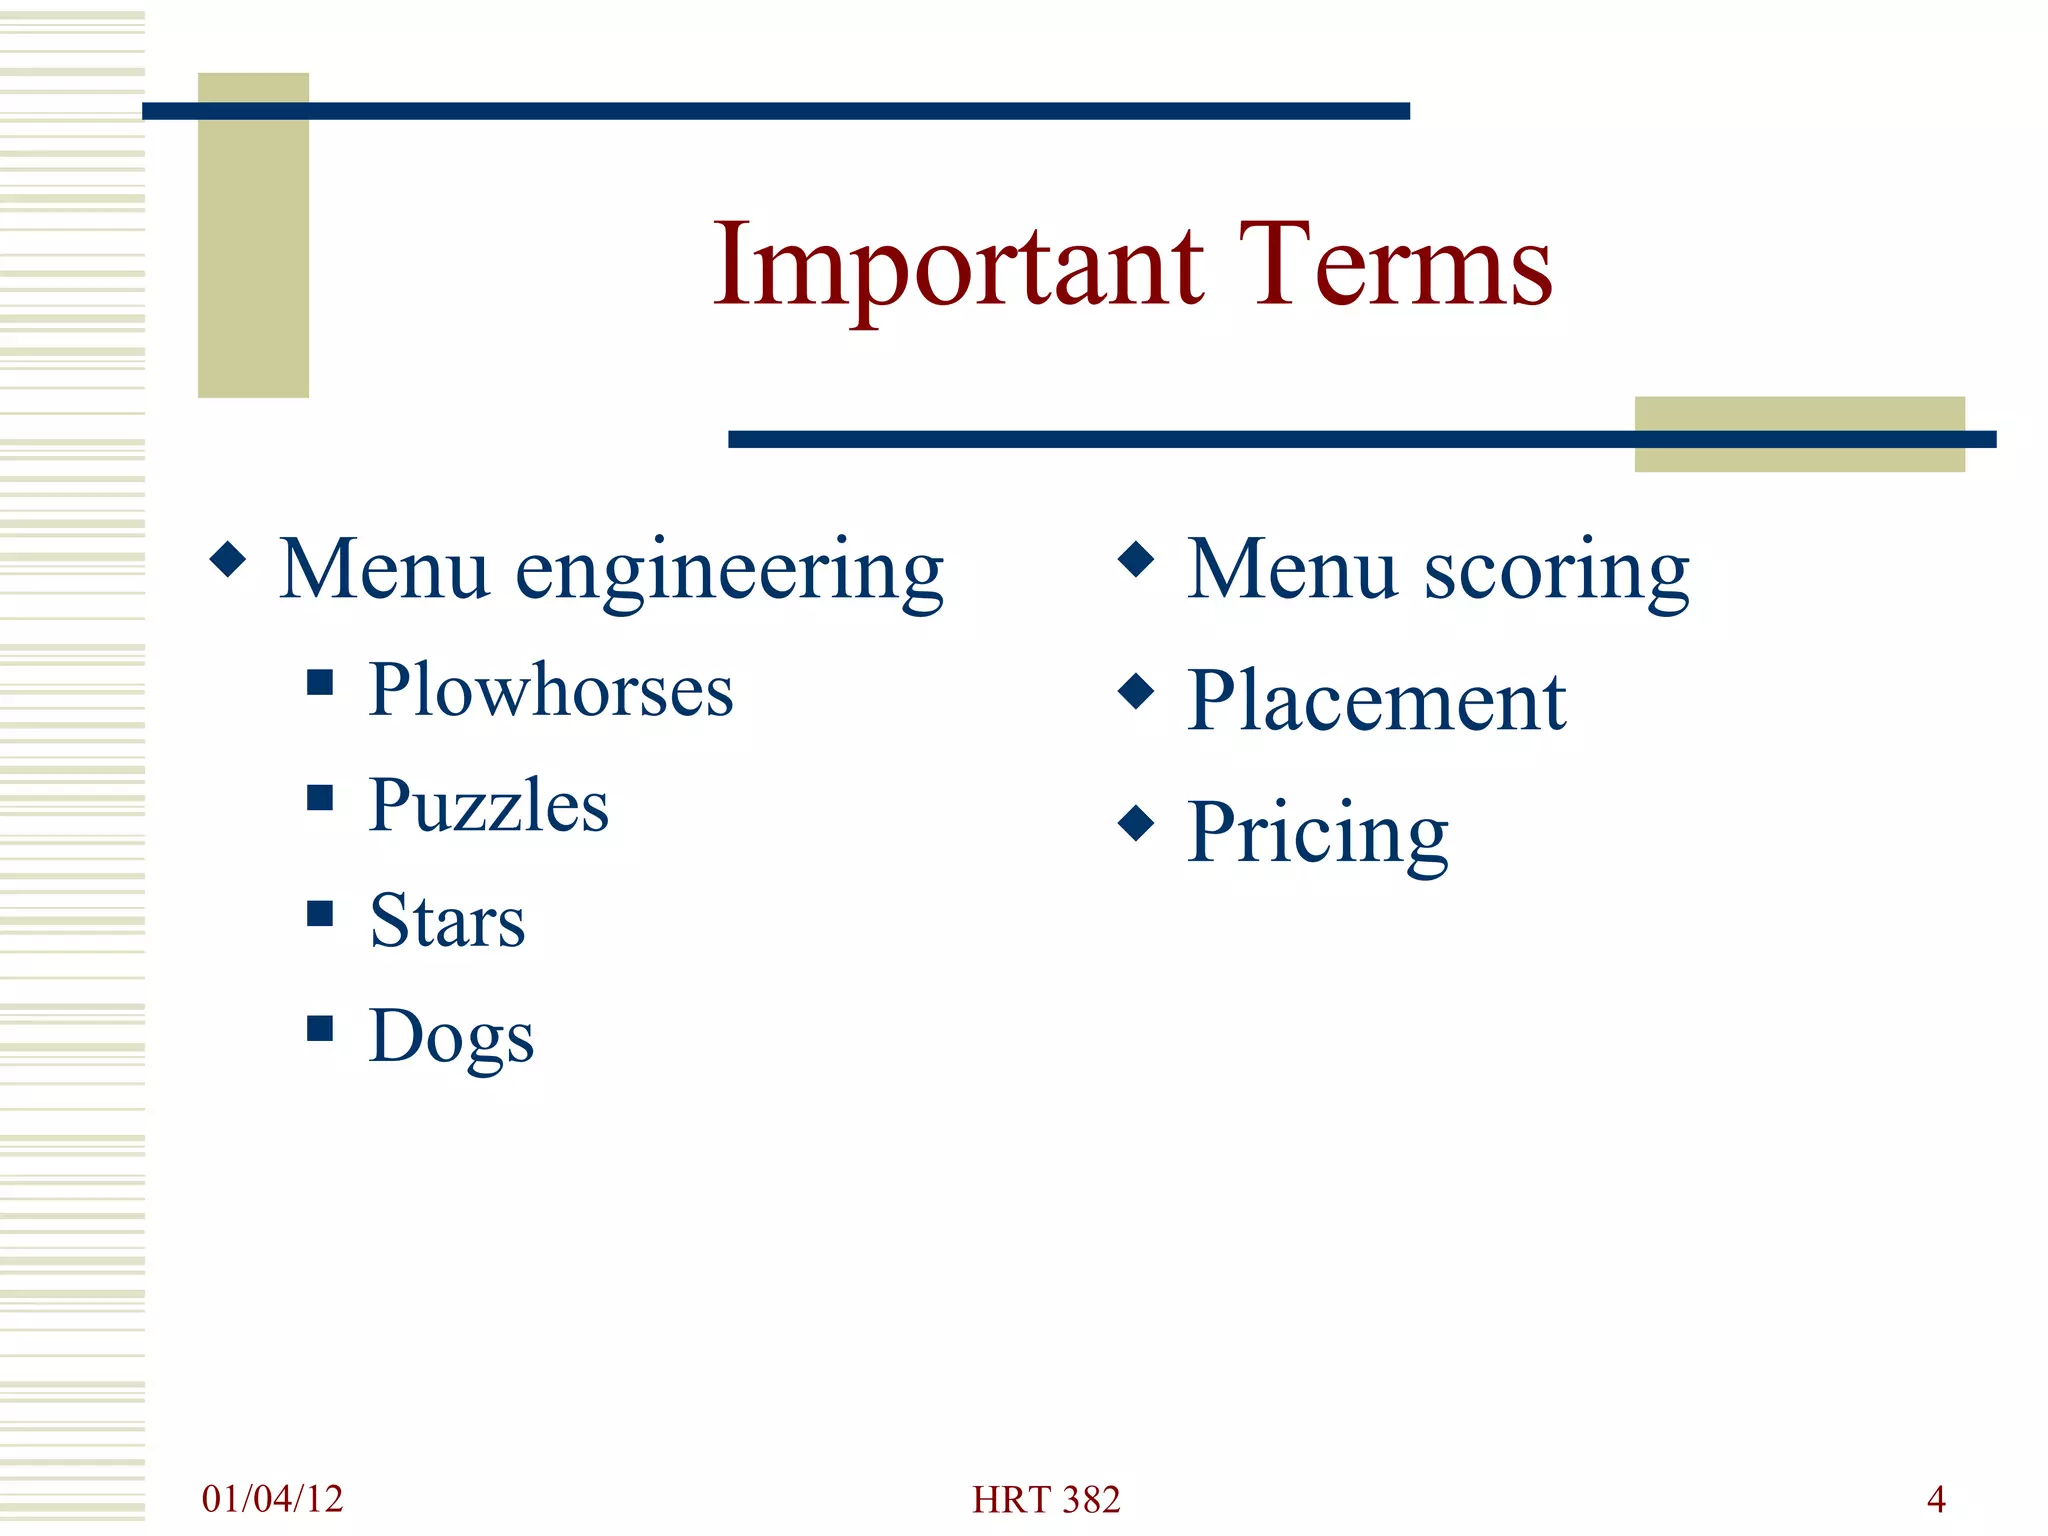
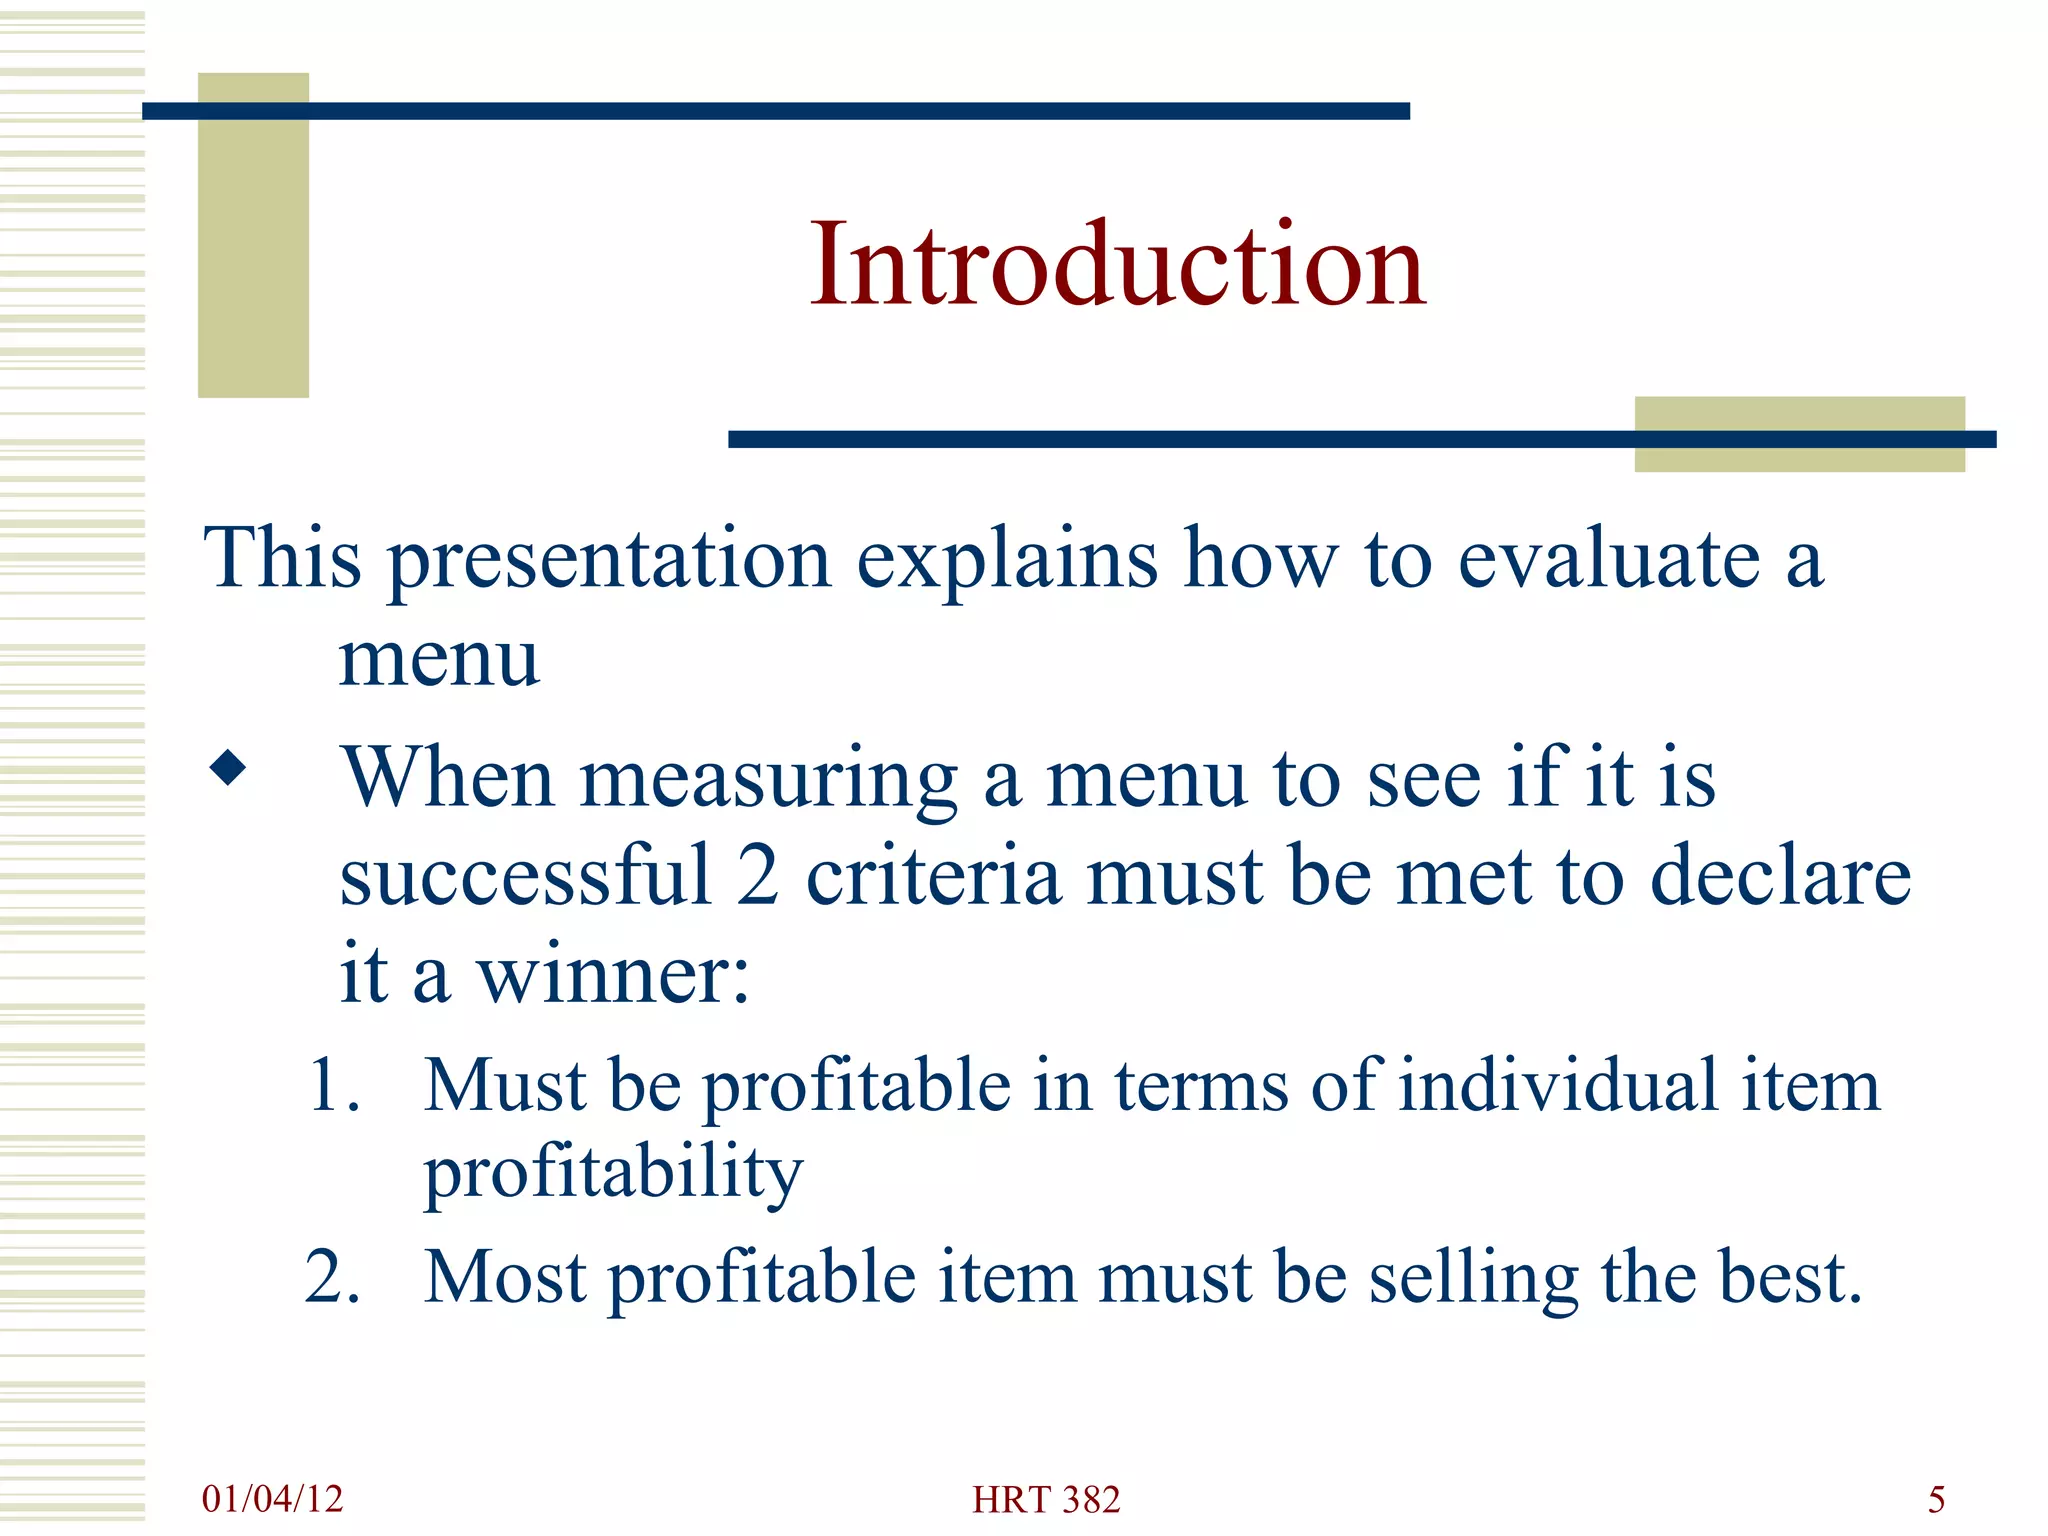
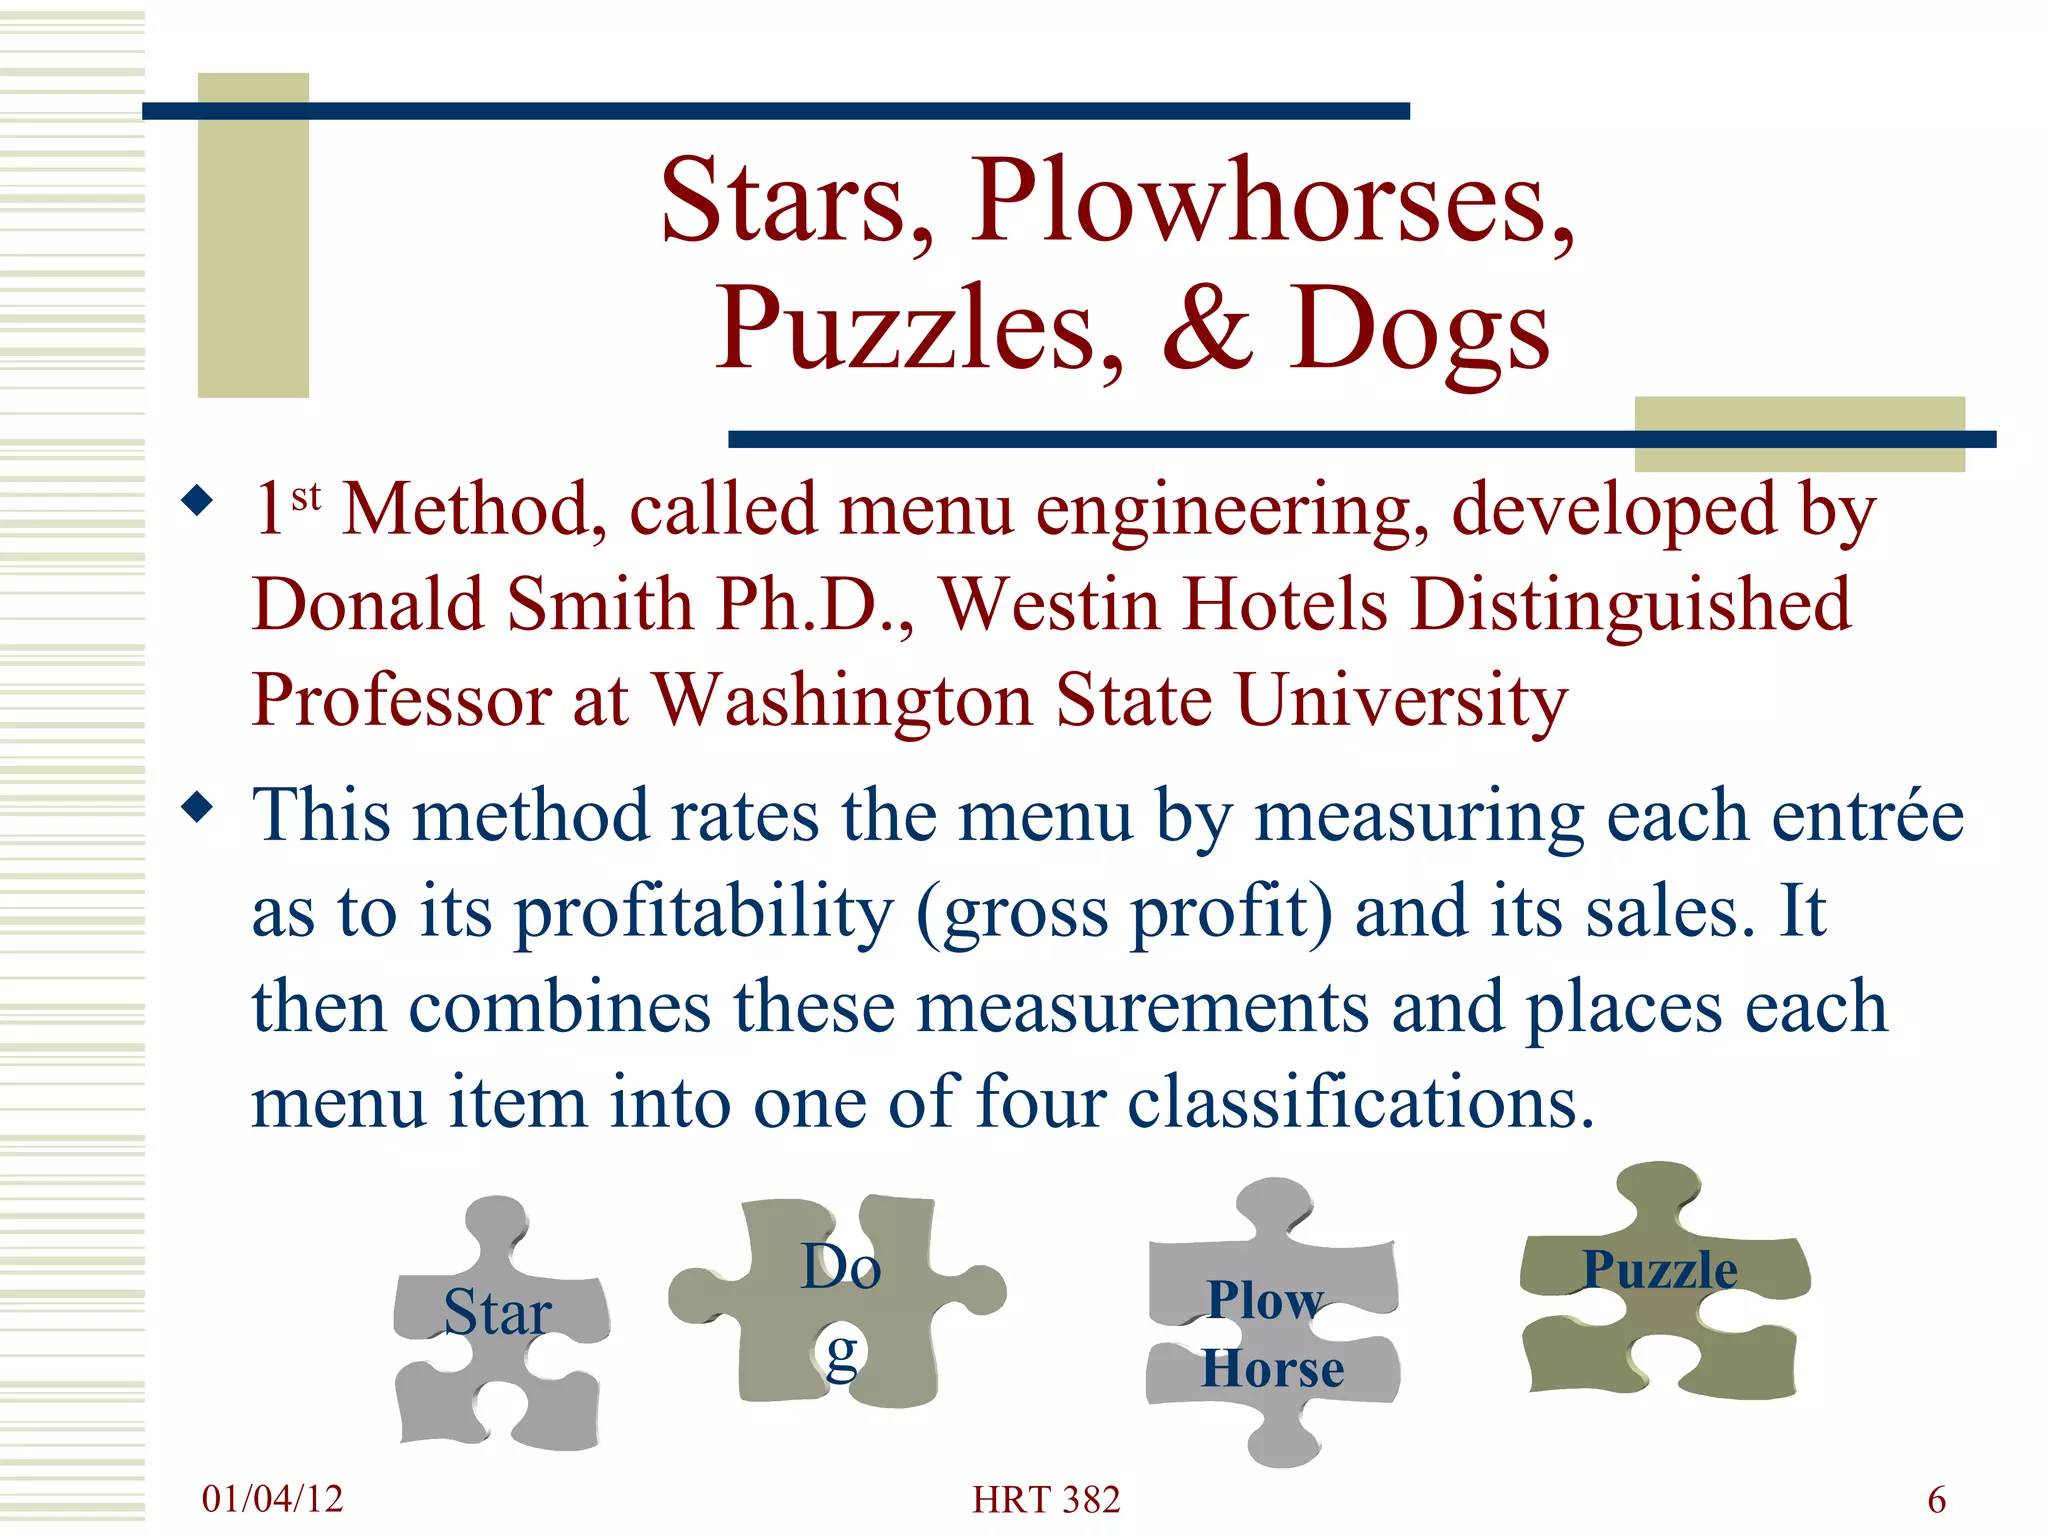
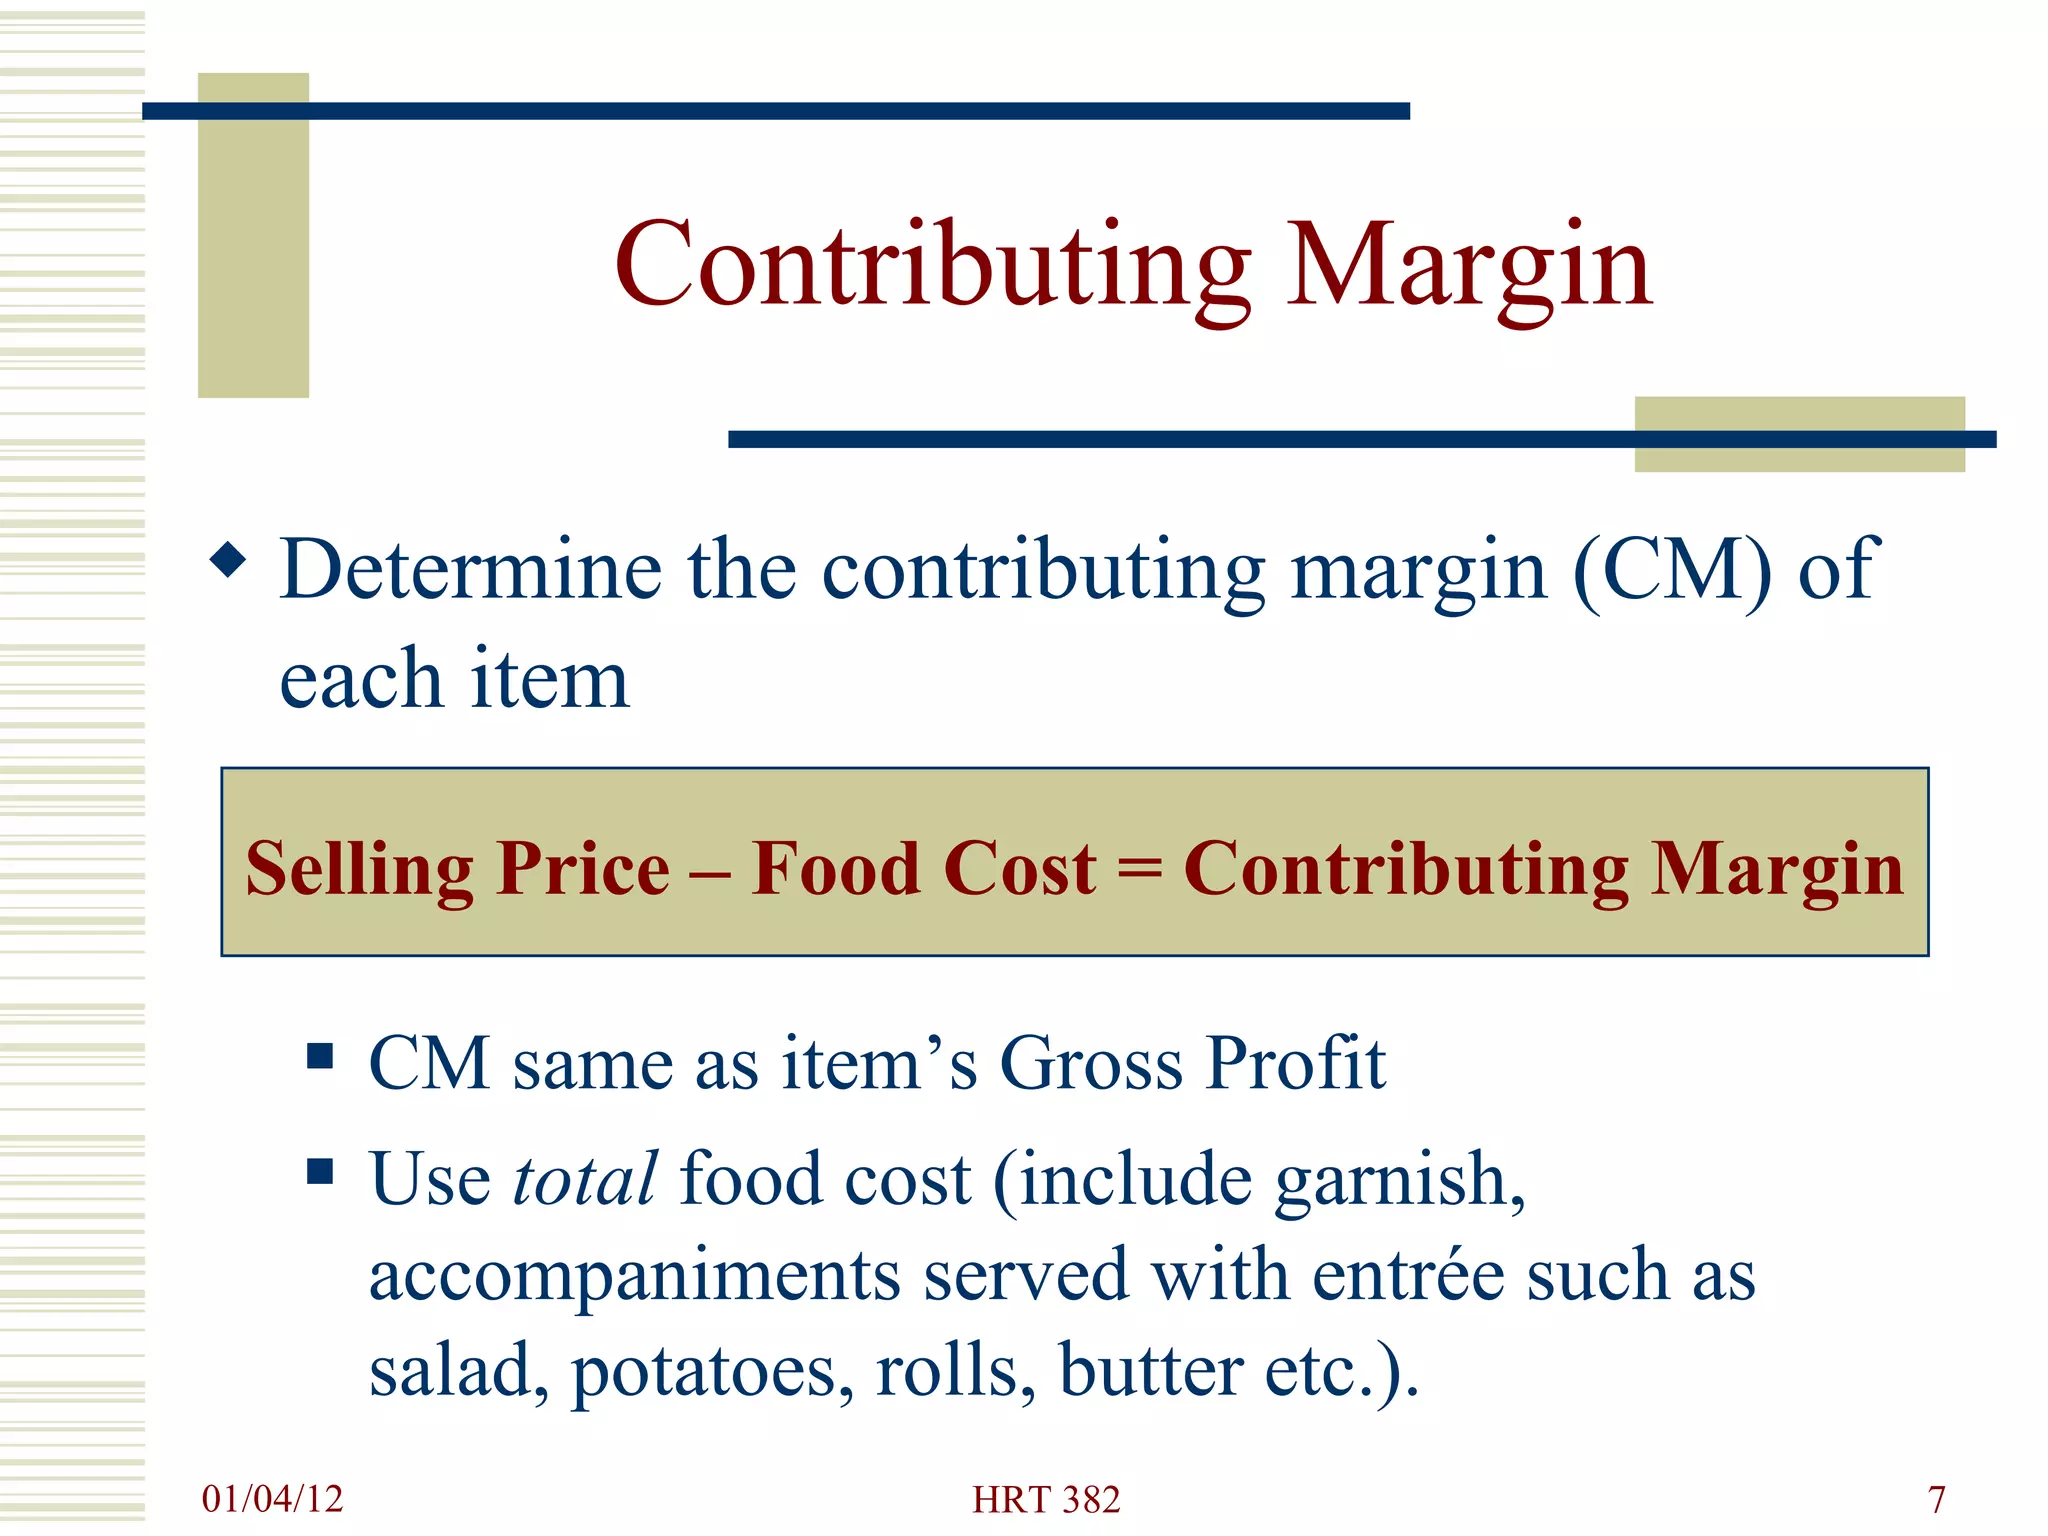
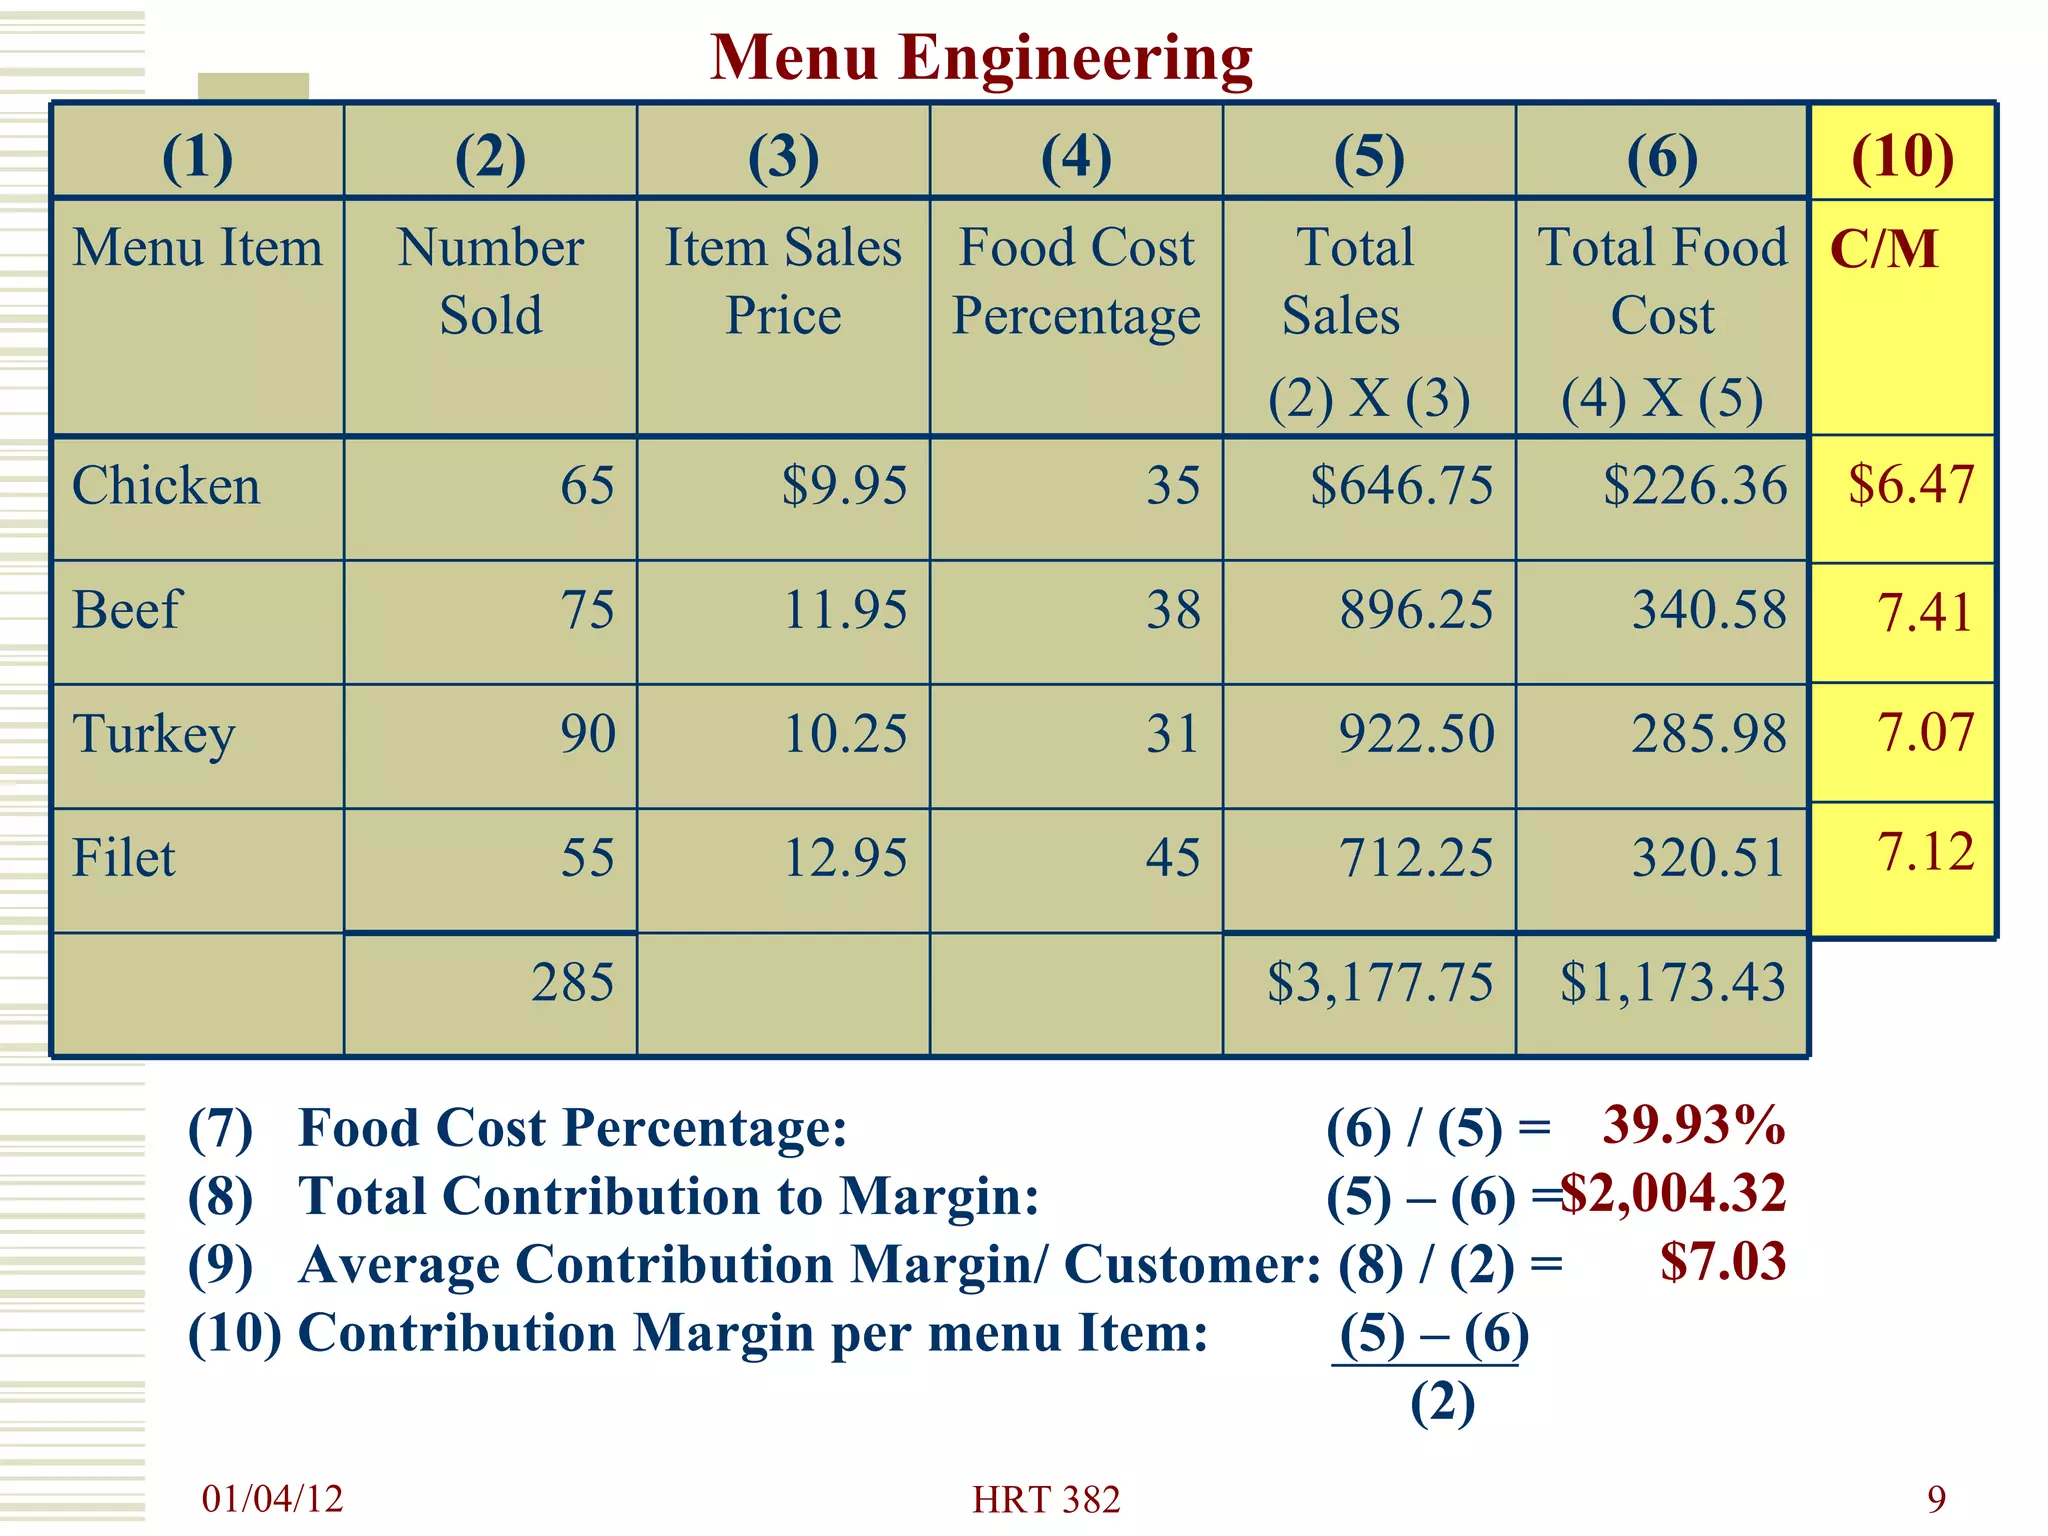
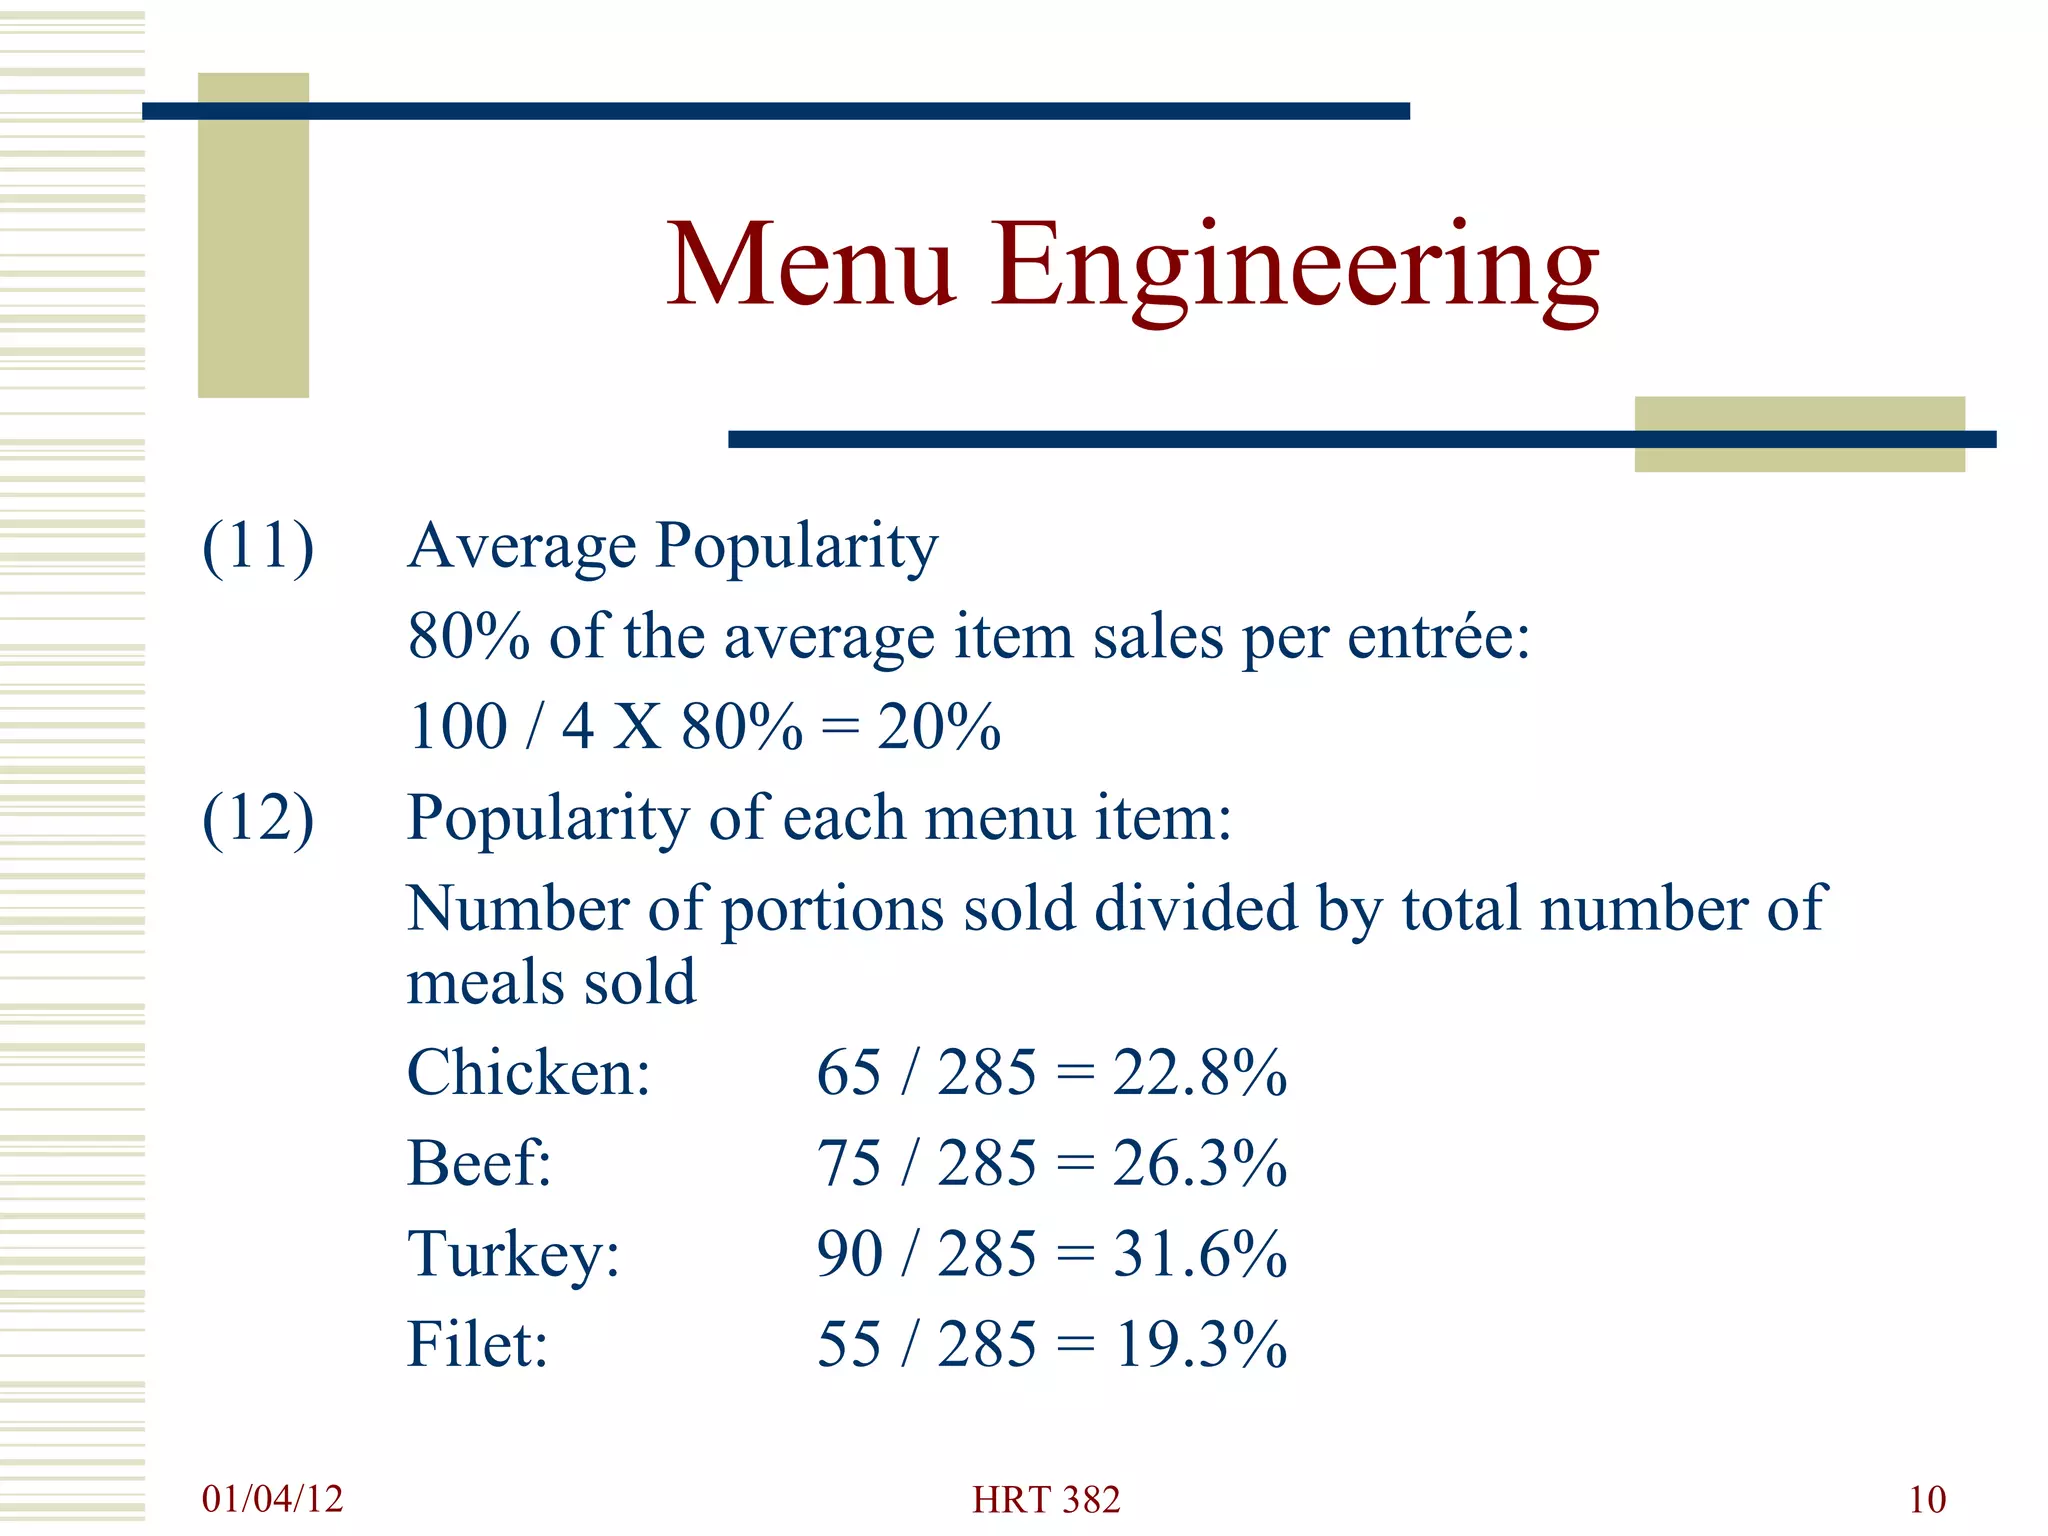
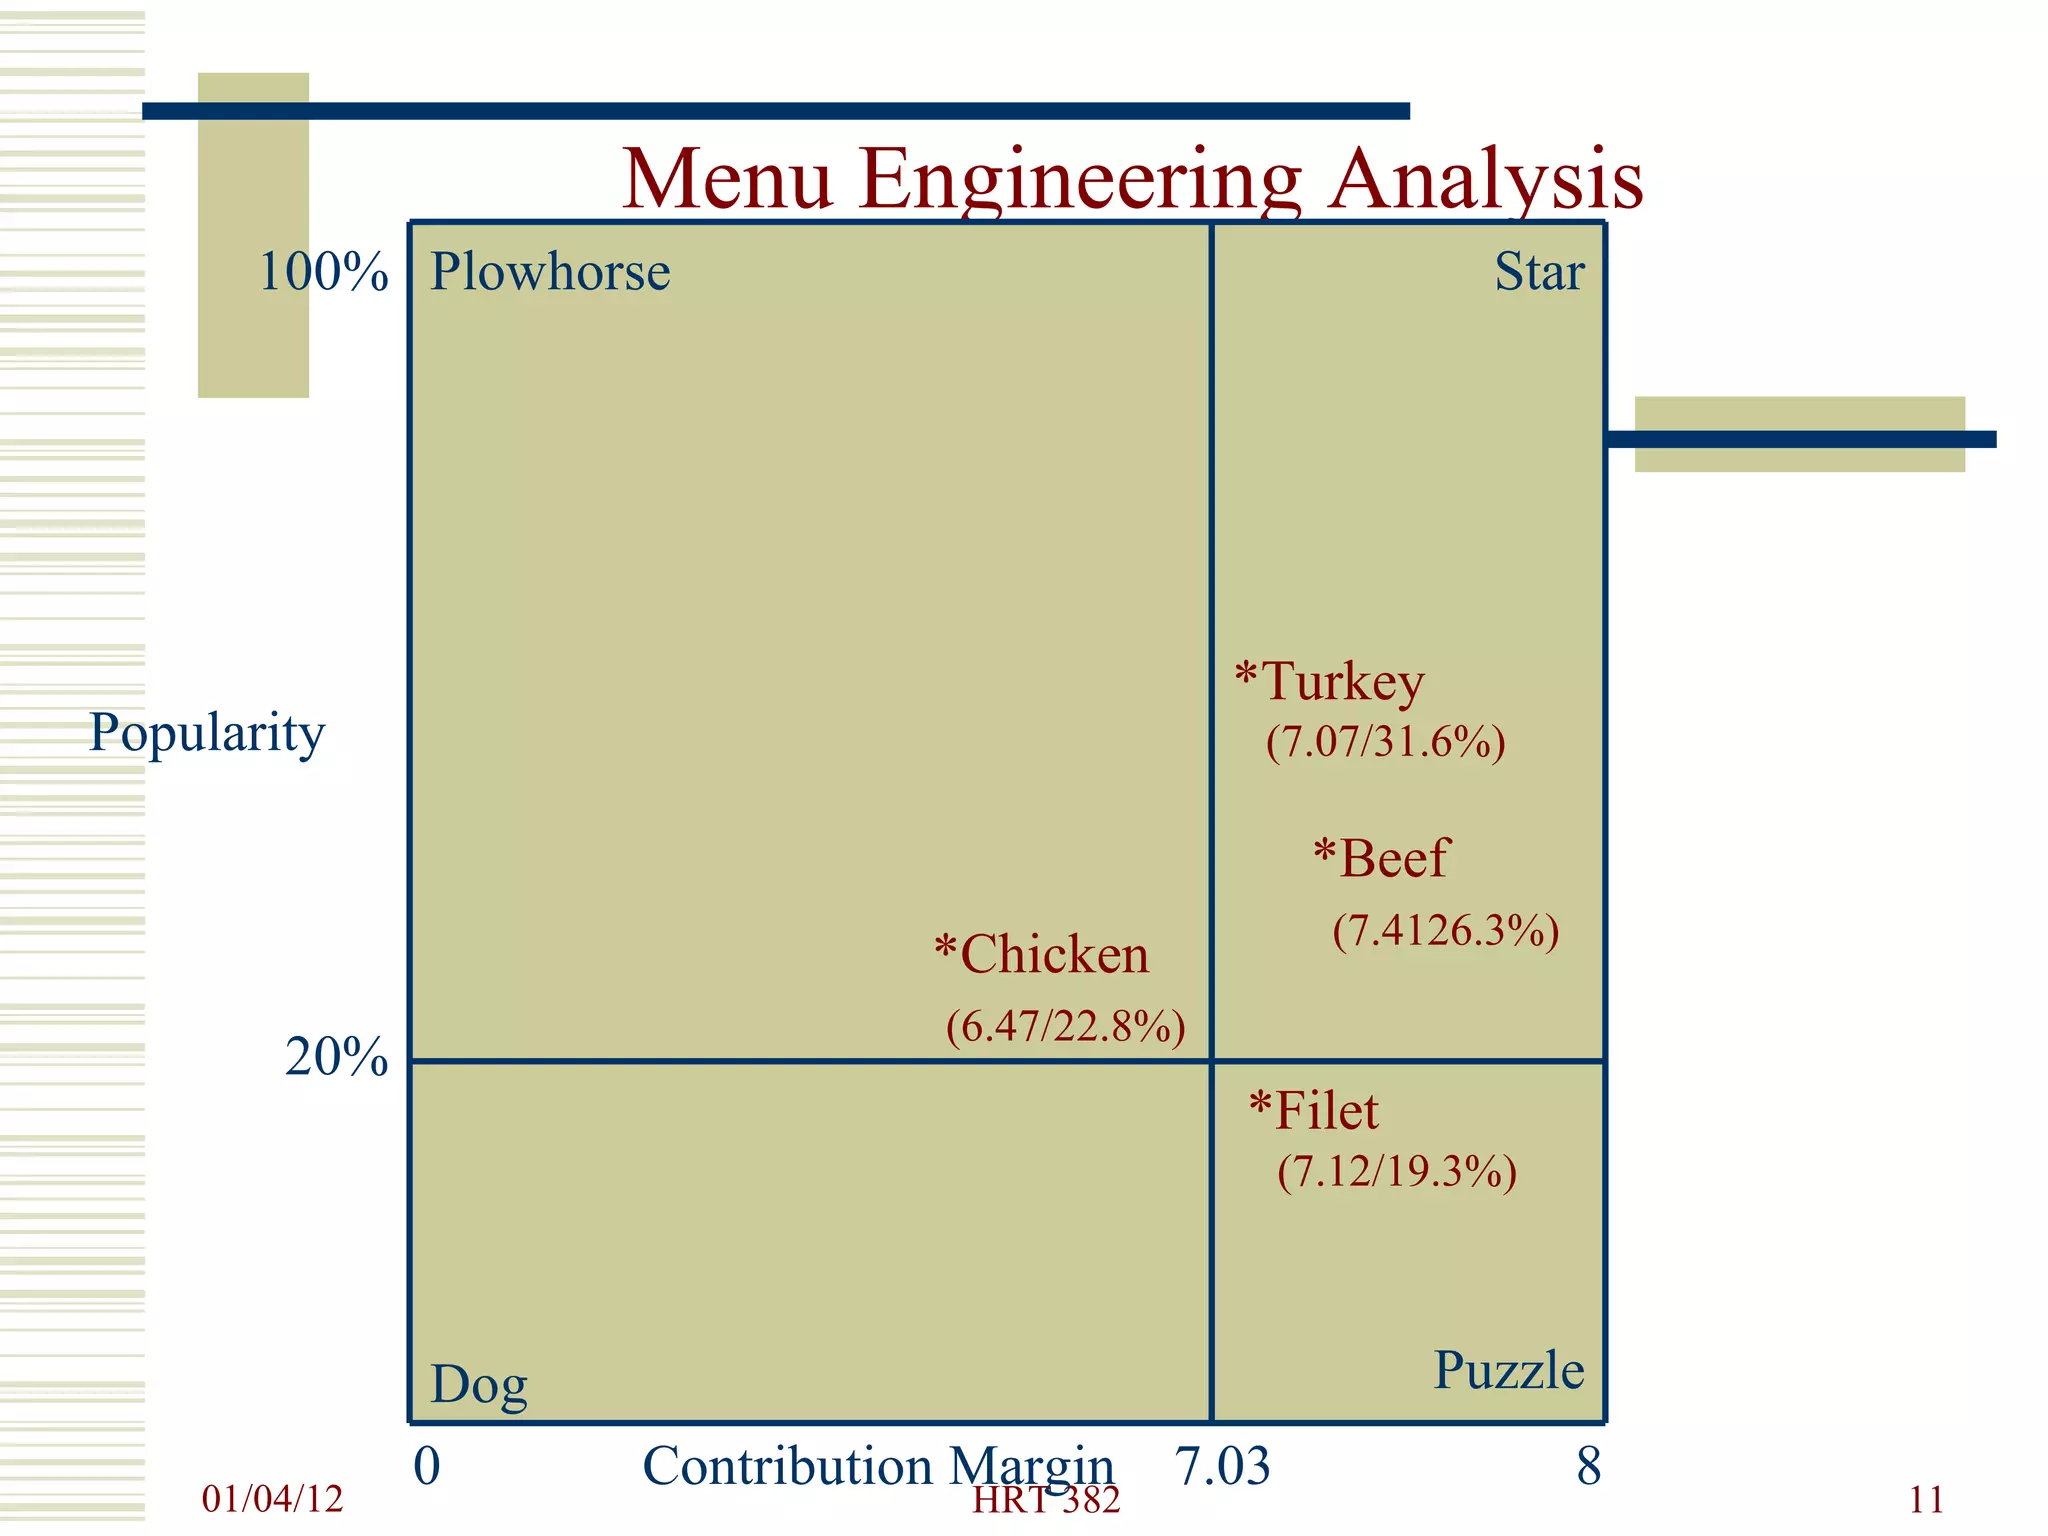
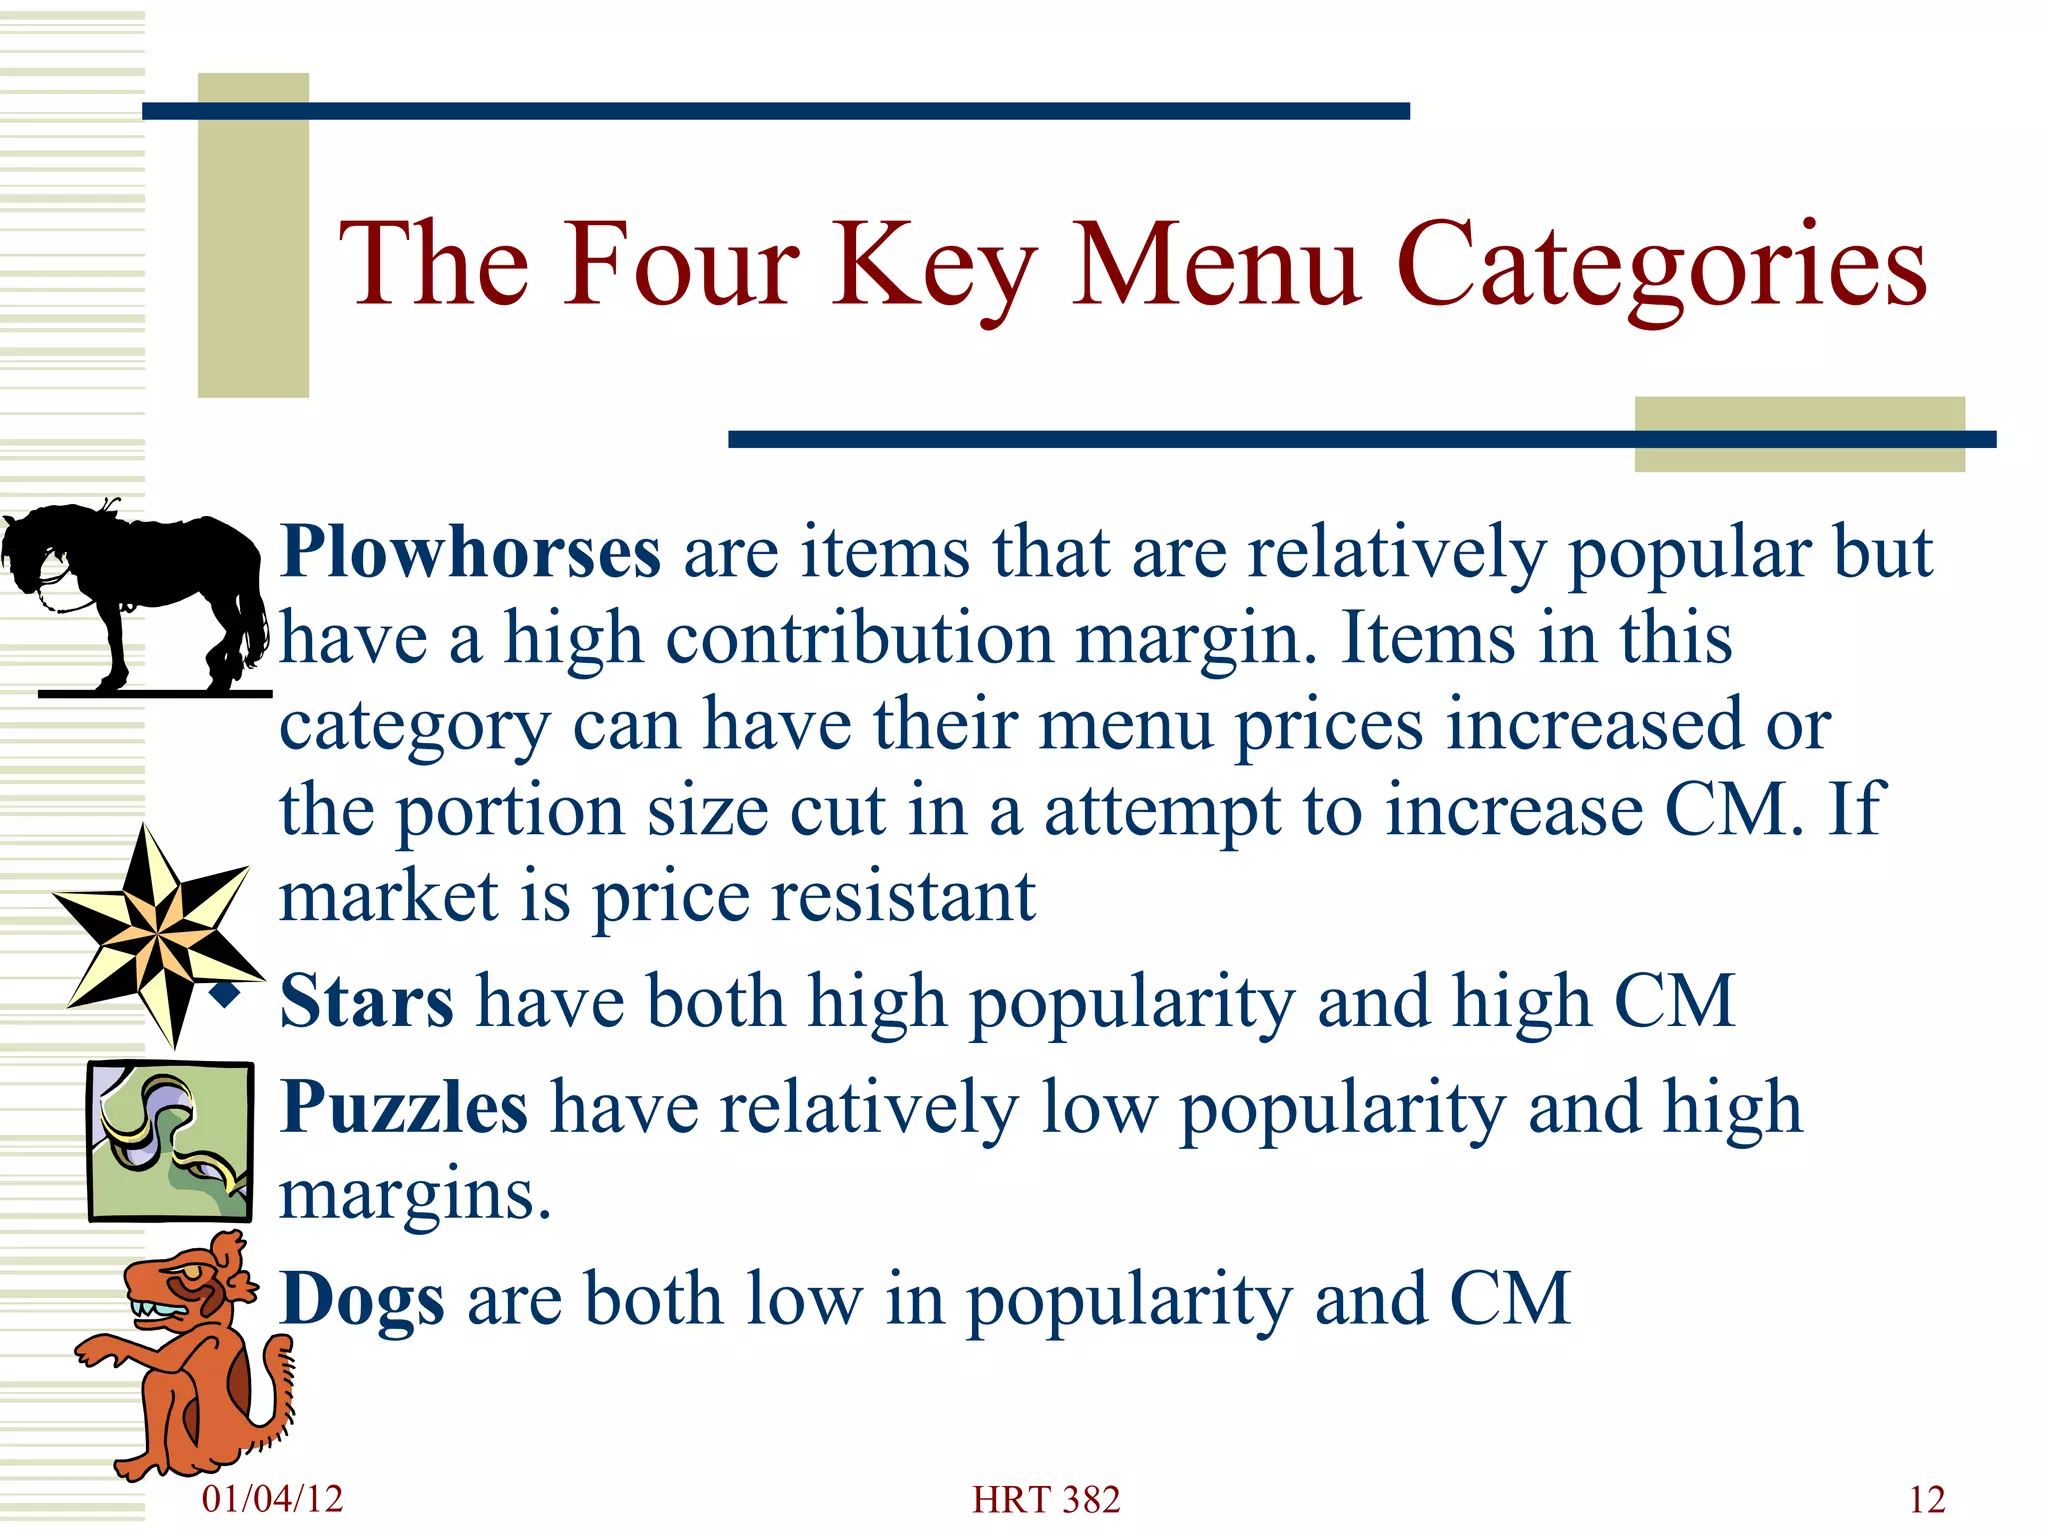


This document discusses methods for analyzing and engineering menus to maximize profitability. It describes two key methods - menu engineering and menu scoring. Menu engineering involves categorizing menu items as stars, plowhorses, puzzles or dogs based on their profitability and popularity. Menu scoring combines profitability and popularity into a single score to compare existing and proposed menus. The document provides details on how to apply these methods and highlights other factors like placement, pricing and use of focal points to optimize a menu.