This paper provides a review of automating or semi-automating the seed quality
purity test. Computer vision (CV) technology used in variety of industries is a sophisticated
type of inspection technology; however, it is not widely used in agriculture.The application
of CV technologies is very challenging in agriculture. As CV plays an important role in this
domain, research in this area has been motivated. Several theories of automating seed
quality purity test are briefly mentioned. The reviewed approaches are classified according
to features and classifiers. The methods for extracting features of a particular seed, and the
classifiers used for classifying the seeds, are mentioned in the paper. An overview of the
most representative methods for feature extraction and classification of seeds is presented.
The major goal of the paper is to provide a comprehensive reference source for the
researchers involved in automation of seed classification, regardless of particular feature or
classifier.
International Journal of Engineering Research and Applications (IJERA) is an open access online peer reviewed international journal that publishes research and review articles in the fields of Computer Science, Neural Networks, Electrical Engineering, Software Engineering, Information Technology, Mechanical Engineering, Chemical Engineering, Plastic Engineering, Food Technology, Textile Engineering, Nano Technology & science, Power Electronics, Electronics & Communication Engineering, Computational mathematics, Image processing, Civil Engineering, Structural Engineering, Environmental Engineering, VLSI Testing & Low Power VLSI Design etc.
Seed morphometric studies of some Kenaf ( Hibiscus canabinus ) accessions researchagriculture
Fifteen kenaf lines collected from kenaf and Jute Improvement Programme
of Institute of Agricultural Research and Training (I.A.R.& T.) were subjected to digital
imaging analysis using USB microscope with digital imaging software (Veho™ UK) and
Vernier caliper to study the seed morphometric of available kenaf accession and the
possibility of using the morphometric data to determine variations between the
accessions. Ten seeds in four replicates of each seed lot were randomly selected and
measurement of the seed length, seed width, seed angle and seed thickness were
taken. The measurements were inputted and saved into Microsoft excel from where
the mean value of each parameters were calculated for each replicates. Data were
subjected to Analysis of variance, correlation analysis, principal component analysis
and clustering analysis. Variation exit among seed of kenaf accessions though they
had similar microscopic appearance features. Seed area, which was a function of seed
length and seed width contributed largely to the variation that exist between the seed
of kenaf accessions. Accession HC
-
583
-
31
2
, clearly distinguished itself from others and
therefore can be used in parent selection during breeding programmes. The inclusion
of this seed morphometrics trait in taxonomic description of kenaf is recommended to
increase the accuracy of morphological classification of kenaf.
Classify Rice Disease Using Self-Optimizing Models and Edge Computing with A...Damian R. Mingle, MBA
Rice continues to be a primary food for the world’s population. Over its complex history, dating as far back as 8,000 B.C., there have been agricultural challenges, such as a variety of diseases. A consequence of disease in rice plants may lead to no harvest of grain; therefore, detecting disease early and providing expert remedies in a low-cost solution is highly desirable. In this article, we study a pragmatic approach for rice growers to leverage artificial intelligence solutions that reduce cost, increase speed, improve ease of use, and increase model performance over other solutions, thereby directly impacting field operations. Our method significantly improves upon prior methods by combining automated feature extraction for image data, exploring thousands of traditional machine learning configurations, defining a search space for hyperparameters, deploying a model using edge computing field usability, and suggesting remedies for rice growers. These results prove the validity of
the proposed approach for rice disease detection and treatments.
Offers timely update and close follow-up of China’s seed industry dynamics, analyzes market data and finds out factors influencing market development.
It is published monthly by CCM International Limited, which brings you the latest information upon various factors related to China’s seed industry, such as company dynamics, new technology and varieties, market analysis and etc. China’s seed industry has huge market opportunity, high gross profit rate and considerable investment returns. This news helps you find out market potential and opportunities of seed industry.
Er. Uttam Raj Timilsina(MSc.Engineering,IIT Roorkee)
Professor of Agricultural Engineering,Agriculture and Forestry University (AFU), Rampur, Chitwan, Nepal
uttamrajtimilsina@gmail.com
*All Right Reserved**
Uploaded and Shared by AgriYouthNepal
Precision agriculture relies heavily on information technology, which also aids agronomists in their work.
Weeds usually grow alongside crops, reducing the production of that crop. Weeds are controlled by herbicides. The pesticide may harm the crop as well if the type of weed isn’t identified. In order to control weeds on farms, it is required to identify and classify them. Convolutional Network or CNN, a deep learning-based computer vision technology, is used to evaluate images. A methodology is proposed to detect weed using convolutional neural networks.
There were two primary phases in this proposed methodology. The first phase is image collection and labeling, in which the features for images to be labeled for the base images are extracted. In second phase to build the convolutional neural network model is constructed by 20 layers to detect the weed. CNN architecture has three layers
namely convolutional layer, pooling layer and dense layer. The input image is given to convolutional layer to extract the features from the image. The features are given to pooling layer to compress the image to reduce the computational complexity. The dense layer is used for final classification. The performance of the proposed methodology is assessed using agricultural dataset images taken from Kaggle database.
A MACHINE LEARNING METHOD FOR PREDICTION OF YOGURT QUALITY AND CONSUMERS PREF...mlaij
Prediction of quality and consumers’ preferences is essential task for food producers to improve their
market share and reduce any gap in food safety standards. In this paper, we develop a machine learning
method to predict yogurt preferences based on the sensory attributes and analysis of samples’ images
using image processing texture and color feature extraction techniques. We compare three unsupervised
ML feature selection techniques (Principal Component Analysis and Independent Component Analysis and
t-distributed Stochastic Neighbour Embedding) with one supervised ML feature selection technique
(Linear Discriminant Analysis) in terms of accuracy of classification. Results show the efficiency of the
supervised ML feature selection technique over the traditional feature selection techniques.
Thai Hom Mali rice grading using machine learning and deep learning approachesIAESIJAI
Thai Jasmine rice or Thai Hom Mali rice is a well-known rice type that
originated in Thailand. Rice grain qualities are important in determining
market pricing and are used in grading systems. The purpose of this research
is to use machine learning and deep learning to improve the grading of Thai
Hom Mali rice following standardized grading criteria. The appearance of
grains and foreign items will determine the grade of rice. The experiment
has two parts: grain categorization and rice grading. Multi-class support
vector machine (SVM) and convolutional neural network (CNN) are
proposed. There are 15 features used as input for multi-class SVM, including
morphology and color features. With ImageNet pre-trained weights, CNN
with DenseNet201 architecture is implemented. The experiment also tested
into how CNN worked with both original and preprocessed images. The
results are then compared to a neural network (NN) baseline approach. The
CNN approach, which identified each rice variety using preprocessed
images, archieved the greatest accuracy rate of 98.25%, with an average
accuracy of 94.52% across six categories of rice grading.
Identification and Classification of Leaf Diseases in Turmeric PlantsIJERA Editor
Plant disease identification is the most important sector in agriculture. Turmeric is one of the important
rhizomatous crops grown in India. The turmeric leaf is highly exposed to diseases like rhizome rot, leaf spot,
and leaf blotch. The identification of plant diseases requires close monitoring and hence this paper adopts
technologies to manage turmeric plant diseases caused by fungi to enable production of high quality crop yields.
Various image processing and machine learning techniques are used to identify and classify the diseases in
turmeric leaf. The dataset with 800 leaf images of different categories were pre-processed and segmented to
promote efficient feature extraction. Machine learning algorithms like support vector machine, decision tree and
naïve bayes were applied to train the model. The performance of the model was evaluated using 10 fold cross
validation and the results are reported.
Precision agriculture relies heavily on information technology, which also aids agronomists in their work. Weeds usually grow alongside crops, reducing the production of that crop. They are controlled by herbicides. The pesticide may harm the crop as well if the type of weed is not identified. To control weeds on farms, it is required to identify and classify them. A convolutional network or CNN, a deep learning-based computer vision technology, is used to evaluate images. A methodology is proposed to detect weeds using convolutional neural networks. There were two primary phases in this proposed methodology. The first phase is image collection and labeling, in which the features for images to be labeled for the base images are extracted. In the second phase, the convolutional neural network model is constructed by 20 layers to detect the weed. CNN architecture has three layers, namely, the convolutional layer, the pooling layer, and the dense layer. The input image is given to a convolutional layer to extract the features from the image. The features are given to the pooling layer to compress the image to reduce the computational complexity. The dense layer is used for final classification. The performance of the proposed methodology is assessed using agricultural dataset images taken from the Kaggle database.
Similar to 528Seed Technological Development – A Survey (20)
Now-a-days, Internet has become an important part of human’s life, a person
can shop, invest, and perform all the banking task online. Almost, all the organizations have
their own website, where customer can perform all the task like shopping, they only have to
provide their credit card details. Online banking and e-commerce organizations have been
experiencing the increase in credit card transaction and other modes of on-line transaction.
Due to this credit card fraud becomes a very popular issue for credit card industry, it causes
many financial losses for customer and also for the organization. Many techniques like
Decision Tree, Neural Networks, Genetic Algorithm based on modern techniques like
Artificial Intelligence, Machine Learning, and Fuzzy Logic have been already developed for
credit card fraud detection. In this paper, an evolutionary Simulated Annealing algorithm is
used to train the Neural Networks for Credit Card fraud detection in real-time scenario.
This paper shows how this technique can be used for credit card fraud detection and
present all the detailed experimental results found when using this technique on real world
financial data (data are taken from UCI repository) to show the effectiveness of this
technique. The algorithm used in this paper are likely beneficial for the organizations and
for individual users in terms of cost and time efficiency. Still there are many cases which are
misclassified i.e. A genuine customer is classified as fraud customer or vise-versa.
Wireless sensor networks (WSN) have been widely used in various applications.
In these networks nodes collect data from the attached sensors and send their data to a base
station. However, nodes in WSN have limited power supply in form of battery so the nodes
are expected to minimize energy consumption in order to maximize the lifetime of WSN. A
number of techniques have been proposed in the literature to reduce the energy
consumption significantly. In this paper, we propose a new clustering based technique
which is a modification of the popular LEACH algorithm. In this technique, first cluster
heads are elected using the improved LEACH algorithm as usual, and then a cluster of
nodes is formed based on the distance between node and cluster head. Finally, data from
node is transferred to cluster head. Cluster heads forward data, after applying aggregation,
to the cluster head that is closer to it than sink in forward direction or directly to the sink.
This reduction in distance travelled improves the performance over LEACH algorithm
significantly.
The next generation wireless networks comprises of mobile users moving
between heterogeneous networks, using terminals with multiple access interfaces and
services. The most important issue in such environment is ABC (Always Best Connected) i.e.
allowing the best connectivity to applications anywhere at any time. For always best
connectivity requirement various vertical handover strategies for decision making have
been proposed. This paper provides an overview of the most interesting and recent
strategies.
This paper presents the design and performance comparison of a two stage
operational amplifier topology using CMOS and BiCMOS technology. This conventional op
amp circuit was designed by using RF model of BSIM3V3 in 0.6 μm CMOS technology and
0.35 μm BiCMOS technology. Both the op amp circuits were designed and simulated,
analyzed and performance parameters are compared. The performance parameters such as
gain, phase margin, CMRR, PSRR, power consumption etc achieved are compared. Finally,
we conclude the suitability of CMOS technology over BiCMOS technology for low power
RF design.
In Cognitive Radio Networks (CRN), Cooperative Spectrum Sensing (CSS) is
used to improve performance of spectrum sensing techniques used for detection of licensed
(Primary) user’s signal. In CSS, the spectrum sensing information from multiple unlicensed
(Secondary) users are combined to take final decision about presence of primary signal. The
mixing techniques used to generate final decision about presence of PU’s signal are also
called as Fusion techniques / rules. The fusion techniques are further classified as data
fusion and decision fusion techniques. In data fusion technique all the secondary users
(SUs) share their raw information of spectrum detection like detected energy or other
statistical information, while in decision fusion technique all the SUs take their local
decisions and share the decision by sending ‘0’ or ‘1’ corresponding to absence and presence
of PU’s signal respectively. The rules used in decision fusion techniques are OR rule, AND
rule and K-out-of-N rule. The CSS is further classified as distributed CSS and centralized
CSS. In distributed CSS all the SUs share the spectrum detection information with each
other and by mixing the shared information; all the SUs take final decision individually. In
centralized CSS all the SUs send their detected information to a secondary base station /
central unit which combines the shared information and takes final decision. The secondary
base station shares the final decision with all the SUs in the CRN. This paper covers
overview of information fusion methods used for CSS and analysis of decision fusion rules
with simulation results.
ZigBee has been developed to support lower data rates and low power consuming
applications. This paper targets to analyze various parameters of ZigBee physical (PHY).
Performance of ZigBee PHY is evaluated on the basis of energy consumption in
transmitting and receiving mode and throughput. Effect of variation in network size is
studied on these performance attributes. Some modulation schemes are also compared and
the best modulation scheme is suggested with tradeoffs between different performance
metrics.
This paper gives a brief idea of the moving objects tracking and its application.
In sport it is challenging to track and detect motion of players in video frames. Task
represents optical flow analysis to do motion detection and particle filter to track players
and taking consideration of regions with movement of players in sports video. Optical flow
vector calculation gives motion of players in video frame. This paper presents improved
Luacs Kanade algorithm explained for optical flow computation for large displacement and
more accuracy in motion estimation.
A rapid progress is seen in the field of robotics both in educational and industrial
automation sectors. The Robotics education in particular is gaining technological advances
and providing more learning opportunities. In automotive sector, there is a necessity and
demand to automate daily human activities by robot. With such an advancement and
demand for robotics, the realization of a popular computer game will help students to learn
and acquire skills in the field of robotics. The computer game such as Pacman offers
challenges on both software and hardware fronts. In software, it provides challenges in
developing algorithms for a robot to escape from the pool of attacking robots and to develop
algorithms for multiple ghost robots to attack the Pacman. On the hardware front, it
provides a challenge to integrate various systems to realize the game. This project aims to
demonstrate the pacman game in real world as well as in simulation. For simulation
purpose Player/Stage is used to develop single-client and multi-client architectures. The
multi- client architecture in player/stage uses one global simulation proxy to which all the
robot models are connected. This reduces the overhead to manage multiple robots proxy.
The single-client architecture enables only two robot models to connect to the simulation
proxy. Multi-client approach offers flexibility to add sensors to each port which will be used
distinctly by the client attached to the respective robot. The robots are named as Pacman
and Ghosts, which try to escape and attack respectively. Use of Network Camera has been
done to detect the global positions of the robots and data is shared through inter-process
communication.
In Content-Based Image Retrieval (CBIR) systems, the visual contents of the
images in the database are took out and represented by multi-dimensional characteristic
vectors. A well known CBIR system that retrieves images by unsupervised method known
as cluster based image retrieval system. For enhancing the performance and retrieval rate
of CBIR system, we fuse the visual contents of an image. Recently, we developed two
cluster-based CBIR systems by fusing the scores of two visual contents of an image. In this
paper, we analyzed the performance of the two recommended CBIR systems at different
levels of precision using images of varying sizes and resolutions. We also compared the
performance of the recommended systems with that of the other two existing CBIR systems
namely UFM and CLUE. Experimentally, we find that the recommended systems
outperform the other two existing systems and one recommended system also comparatively
performed better in every resolution of image.
Information Systems and Networks are subjected to electronic attacks. When
network attacks hit, organizations are thrown into crisis mode. From the IT department to
call centers, to the board room and beyond, all are fraught with danger until the situation is
under control. Traditional methods which are used to overcome these threats (e.g. firewall,
antivirus software, password protection etc.) do not provide complete security to the system.
This encourages the researchers to develop an Intrusion Detection System which is capable
of detecting and responding to such events. This review paper presents a comprehensive
study of Genetic Algorithm (GA) based Intrusion Detection System (IDS). It provides a
brief overview of rule-based IDS, elaborates the implementation issues of Genetic Algorithm
and also presents a comparative analysis of existing studies.
Step by step operations by which we make a group of objects in which attributes
of all the objects are nearly similar, known as clustering. So, a cluster is a collection of
objects that acquire nearly same attribute values. The property of an object in a cluster is
similar to other objects in same cluster but different with objects of other clusters.
Clustering is used in wide range of applications like pattern recognition, image processing,
data analysis, machine learning etc. Nowadays, more attention has been put on categorical
data rather than numerical data. Where, the range of numerical attributes organizes in a
class like small, medium, high, and so on. There is wide range of algorithm that used to
make clusters of given categorical data. Our approach is to enhance the working on well-
known clustering algorithm k-modes to improve accuracy of algorithm. We proposed a new
approach named “High Accuracy Clustering Algorithm for Categorical datasets”.
Brain tumor is a malformed growth of cells within brain which may be
cancerous or non-cancerous. The term ‘malformed’ indicates the existence of tumor. The
tumor may be benign or malignant and it needs medical support for further classification.
Brain tumor must be detected, diagnosed and evaluated in earliest stage. The medical
problems become grave if tumor is detected at the later stage. Out of various technologies
available for diagnosis of brain tumor, MRI is the preferred technology which enables the
diagnosis and evaluation of brain tumor. The current work presents various clustering
techniques that are employed to detect brain tumor. The classification involves classification
of images into normal and malformed (if detected the tumor). The algorithm deals with
steps such as preprocessing, segmentation, feature extraction and classification of MR brain
images. Finally, the confirmatory step is specifying the tumor area by technique called
region of interest.
A Proxy signature scheme enables a proxy signer to sign a message on behalf of
the original signer. In this paper, we propose ECDLP based solution for chen et. al [1]
scheme. We describe efficient and secure Proxy multi signature scheme that satisfy all the
proxy requirements and require only elliptic curve multiplication and elliptic curve addition
which needs less computation overhead compared to modular exponentiations also our
scheme is withstand against original signer forgery and public key substitution attack.
Water marking has been proposed as a method to enhance data security. Text
water marking requires extreme care when embedding additional data within the images
because the additional information must not affect the image quality. Digital water marking
is a method through which we can authenticate images, videos and even texts. Add text
water mark and image water mark to your photos or animated image, protect your
copyright avoid unauthorized use. Water marking functions are not only authentication, but
also protection for such documents against malicious intentions to change such documents
or even claim the rights of such documents. Water marking scheme that hides water
marking in method, not affect the image quality. In this paper method of hiding a data using
LSB replacement technique is proposed.
Today among various medium of data transmission or storage our sensitive data
are not secured with a third-party, that we used to take help of. Cryptography plays an
important role in securing our data from malicious attack. This paper present a partial
image encryption based on bit-planes permutation using Peter De Jong chaotic map for
secure image transmission and storage. The proposed partial image encryption is a raw data
encryption method where bits of some bit-planes are shuffled among other bit-planes based
on chaotic maps proposed by Peter De Jong. By using the chaotic behavior of the Peter De
Jong map the position of all the bit-planes are permuted. The result of the several
experimental, correlation analysis and sensitivity test shows that the proposed image
encryption scheme provides an efficient and secure way for real-time image encryption and
decryption.
This paper presents a survey of Dependency Analysis of Service Oriented
Architecture (SOA) based systems. SOA presents newer aspects of dependency analysis due
to its different architectural style and programming paradigm. This paper surveys the
previous work taken on dependency analysis of service oriented systems. This study shows
the strengths and weaknesses of current approaches and tools available for dependency
analysis task in context of SOA. The main motivation of this work is to summarize the
recent approaches in this field of research, identify major issue and challenges in
dependency analysis of SOA based systems and motivate further research on this topic.
In this paper, proposed a novel implementation of a Soft-Core system using
micro-blaze processor with virtex-5 FPGA. Till now Hard-Core processors are used in
FPGA processor cores. Hard cores are a fixed gate-level IP functions within the FPGA
fabrics. Now the proposed processor is Soft-Core Processor, this is a microprocessor fully
described in software, usually in an HDL. This can be implemented by using EDK tool. In
this paper, developed a system which is having a micro-blaze processor is the combination
of both hardware & Software. By using this system, user can control and communicate all
the peripherals which are in the supported board by using Xilinx platform to develop an
embedded system. Implementing of Soft-Core process system with different peripherals like
UART interface, SPA flash interface, SRAM interface has to be designed using Xilinx
Embedded Development Kit (EDK) tools.
The article presents a simple algorithm to construct minimum spanning tree and
to find shortest path between pair of vertices in a graph. Our illustration includes the proof
of termination. The complexity analysis and simulation results have also been included.
Wimax technology has reshaped the framework of broadband wireless internet
service. It provides the internet service to unconnected or detached areas such as east South
Africa, rural areas of America and Asia region. Full duplex helpers employed with one of
the relay stations selection and indexing method that is Randomized Distributed Space Time
are used to expand the coverage area of primary Wimax station. The basic problem was
identified at cell edge due to weather conditions (rain, fog), insertion of destruction because
of multiple paths in the same communication channel and due to interference created by
other users in that communication. It is impractical task for the receiver station to decode
the transmitted signal successfully at the cell edges, which increases the high packet loss and
retransmissions. But Wimax is a outstanding technology which is used for improving the
quality of internet service and also it offers various services like Voice over Internet
Protocol, Video conferencing and Multimedia broadcast etc where a little delay in packet
transmission can cause a big loss in the communication. Even setup and initialization of
another Wimax station nearer to each other is not a good alternate, where any mobile
station can easily handover to another base station if it gets a strong signal from other one.
But in rural areas, for few numbers of customers, installation of base station nearer to each
other is costlier task. In this review article, we present a scheme using R-DSTC technique to
choose and select helpers (relay nodes) randomly to expand the coverage area and help to
mobile station as a helper to provide secure communication with base station. In this work,
we use full duplex helpers for better utilization of bandwidth.
Radio Frequency identification (RFID) technology has become emerging
technique for tracking and items identification. Depend upon the function; various RFID
technologies could be used. Drawback of passive RFID technology, associated to the range
of reading tags and assurance in difficult environmental condition, puts boundaries on
performance in the real life situation [1]. To improve the range of reading tags and
assurance, we consider implementing active backscattering tag technology. For making
mobiles of multiple radio standards in 4G network; the Software Defined Radio (SDR)
technology is used. Restrictions in Existing RFID technologies and SDR technology, can be
eliminated by the development and implementation of the Software Defined Radio (SDR)
active backscattering tag compatible with the EPC global UHF Class 1 Generation 2 (Gen2)
RFID standard. Such technology can be used for many of applications and services.
2024.06.01 Introducing a competency framework for languag learning materials ...Sandy Millin
http://sandymillin.wordpress.com/iateflwebinar2024
Published classroom materials form the basis of syllabuses, drive teacher professional development, and have a potentially huge influence on learners, teachers and education systems. All teachers also create their own materials, whether a few sentences on a blackboard, a highly-structured fully-realised online course, or anything in between. Despite this, the knowledge and skills needed to create effective language learning materials are rarely part of teacher training, and are mostly learnt by trial and error.
Knowledge and skills frameworks, generally called competency frameworks, for ELT teachers, trainers and managers have existed for a few years now. However, until I created one for my MA dissertation, there wasn’t one drawing together what we need to know and do to be able to effectively produce language learning materials.
This webinar will introduce you to my framework, highlighting the key competencies I identified from my research. It will also show how anybody involved in language teaching (any language, not just English!), teacher training, managing schools or developing language learning materials can benefit from using the framework.
How to Make a Field invisible in Odoo 17Celine George
It is possible to hide or invisible some fields in odoo. Commonly using “invisible” attribute in the field definition to invisible the fields. This slide will show how to make a field invisible in odoo 17.
Synthetic Fiber Construction in lab .pptxPavel ( NSTU)
Synthetic fiber production is a fascinating and complex field that blends chemistry, engineering, and environmental science. By understanding these aspects, students can gain a comprehensive view of synthetic fiber production, its impact on society and the environment, and the potential for future innovations. Synthetic fibers play a crucial role in modern society, impacting various aspects of daily life, industry, and the environment. ynthetic fibers are integral to modern life, offering a range of benefits from cost-effectiveness and versatility to innovative applications and performance characteristics. While they pose environmental challenges, ongoing research and development aim to create more sustainable and eco-friendly alternatives. Understanding the importance of synthetic fibers helps in appreciating their role in the economy, industry, and daily life, while also emphasizing the need for sustainable practices and innovation.
Instructions for Submissions thorugh G- Classroom.pptxJheel Barad
This presentation provides a briefing on how to upload submissions and documents in Google Classroom. It was prepared as part of an orientation for new Sainik School in-service teacher trainees. As a training officer, my goal is to ensure that you are comfortable and proficient with this essential tool for managing assignments and fostering student engagement.
This is a presentation by Dada Robert in a Your Skill Boost masterclass organised by the Excellence Foundation for South Sudan (EFSS) on Saturday, the 25th and Sunday, the 26th of May 2024.
He discussed the concept of quality improvement, emphasizing its applicability to various aspects of life, including personal, project, and program improvements. He defined quality as doing the right thing at the right time in the right way to achieve the best possible results and discussed the concept of the "gap" between what we know and what we do, and how this gap represents the areas we need to improve. He explained the scientific approach to quality improvement, which involves systematic performance analysis, testing and learning, and implementing change ideas. He also highlighted the importance of client focus and a team approach to quality improvement.
The Indian economy is classified into different sectors to simplify the analysis and understanding of economic activities. For Class 10, it's essential to grasp the sectors of the Indian economy, understand their characteristics, and recognize their importance. This guide will provide detailed notes on the Sectors of the Indian Economy Class 10, using specific long-tail keywords to enhance comprehension.
For more information, visit-www.vavaclasses.com
2. At this stage the machine vision system is used to decide which extracted features are relevant for
furtherprocessing. Common features to be extracted from the input data in the sector of agriculture are seeds,
fruits, flowers, vegetables and geographic features.
II. ORGANIZATION OF THE ARTICLE
Automation of seed classification is based on classical methods which rely on feature extraction and
classifiers. This work attempts to incorporate both the elements since they are closely related and is organized
as follows. Section III emphasizes the survey of work done in the area. Section IV present seeds and their
features that are extracted for discriminating the seed from the lot and Section V addresses seeds and the
classifiers used for classifying them. At the end there is a bibliography which the reader may use to further
explore the field. It is, by no means an exhaustive, but intended to serve as a starting point and direct the
reader to characteristic research in this area.
III. THE SURVEY OF WORK DONE IN THE RESEARCH AREA
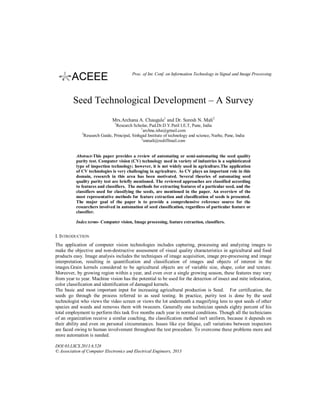
Substantial work in seed technology-seed purity test using image processing has been reported. Fig.1 shows
the seed technology development at a glance. The work has been categorized depending on different types of
seeds
A. Weed. Pablo M. Granitto et.al[1,2] assessed the discriminating power of size, shape, color and texture
characteristics for the unique identification of 57 weed species using the Naive Bayes classifier. Size and
shape characteristics were found to have larger discriminating power than color and textural ones.
T.F.Burks et.al. [3] Reported Colour Co-occurrence Method (CCM) texture analysis techniques to evaluate
three different neural-network classifiers for potential use in real-time weed control systems. A comparison
study of the classification capabilities of three neural-network models was conducted. It was found that the
Back Propagation Neural-Network (BPNN) classifier provided the best classification performance with
96.7% accuracy.
Fig. 1: Seed technology development at a glance
B. Corn. Xiao Chena et.al. [4] Presented a method for classifying five corn varieties. The image processing
techniques, stepwise descriminant analysis, the Mahalanobis distance analysis and the BPNN were used. A
two-stage classifier was developed for identifying which combined the Mahalanobis distance analysis and the
BPNN. The classification accuracies found were between 88 to 100% for various varieties.
72
3. Cao Weishi et.al. [5] Presented a maize purity identification calculation based on Discrete Wavelet transform
and BPNN. The identification accuracies were found to be 94.5%.
Min Zhao et.al. [6] Proposed a real-time, accurate and objective identification of different varieties of corn
seeds. Color, texture and shape features, were extracted. Genetic algorithm and SVM were used to select and
determine species. The proposed methods have achieved the best performance percentage of 94.4%.
C. Wheat. AlirezaPourreza et.al. [7] Applied machine vision techniques to classify wheat seeds based on
their varieties. Several textural feature groups of seeds images were examined to evaluate their efficacy in
identification of nine common Iranian wheat seed varieties. LDA (linear discriminate analysis) classifier was
employed for classification using top selected features. The average classification accuracies found were
98.15%.
Marian Wiwart et.al. [8] Presented a method to identify hybrids of spelt and wheat based on shape and color
descriptors using principal component analysis.
D. Areca nuts. Kuo-Yi Huang [9] presented an application of neural networks and image processing
techniques for detecting and classifying the quality of areca nuts. Defects with diseases or insects of areca
nuts were segmented by a detection line method. Six geometric features, three color features and defects area
was used in the classification procedure. To sort the quality of areca nuts a BPNN classifier was employed.
The classification accuracies found were 90.9%.
E. Cotton. Li Jinbig et.al. [10] Proposed a nonlinear identification method based on BPNN and
investigatedthree varieties of delinted cottonseeds. The color and shape characteristics parameters were
selected. It was found that BPNN identification method had higher accuracy than the step discrimination
method and the test accuracy rate was 90%.
Jamuna et.al. [11] Employed machine learning approach to classify the quality of seeds based on the different
growth stages of the cotton crop. Machine learning techniques such as Decision Tree Classifier, Naive Bayes
Classifier and Multilayer Perceptron were applied for training the model. The results obtained shows that
Decision Tree Classifier and Multilayer Perceptron provide the same accuracy but the time taken to build the
model is higher in Multilayer Perceptron as compared to the Decision Tree Classifier.
F. Rice. Liu Zhao-yan et.al. [12] Developed a digital image analysis algorithm based on color and
morphological features to identify the six varieties of paddy.
G. Bulk grains. KantipKiratiratanapruk [13] proposed a method to classify more than ten categories of seed
defects by using color, texture features and support vector machine (SVM) type classifier.
AdjemoutOuiza et.al. [14] Emphasized on the pattern recognition aspects and four hundred samples of each
of four species of seeds, namely corn, oat, barley and lentil were considered. The recognition procedure was,
made on the basis of shape features and texture features, separately. Features space reduction was done using
the Principal Component and clustering operation was done based on the k-means algorithm.
H. Rubber. HadzliHashim et.al. [15] Developed an intelligent model for classifying selected rubber tree
series clones based on shape features using image processing techniques. Shape features were extracted from
each image. Two models were being designed. It was shown that the optimized Model 2 has the best
accuracy of 84% with more than 70% achievement for sensitivity and specificity.
IV. SEEDS AND FEATURES
Different features need to be extracted for proper classification of seeds. Different seeds have their own
features which are extracted and given for further processing. Substantial work in seed feature extraction
using image processing has been reported. They are categorized depending on different types of seeds
A. Color. Pablo M. Granitto et.al. [1] Extracted features of the weed seeds. Gray level histograms in the I, r,
gchannelswere calculated. From these histograms standard features such as average, variance and skewness
were measured. Three ratios of average histogram values in the RGB channels: E[R]/E[G], E[R]/E[I] and
E[G]/E[I] were calculated (where E[.] means the average pixel value in the corresponding channel). In total
12 different color characteristics were measured. The final four parameters selected for classification are the
following: Variance of the intensity histogram [M2(I)], Skewness of the intensity histogram
[M3(I)/M2(I)3/2], Ratios of average pixel values in RGB channels [E(R)/E(I), E(G)/E(I)].
73
4. Xiao Chena et.al. [4] Found a total of 58 features to be extracted for identifying corn varieties, including 30
morphological features and 28 color features. Color features have been widely used to classify grain varieties.
But different from most grains, colors of a corn kernel are not quite uniform. Both the germ and tipcap of
corn are typically white, whether the whole kernel is white or yellow. To study the effect of color features on
the identification performance of corn varieties, four transformations of RGB color space were evaluated, i.e.,
rgb(normalized RGB values), YCb Cr, I1I2 I3, and HSV. Furthermore, 28 features such as mean and standard
deviation of these color components were calculated. From these the 18 colorfeatures (Mean and standard
deviation of B, g, G, R, S, H, I3, I2, r) were selected using stepwise selection for recognizing three types
(white, yellow and mixed) corn kernels and finally six colorfeatures (standard deviation of g, r, I1, mean of r,
g,) were selected for recognizing the three varieties of yellow corn kernels using stepwise discrimination.
Cao Weishi et.al. [5] Obtained the RGB color model character parameters of the maize seed crown part, and
then the three color values obtained were processed and analyzed by the two-level DWT. The feature value
was the average of the color component pixels of each maize seed crown core area. After the three color
component two-level DWT of the same objective image, the average of every band was calculated separately
and 21 characteristic parameters were acquired such as V= { BLL2, BHL1, BLH1, BHH1, BHL2,
BLH2,BHH2, GLL2,GHL1, GLH1,GHH1,GHL2, GLH2, GHH2,RLL2,RHL1, RLH1,RHH1,RHL2 ,RLH2
,RHH2}.
Min zhaoet.al. [6]Obtainedtwelve features of corn seed’s color mean and standard deviation of red, green and
blue, the mean and standard deviation of hue, saturation and intensity from the acquired images.
Marian Wiwart et.al. [8] Performed the coloranalysis based on the average values of variables R G B for
every ROI, which were then used to calculate the values of H S I and L a b.
Kuo-Yi Huang [9] calculated a pair of orthogonal eigenvectors of the covariance matrix. The color features—
Rm, Gm, and Bm (i.e., the mean gray level of areca nut on the R, G, and B bands) of the entire areca nut
were computed using eigenvectors.
Li Jingbinet.al. [10] Used RGB color model and HSI color model. The 12 color characteristic parameters ,
the mean and standard deviation of the color characteristics, including R (red), G (green), B (blue), H (hue),
S(saturation), and I (luminance) were defined for cotton seeds.
KantipKiratiratanapruk [13] adopted color histograms in the RGB and HSV color space with eight bins in
each color channel for corn identification.
B. Morphology. Pablo M. Granitto et.al. [1] extracted features corresponding to morphological of the weed
seeds. Size and shape characteristics of seeds were obtained from Binarized images. The lengths of the
principal axes and several moments of the planar mass distribution with respect to those axes, the ratio of its
area to the seed area (compactness) and the size of the minimal rectangular box containing the seed were
measured. In total 21 morphological features were measured. The final six parameters that were selected for
classification are Ratio of semi-axis lengths of the main principal axis [h1/h2], Ratio of seed and enclosing
box areas [A/(h1+h2)×(v1+v2)], Square root of seed area [SQRT(A)], Moments of the planar mass
distribution with respect to the principal axes [M20,M21,M22].
It was concluded that morphological features has the large discriminating power, color and texture were less
reliable, morphology plus color features have an edge over the combined use of morphology and texture.
Xiao Chenaet. al. [4] found a total of 58 features to be extracted for identifying corn varieties, including 30
morphological features.
Min zhaoet.al.[6] extracted the 11 geometric features of corn kernels based on binary image including
contour points, perimeter, area, circular degrees, equivalent diameter, major length, minor length, stretching
the length of the rectangle, maximum inscribed circle, the smallest excircle.
Marian Wiwart et.al. [8] Determined the following descriptors for the image of each wheat kernel represented
by a single blob (ROI – region of interest): Area, Perimeter, Circularity, Feret Diameter, Minimal Feret
Diameter, Aspect Ratio, Roundness, and Solidity.
Kuo-Yi Huang [9] calculated a pair of orthogonal eigenvectors of the covariance matrix. The geometric
features, the principle axis length (Lp), secondary axis (Ls), the centroid, axis number (Lp/Ls), area (A),
perimeter (P), compactness (4πA/P2) were computed using eigenvectors for areca nuts.
Li Jingbinet.al.[10] extracted fourteen shape characteristic parameters of cottonseeds the Area , Perimeter ,
NCI ratio , Circular degree , Center of gravity X , Center of gravity Y, Major diameter, Short diameter,
Second moment X (Mx2), Second moment Y (My2), Second moment XY (Mxy), Major axis of oval ,Short axis
of oval ,Shape coefficient of oval.
74
5. Adjemoutouiza et.al. [14] Made the recognition procedure on the basis of shape features separately forCorn,
Oats, Barley, and Lentil. 15 shape features the perimeter, the surface, the circularity, Major axis, minor axis,
Hu’smoments and central moments of second order were calculated from the pre-processed images.
HadzliHashim et.al. [15] Proposed two models for automated rubber seed clones classification. The first
model (known as Model 1) uses 38 shape features (area, perimeter and 36 radius components) as the inputs,
while the second (known as Model 2) utilizes only the input size reduction after applying PCA.
C. Texture. Pablo M. Granitto et.al. [1] Extracted features corresponding to textural characteristics of the
weed seeds. Two different matrices Gray level co-occurrence matrix and Gray level run length matrix were
used to describe seed surface texture. The final two parameters selected for classification are contrast along
the main principal axis direction and Cluster Prominence along the secondary principal axis direction.
Min zhaoet.al. [6] Obtained texture feature such as mean, variance, smoothness, third moment, consistency,
entropy and 7 statistical invariant moments from the gray image were obtained.
AlirezaPourreza et.al.[7] extracted 131 textural features, including 32 gray level textural features (mean,
standard deviation, smoothness, third moment, uniformity, entropy, gray level range and 25 histogram
groups), 31 LBP features (mean, standard deviation, smoothness, third moment, uniformity, entropy and 25
histogram groups), 31 LSP features (mean, standard deviation, smoothness, third moment, uniformity,
entropy and 25 histogram groups), 15 LSN features (mean, standard deviation, smoothness, third moment,
uniformity, entropy and histogram of LSN matrix containing nine features), 10 gray level co-occurrence
matrix (GLCM) features (mean, variance, entropy, uniformity, homogeneity, inertia, cluster shade, cluster
prominence, maximum probability and correlation) and 12 gray level run-length matrix GLRM features
(short run, long run, gray level non-uniformity, run ratio, run length non-uniformity, entropy, low gray level
run, high gray level run, short run low gray level, short run high gray level, long run low gray level and long
run high gray level) for each monochrome image of the bulk wheat samples.
KantipKiratiratanapruk [13] adopted texture features such as energy, contrast, correlation and homogeneity
based on Grey level co-occurrence matrix (GLCM) and Local binary pattern (LBP) for corn image
classification.
Adjemoutouiza et.al. [14] Made the recognition procedure on the basis of texture features, separately
forCorn, Oats, Barley, and Lentil. Spatial gray-level dependence method were used for extracting texture
features such as second angular moment (SAM) which gives information about the homogeneity of texture,
contrast (CONT) which measures the local variation of texture and supports the great transitions from the
grey levels, entropy (ENT) which evaluates the degree of organization of the pixels, variance (VAR),
differential inverse moment (IM) and correlation (COR).
Fig: 2 shows the graphical presentation of seeds and features extracted from that seed
Fig. 2: Seed and Features
75
6. V. SEEDS AND CLASSIFIERS
Features extracted are given as an input to the classifiers for proper classification of seeds. Substantial work
in seed classification using pattern recognition has been reported. They are categorized depending on
different types of seeds.
Fig: 3show the graphical presentation of seeds and classifiers used for classifying that seed.
A. Weed. Pablo M. Granitto et.al. [1, 2] compared the naïve bayesclassifier, single ANN and the structuring
ten networks in a committee (with 2 options majority rule and added probabilities). It was proved that the two
ANN committee implementations were better than the naïve bayes and single ANN classifier.
T.F.Burks et.al. [3]Conducted a comparison study of the classification capabilities of three neural-network
models (backpropagation, counterpropagation, and radial basis function). It was found that the
backpropagation neural-network classifier provided the best classification performance and was capable of
classification accuracies of 97%, which exceeded traditional statistical classification procedure accuracy of
93%.When comparing the three neural-network methodologies, the backpropagation method not only
achieved a higher classification accuracy, but also had less computational requirements.
B. Corn. Xiao Chena et.al. [4] developed a two-stage classifier for identifying, which combined the
Mahalanobis distance and BPNN classifier. Experiments showed the average classification accuracy for five
corn varieties was up to 90%. It was found, that the method combining the Mahalanobis distance and BPNN
classifier may be successfully employed for corn variety identification.
Cao Weishi et.al. [5] Selected the average of every band as the input samples for BP neural network, and
purity identification results of maize seed as the output samples of neural network. Results demonstrated that
this method can identify the maize purity effectively with accurate identification rate reaching 94.5%.
Min zhao et.al. [6] Applied SVM for classification by optimal combination of features. The algorithm
implemented in this research was able to correctly classify the three varieties of corn. From 50 images of
corn seed, 20 images were taken as training samples, and 30 images for testing samples. Applying the
presented SVM classifier to estimate varieties resulted in a classification rate of 94.4%. The average
consumption time for every seed was 0.141s.
KantipKiratiratanapruk [13] adopted Support Vector Machine (SVM) for seed classification. In error case,
defect seed types were normally misclassified into other defect seed types. Percentage of misclassification of
defect seed types to normal seed type was only 0.64 on average. On the other side, a normal seed
wasmisidentified as defect seed at a higher percentage of 4.44%. Color and texture feature were provided to
support vector machine for training and identification of the unknown seed type. In the experiment, this
technique was evaluated from 14,000 seed sample images of a normal seed type and 13 defect seed types.
The obtained accuracies were 76% and 56% for individual feature separately whereas 81.8% for combination
of both color and texture.
C. Arecanuts. Kuo-Yi Huang [9] used a back propagation neural network (BPNN) to classify areca nuts into
excellent, good or bad classes. The BPNN classifier consists of three layers: an input layer, a hidden layer,
and an output layer. The input layer had 10 nodes related to SR area, 3 color features, and 6 geometric
features aforementioned. The output layer was made of nodes related to three categories: Excellent, Good,
and Bad. There were 144 samples, including 49 Excellent, 46 Good, and 49 Bad, which were randomly
sampled from 287 images, where the 50%–50% splitting was used in order to establish the BPNN classifier.
Eighteen hidden nodes were obtained according to Eq. (1) by using 10 input features, 3 output categories, and
144 input samples.
.
= [( + ) ÷ 2] +
(1)
Wheren i is the number of input nodes no is the number of output nodes, and np is the number of input patterns
in the training set. The accuracies of classification were 91.7%, 89.1%, and 91.8% for Excellent, Good, and
Bad grades, respectively. The average accuracy was 90.9%. The total numbers of correct and erroneous
classifications were 130 and 13, respectively.
D. Wheat. AlirezaPourreza et.al. [7] Employed a linear discriminant analysis (LDA) classifier to classify the
wheat seed samples into nine classes based on nine varieties using top selected features. It was discovered
that the LDA classifier presented the maximum average accuracy of 98.15% (ranged from 88.33% to 100%).
76
7. Marian Wiwart et.al. [8] adopted principal component analysis (PCA) for discrimination. The grain images
of three common wheat varieties, five spelt breeding lines and 24 single hybrids between wheat and spelt
were subjected to (PCA). PCA supported strong discrimination of the studied forms as regards their shape
and color descriptors. In the PCA investigating shape descriptors only, the percentage of variation explained
by the first two PCs reached a high 98.98%, whereas it was 90.27% for color descriptors. The PCA of
variables describing the shape and color of grain images supports reliable discrimination of hybrids and their
parental forms. The data were subjected to a principal component analysis (PCA) for three times, for shape
descriptors only, for color attributes only, and for all analyzed variables.
E. Cotton. Li Jingbin et.al. [10] Used the BP neural network to train the training set. The network structure
consists of three layers. The number of nodes of the input layer was 9. Three cottonseed varieties were tested
at the same time, and therefore, the number of nodes of the output layer was 3. The number of nodes of the
hidden layer was 11. BP neural network identification method had higher accuracy than the step
discrimination analysis method.
Jamuna KS et.al. [11] showed that Multilayer perceptron and decision tree classifiers predicts better than
Naïve Bayes algorithm. Among the three classifiers used for the experiment, the decision tree induction
algorithm (J48) and Multilayer perceptron algorithm provides same prediction accuracy. The accuracy rate of
Naïve Bayes classifier is less compared to other models. Multilayer perceptron, the neural network classifier
consumes more time to build the model. The Naïve Bayes, the probabilistic classifier tends to learn more
rapidly for the given dataset. There was a little statistical difference in the time taken to build the decision
tree model and probabilistic model. J48 can be employed in the agriculture domain to predict the quality of
the cotton seed.
F. Oats, Barley, Lentil. Adjemoutouiza et.al. [14] Carried out the recognition which consists in affecting an
unknown seed to its class on the basis of the nearest Euclidean distance calculated between the feature vector
of the unknown seed and the average feature vector of each cluster. The unknown seed was affected to the
cluster corresponding to the smallest distance. After testing more than four hundred seeds of each class, the
average of recognition rate reached was 85.75 %. Because of their circular shapes, lentils were recognized at
100%. With its compact shape, the corn recognition rate reached 99%. For the oats and barley, the
recognition rates were 97% and 47% respectively. Some seeds of barley were confused with oats and,
conversely, some seeds of oats were confused with barley due to the similarities between the sizes and the
stretched shapes.
G. Rubber. HadzliHashim et.al. [15] Used multi-layer perceptron Artificial Neural Network (ANN) using
Levenberg-Marquardt algorithm. In this algorithm, the network assembles a set of training data that contains
examples of inputs together with the corresponding outputs and later learns to infer the relationship between
the two. Two models were proposed for automated seed clones classification. The ratio between best clone
(RRIM2009) and nonbest clones (RRIM2005 and RRIM2016) for training set was fixed at 110:40:40. After
training, the network was tested with the test data set of 100 samples and the ratio between the clones was
50:25:25. The optimized model was later evaluated and validated through analysis of performance indicators.
Fig. 3: Seed and Classifiers
77
8. VI. THE KINDS OF CONCLUSIONS EXPECTED AND THEIR POSSIBLE VALUE
The use of good quality seed increases the crop yield, decreases the number of seeds that need to be sown
and reduces the carryover of weeds, insects and diseases. However, when the seed quality tests are done
manually it adversely affects the results and adds to the man-hours spent on the test. Thus, this research
would help in making the seed test accurate due to which the quality of the various crop seeds may improve
by identifying relevant, robust, invariant features for reliably discriminating the seed of interest and designing
efficient and accurate classifier. It can be concluded from Fig.2 that color and shape have the most
discriminating power, but depending upon what type of seed is to be classified the feature that is extracted
varies and from Fig.3 It can be concluded that neural networks is widely used for classification.
REFERENCES
[1]Pablo M. Granitto, Hugo D. Navone, Pablo F. Verdes, H.A. Ceccatto, “Weed Seeds Identification by Machine
Vision,” Elsevier, Computers and Electronics in Agriculture 33, pp.91-103, 2002.
[2] Pablo M. Granitto, Pablo F. Verdes, H. Alejandro Ceccatto, “Large-Scale Investigation of Weed Seed Identification
by Machine Vision,” Elsevier, Computers and Electronics in Agriculture 47, pp.15-24 2005.
[3] T.F. Burks; S.A. Shearer; J.R. Heath; K.D. Donohue, “Evaluation of Neural-Network Classifiers for Weed Species
Discrimination,” Elsevier, Biosystems Engineering 91 (3), pp.293-304, 2005.
[4] Xiao Chena, Yi Xunb, Wei Li, Junxiong Zhang, “Combining Discriminant Analysis and Neural Networks for Corn
Variety Identification,” Elsevier, Computers and Electronics in Agriculture 71S, pp.S48-S53, 2010.
[5] Cao Weishi, Zhang Chunqing, Wang Jinxing, Liu shuangxi, XuKingzhen, “Purity Identification of Maize Seed Based
on Discrete Wavelet Transform and BP Neural Network,” Transactions of the Chinese society of Agricultural
Engineering, Vol. 28, pp.253-258, Oct 2012.
[6] Min zhao, Wenfu Wu, Yaqiu Zhang, Xing Li, “Combining Genetic Algorithm and SVM for Corn Variety
Identification,” International Conference on Mechatronics Science, Electric Engineering and Computer, pp. 990993, August 2011.
[7] AlirezaPourreza, HamidrezaPourreza, Mohammad-HosseinAbbaspour-Fard, Hassan Sadrnia, “Identification of Nine
Iranian Wheat Seed Varieties by Textural Analysis with Image Processing,” Elsevier, Computers and Electronics in
Agriculture 83, pp.102-108, 2012.
[8] MarianWiwart, ElzbietaSuchowilska, WaldemarLajszner, ŁukaszGraban, “Identification of Hybrids of Spelt and
Wheat and their Parental Forms Using Shape and Color Descriptors,” Elsevier, Computers and Electronics in
Agriculture 83, pp.68-76, 2012.
[9] Kuo-Yi Huang, “Detection and Classification of Areca Nuts with Machine Vision,” Elsevier, Computers and
Mathematics with Applications 64, pp.739-746, 2012.
[10] Li Jingbin, Chen Bingqi, Shao Luhao, TianXushun, KanZa, “Variety Identification of Delinted Cottonseeds Based
on BP Neural Network,” Transactions of the Chinese society of Agricultural Engineering, Vol. 28, pp.265-269, Oct
2012.
[11] Jamuna KS, Karpagavalli S, Vijaya MS, Revathi P, Gokilavani S, Madhiya E, “Classification of Seed Cotton Yield
Based on the Growth Stages of Cotton Crop Using Machine Learning Techniques,” International Conference on
Advances in Computer Engineering ,978-0-7695-4058-0/10, 2010.
[12]LIU Zhao-yan, Fang, YING Yi-bin, RAO Xiu-qin, “Identification of rice seed varieties using neural network,”
Journal of Zhejiang University SCIENCE, ISSN 1009-3095,6B(11), pp.1095-1100,2005.
[13]KantipKiratiratanapruk, “Color and Texture for Corn Seed Classification by Machine Vision,” 2011 International
Symposium on Intelligent Signal Processing and Communication Systems (ISPACS), December 7-9, 2011.
[14] Adjemoutouiza, HammoucheKamal, DiafMoussa, “Automatic Seeds Recognition by Size, Form and Texture
Features,” 1-4244-0779-6, 2007.
[15] HadzliHashim, FairulNazmie Osman, Syed Abdul Mutalib Al Junid, Muhammad AdibHaron and HajarMohdSalleh,
“An Intelligent Classification Model for Rubber Seed Clones Based on Shape Features Through Imaging
Techniques,” 2010 International Conference on Intelligent Systems, Modelling and Simulation, 978-0-7695-39737/10, pp.25-31, 2010.
78