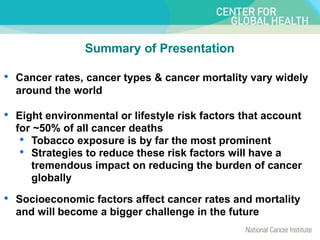
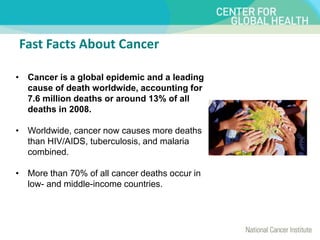
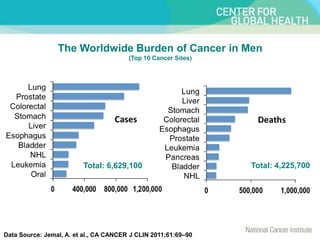
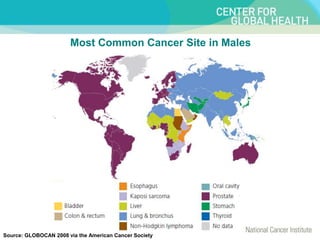
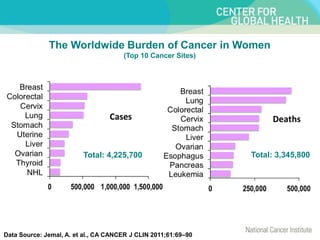
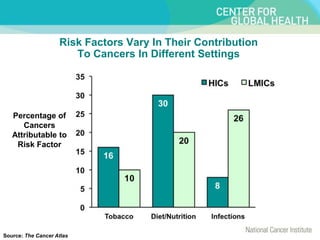
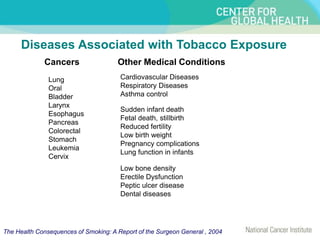
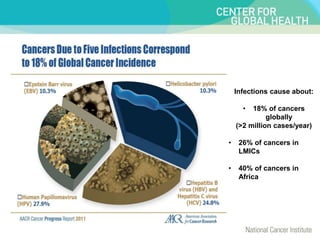
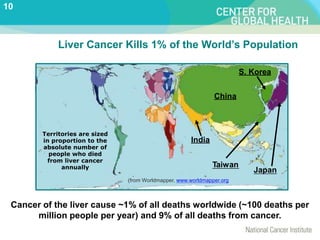
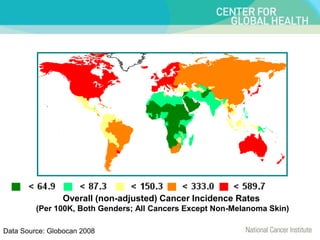
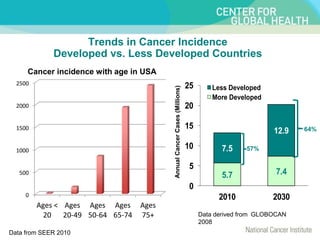
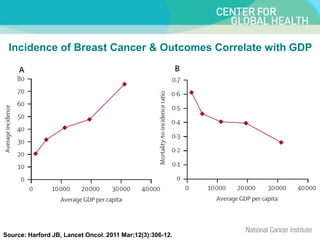
Global Cancer Epidemic: Impact,
Challenges and Future Trends
Thomas Gross, MD, PhD
Deputy Director of Science
Center for Global Health
National Cancer Institute
Bethesda, MD 20892
Email: thomas.gross@nih.gov
Summary of Presentation
• Cancer rates, cancer types & cancer mortality vary widely
around the world
• Eight environmental or lifestyle risk factors that account
for ~50% of all cancer deaths
• Tobacco exposure is by far the most prominent
• Strategies to reduce these risk factors will have a
tremendous impact on reducing the burden of cancer
globally
• Socioeconomic factors affect cancer rates and mortality
and will become a bigger challenge in the future
Fast Facts About Cancer
• Cancer is a global epidemic and a leading
cause of death worldwide, accounting for
7.6 million deaths or around 13% of all
deaths in 2008.
• Worldwide, cancer now causes more deaths
than HIV/AIDS, tuberculosis, and malaria
combined.
• More than 70% of all cancer deaths occur in
low- and middle-income countries.
CANCER RATES, TYPE AND
MORTALITY VARIES WORLDWIDE
Data Source: Jemal, A. et al., CA CANCER J CLIN 2011;61:69–90
The Worldwide Burden of Cancer in Men
(Top 10 Cancer Sites)
Total: 6,629,100 Total: 4,225,700
Most Common Cancer Site in Males
Source: GLOBOCAN 2008 via the American Cancer Society
Data Source: Jemal, A. et al., CA CANCER J CLIN 2011;61:69–90
The Worldwide Burden of Cancer in Women
(Top 10 Cancer Sites)
Total: 4,225,700 Total: 3,345,800
Most Common Cancer Site in Females
Source: GLOBOCAN 2008 via the American Cancer Society
CAUSES OF CANCER
VARY WORLDWIDE
80.3
65.9
34.1
33
32.7
25.2
21.5
20.9
19.2
17.7
17.2
17.1
14.7
13.9
13.3
12.3
11
7.1
4.6
3.3
0 10 20 30 40 50 60 70 80 90
Japan, Hiroshima
Korea
China, Shanghai
USA, Los Angeles: Korean
Russia, St Petersburg
Peru, Trujillo
Singapore: Chinese
Slovenia
Brazil, Cuiaba
Poland, Cracow
USA, Hawaii: Japanese
USA, Los Angeles: Japanese
China, Hong Kong
Switzerland, Ticino
France, Manche
Spain, Zaragoza
USA, SEER (9): Black
Algeria, Setif
India, Mumbai
Egypt, Gharbiah
Rate per 100,000
Male Stomach Cancer ASRs from Population-based Registries:
Data Source: Curado. M. P., Edwards, B., Shin. H.R., Storm. H.,
Ferlay. J., Heanue. M. and Boyle. P., eds (2007) Cancer
Incidence in Five Continents, Vol. IX
IARC Scientific Publications No. 160, Lyon, IARC.
http://www-dep.iarc.fr/
Genetic Pre-disposition vs Environment Exposure
Eight Risk Factors Account for 50% of Deaths from Cancer
Risk Factors Vary In Their Contribution
To Cancers In Different Settings
Percentage of
Cancers
Attributable to
Risk Factor
Source: The Cancer Atlas
Diseases Associated with Tobacco Exposure
Lung
Oral
Bladder
Larynx
Esophagus
Pancreas
Colorectal
Stomach
Leukemia
Cervix
Sudden infant death
Fetal death, stillbirth
Reduced fertility
Low birth weight
Pregnancy complications
Lung function in infants
Cardiovascular Diseases
Respiratory Diseases
Asthma control
Low bone density
Erectile Dysfunction
Peptic ulcer disease
Dental diseases
The Health Consequences of Smoking: A Report of the Surgeon General , 2004
Cancers Other Medical Conditions
Infections cause about:
• 18% of cancers
globally
(>2 million cases/year)
• 26% of cancers in
LMICs
• 40% of cancers in
Africa
(from Worldmapper, www.worldmapper.org
Territories are sized
in proportion to the
absolute number of
people who died
from liver cancer
annually
Liver Cancer Kills 1% of the World’s Population
Cancer of the liver cause ~1% of all deaths worldwide (~100 deaths per
million people per year) and 9% of all deaths from cancer.
S. Korea
China
Taiwan
Japan
India
10
IMPACT OF SOCIOECONOMIC
STATUS ON CANCER BURDEN
Data Source: Globocan 2008
Overall (non-adjusted) Cancer Incidence Rates
(Per 100K, Both Genders; All Cancers Except Non-Melanoma Skin)
Annual
Cancer
Cases
(Millions) 5.7 7.4
7.5
12.9
0
5
10
15
20
25
2010 2030
Less Developed
More Developed
57%
64%
Trends in Cancer Incidence
Developed vs. Less Developed Countries
Data derived from GLOBOCAN
2008
0
500
1000
1500
2000
2500
Ages <
20
Ages
20-49
Ages
50-64
Ages
65-74
Ages
75+
Data from SEER 2010
Cancer incidence with age in USA
Cancer in 0-14 yr olds as % of all cancer
Globocan 2002
%
of
All
Cancers
• Incidence per capita of pediatric cancer is similar around the world
Trends in Cancer Mortality
Developed vs. Less Developed Countries
 Cancer mortality in more developed countries
 projected decrease by <30% by 2030
 Cancer mortality in less developed countries
 projected to increase by >70% by 2030
By 2030 - 85% of all cancer deaths may be occurring in low-middle income
countries
 The increase In cancer mortality in LMIC is largely due to:
 Delay in accurate diagnoses
 Lack of unawareness about cancer and potential value of therapy
 Lack of access and ability to deliver potentially curative therapy
 Abandonment of therapy
Data Source: Globocan 2008
Female Breast Cancer Incidence
(Per 100,000)
Total Expenditure on Health
(for 2011 in US$)
Breast Cancer and Socioeconomic Status
RISK FACTORS FOR BREAST CANCER IN
DEVELOPED COUNTRIES
• Higher maternal age at first birth
• Reduced parity
– Each live birth results in a decrease
of 7% in relative risk of breast
cancer (Lancet 2002;360:187-195)
• Reduced breast feeding
– For every 12 months of breast
feeding results in a decrease of 4%
in relative risk of breast cancer
(Lancet 2002;360:187-195)
• Obesity & “lifestyle” factors
Incidence of Breast Cancer & Outcomes Correlate with GDP
Source: Harford JB, Lancet Oncol. 2011 Mar;12(3):306-12.
Institute of Medicine (IOM REPORT)
High-income countries should:
•Resist the temptation to focus on exporting the
latest, most expensive technologies that may
be appropriate for wealthy countries…
•Partner with countries to develop resource-
appropriate strategies focused on decreasing
the burden and mortality due to cancer.
IOM Report
Some low- or middle income countries
(including physicians & governments) have a
related temptation to WANT the latest, most
expensive technologies as opposed to more
resource-appropriate “alternatives” which may
be seen as 2nd rate solutions.
A National Cancer Control Program in Context
Broader Social Context
Healthcare System
National Cancer
Control Program
Primary
Prevention
Early
Detection
Palliative
Care
Curative
Treatment
Survivorship
This is for title
• This is for text
NCI - CGH Global Footprint
Acknowledgments
• Ted Trimble, MD, MPH – Director of NCI-CGH
• Lisa Stevens, PhD – Deputy Director of NCI-CGH
• Joe Harford, PhD - Senior Advisor NCI-CGH
• Ann Chao, PhD – East Asia Representative, NCI-CGH
51071.ppt

51071.ppt

  • 1.
    Global Cancer Epidemic:Impact, Challenges and Future Trends Thomas Gross, MD, PhD Deputy Director of Science Center for Global Health National Cancer Institute Bethesda, MD 20892 Email: thomas.gross@nih.gov
  • 2.
    Summary of Presentation •Cancer rates, cancer types & cancer mortality vary widely around the world • Eight environmental or lifestyle risk factors that account for ~50% of all cancer deaths • Tobacco exposure is by far the most prominent • Strategies to reduce these risk factors will have a tremendous impact on reducing the burden of cancer globally • Socioeconomic factors affect cancer rates and mortality and will become a bigger challenge in the future
  • 3.
    Fast Facts AboutCancer • Cancer is a global epidemic and a leading cause of death worldwide, accounting for 7.6 million deaths or around 13% of all deaths in 2008. • Worldwide, cancer now causes more deaths than HIV/AIDS, tuberculosis, and malaria combined. • More than 70% of all cancer deaths occur in low- and middle-income countries.
  • 4.
    CANCER RATES, TYPEAND MORTALITY VARIES WORLDWIDE
  • 5.
    Data Source: Jemal,A. et al., CA CANCER J CLIN 2011;61:69–90 The Worldwide Burden of Cancer in Men (Top 10 Cancer Sites) Total: 6,629,100 Total: 4,225,700
  • 6.
    Most Common CancerSite in Males Source: GLOBOCAN 2008 via the American Cancer Society
  • 7.
    Data Source: Jemal,A. et al., CA CANCER J CLIN 2011;61:69–90 The Worldwide Burden of Cancer in Women (Top 10 Cancer Sites) Total: 4,225,700 Total: 3,345,800
  • 8.
    Most Common CancerSite in Females Source: GLOBOCAN 2008 via the American Cancer Society
  • 9.
  • 10.
    80.3 65.9 34.1 33 32.7 25.2 21.5 20.9 19.2 17.7 17.2 17.1 14.7 13.9 13.3 12.3 11 7.1 4.6 3.3 0 10 2030 40 50 60 70 80 90 Japan, Hiroshima Korea China, Shanghai USA, Los Angeles: Korean Russia, St Petersburg Peru, Trujillo Singapore: Chinese Slovenia Brazil, Cuiaba Poland, Cracow USA, Hawaii: Japanese USA, Los Angeles: Japanese China, Hong Kong Switzerland, Ticino France, Manche Spain, Zaragoza USA, SEER (9): Black Algeria, Setif India, Mumbai Egypt, Gharbiah Rate per 100,000 Male Stomach Cancer ASRs from Population-based Registries: Data Source: Curado. M. P., Edwards, B., Shin. H.R., Storm. H., Ferlay. J., Heanue. M. and Boyle. P., eds (2007) Cancer Incidence in Five Continents, Vol. IX IARC Scientific Publications No. 160, Lyon, IARC. http://www-dep.iarc.fr/ Genetic Pre-disposition vs Environment Exposure
  • 11.
    Eight Risk FactorsAccount for 50% of Deaths from Cancer
  • 12.
    Risk Factors VaryIn Their Contribution To Cancers In Different Settings Percentage of Cancers Attributable to Risk Factor Source: The Cancer Atlas
  • 13.
    Diseases Associated withTobacco Exposure Lung Oral Bladder Larynx Esophagus Pancreas Colorectal Stomach Leukemia Cervix Sudden infant death Fetal death, stillbirth Reduced fertility Low birth weight Pregnancy complications Lung function in infants Cardiovascular Diseases Respiratory Diseases Asthma control Low bone density Erectile Dysfunction Peptic ulcer disease Dental diseases The Health Consequences of Smoking: A Report of the Surgeon General , 2004 Cancers Other Medical Conditions
  • 14.
    Infections cause about: •18% of cancers globally (>2 million cases/year) • 26% of cancers in LMICs • 40% of cancers in Africa
  • 15.
    (from Worldmapper, www.worldmapper.org Territoriesare sized in proportion to the absolute number of people who died from liver cancer annually Liver Cancer Kills 1% of the World’s Population Cancer of the liver cause ~1% of all deaths worldwide (~100 deaths per million people per year) and 9% of all deaths from cancer. S. Korea China Taiwan Japan India 10
  • 16.
  • 17.
    Data Source: Globocan2008 Overall (non-adjusted) Cancer Incidence Rates (Per 100K, Both Genders; All Cancers Except Non-Melanoma Skin)
  • 18.
    Annual Cancer Cases (Millions) 5.7 7.4 7.5 12.9 0 5 10 15 20 25 20102030 Less Developed More Developed 57% 64% Trends in Cancer Incidence Developed vs. Less Developed Countries Data derived from GLOBOCAN 2008 0 500 1000 1500 2000 2500 Ages < 20 Ages 20-49 Ages 50-64 Ages 65-74 Ages 75+ Data from SEER 2010 Cancer incidence with age in USA
  • 19.
    Cancer in 0-14yr olds as % of all cancer Globocan 2002 % of All Cancers • Incidence per capita of pediatric cancer is similar around the world
  • 20.
    Trends in CancerMortality Developed vs. Less Developed Countries  Cancer mortality in more developed countries  projected decrease by <30% by 2030  Cancer mortality in less developed countries  projected to increase by >70% by 2030 By 2030 - 85% of all cancer deaths may be occurring in low-middle income countries  The increase In cancer mortality in LMIC is largely due to:  Delay in accurate diagnoses  Lack of unawareness about cancer and potential value of therapy  Lack of access and ability to deliver potentially curative therapy  Abandonment of therapy
  • 21.
    Data Source: Globocan2008 Female Breast Cancer Incidence (Per 100,000) Total Expenditure on Health (for 2011 in US$) Breast Cancer and Socioeconomic Status
  • 22.
    RISK FACTORS FORBREAST CANCER IN DEVELOPED COUNTRIES • Higher maternal age at first birth • Reduced parity – Each live birth results in a decrease of 7% in relative risk of breast cancer (Lancet 2002;360:187-195) • Reduced breast feeding – For every 12 months of breast feeding results in a decrease of 4% in relative risk of breast cancer (Lancet 2002;360:187-195) • Obesity & “lifestyle” factors
  • 23.
    Incidence of BreastCancer & Outcomes Correlate with GDP Source: Harford JB, Lancet Oncol. 2011 Mar;12(3):306-12.
  • 24.
    Institute of Medicine(IOM REPORT) High-income countries should: •Resist the temptation to focus on exporting the latest, most expensive technologies that may be appropriate for wealthy countries… •Partner with countries to develop resource- appropriate strategies focused on decreasing the burden and mortality due to cancer. IOM Report Some low- or middle income countries (including physicians & governments) have a related temptation to WANT the latest, most expensive technologies as opposed to more resource-appropriate “alternatives” which may be seen as 2nd rate solutions.
  • 25.
    A National CancerControl Program in Context Broader Social Context Healthcare System National Cancer Control Program Primary Prevention Early Detection Palliative Care Curative Treatment Survivorship
  • 26.
    This is fortitle • This is for text NCI - CGH Global Footprint
  • 27.
    Acknowledgments • Ted Trimble,MD, MPH – Director of NCI-CGH • Lisa Stevens, PhD – Deputy Director of NCI-CGH • Joe Harford, PhD - Senior Advisor NCI-CGH • Ann Chao, PhD – East Asia Representative, NCI-CGH

Editor's Notes