
More Related Content
Viewers also liked
Similar to 5 year cashflow Cal Marine SCAM????
Similar to 5 year cashflow Cal Marine SCAM???? (20)
Recently uploaded
Recently uploaded (6)
5 year cashflow Cal Marine SCAM????
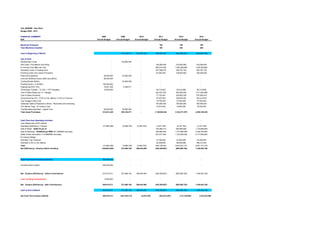
- 1. CAL MARINE - One Plant Budget 2008 - 2013 FINANCIAL SUMMARY 2008 2009 2010 2011 2012 2013 $US Annual Budget Annual Budget Annual Budget Annual Budget Annual Budget Annual Budget Machines Produced 105 180 180 Total Machines Installed 105 285 465 Cash at Beginning of Month - 614,316,371 372,498,100 369,445,400 (453,368,097) (565,508,782) Use of Cash Development Costs - 135,800,000 - - - - Site Costs, Foundations and Siting - - - 126,000,000 216,000,000 216,000,000 Ex Factory Cost ($6m per unit) - - - 828,514,050 1,420,309,800 1,420,309,800 Assembly Costs in Floating Dock - - - 207,548,670 355,797,720 355,797,720 Finishing Costs (Incl Labour/Transport) - - - 63,000,000 108,000,000 108,000,000 Plant and Equipment 30,000,000 25,000,000 - - - - Land and Building Factory ($5m plus $53m) 58,000,000 - - - - - Tooling Moulds ($24m) - 24,000,000 - - - - Floating Docks x 2 ($150m) 150,000,000 - - - - - Engineering ($15.15m) 10,821,429 4,328,571 - - - - Technology Transfer - To CAL + HTF Royalties 15,000,000 - - 49,710,843 85,218,588 85,218,588 Cost of Sales Water per m3 + Barges - - - 202,537,454 800,269,939 1,511,620,996 Cost of Sales Electricity - - - 77,153,481 304,850,338 575,828,416 Government fee 4% + 2.5% to CAL Marine = 6.5% of Turnover - - - 57,937,933 228,925,491 432,414,816 Tug Towage to Site Cost - - - 15,750,000 27,000,000 27,000,000 Undersea Cable & Pipework to Shore - Placement and Anchoring - - - 105,000,000 180,000,000 180,000,000 CAL Marine Tugs - Ex Factory Cost - - - 15,810,000 18,000,000 18,000,000 Tug Manufacturing Plant - Capital Cost 50,000,000 50,000,000 - - - - Total Asset Purchases 313,821,429 239,128,571 - 1,748,962,430 3,744,371,875 4,930,190,335 Cash Flow from Operating Activities - - - - - - Loan Repayment at 6% interest - - - - - - Operating (Deficiency) / Surplus (21,862,200) (2,689,700) (3,052,700) (3,237,700) (4,747,700) (4,747,700) Sale of Water - $US0.70 per m3 - - 150,585,313 594,995,625 1,123,880,625 Sale of Electricity - $US50.00 per MWh (61,320MWh annually) - - - 448,950,000 1,773,900,000 3,350,700,000 Water Power Generation (113,880MWh annually) - - - 291,817,500 1,153,035,000 2,177,955,000 Ex Factory Margin - - - - - - Add Back Tug Transport - - - 15,750,000 27,000,000 27,000,000 Add Back 2.5% to CAL Marine - - - 22,283,820 88,048,266 166,313,391 Total (21,862,200) (2,689,700) (3,052,700) 926,148,933 3,632,231,191 6,841,101,316 Net (Deficiency) / Surplus before Investing (335,683,629) 372,498,100 369,445,400 (453,368,097) (565,508,782) 1,345,402,198 Cash Flow from Financing Activities 950,000,000 - - - - - Invested Share Capital 950,000,000 - - - - - Net - Surplus (Deficiency) - before Commissions 614,316,371 372,498,100 369,445,400 (453,368,097) (565,508,782) 1,345,402,198 Less: Funding Commissions 9,500,000 - - - - - Net - Surplus (Deficiency) - after Commissions 604,816,371 372,498,100 369,445,400 (453,368,097) (565,508,782) 1,345,402,198 Cash at End of Month 604,816,371 372,498,100 369,445,400 (453,368,097) (565,508,782) 1,345,402,198 Net Cash Flow Surplus (Deficit) 604,816,371 (241,818,271) (3,052,700) (822,813,497) (112,140,685) 1,910,910,980
- 2. CAL MARINE - One Plant Budget 2008 - 2013 USE OF CASH 2008 2008 2008 2008 2008 2008 2008 2008 2008 2008 2008 2008 2008 $US Annual Budget Jan Feb March April May June July Aug Sept Oct Nov Dec Machines Produced per Month Total Machines Installed 0 0 0 0 0 0 0 0 0 0 0 0 0 Cash at Beginning of Month $- $950,000,000 $933,178,150 $931,356,300 $897,370,164 $870,548,314 $832,728,845 $797,073,662 $759,254,193 $723,599,010 $703,279,540 $668,457,690 $640,304,887 Use of Cash Development Costs $- - - - - - - - - - - - - Site Costs, Foundations and Siting $- Ex Factory Cost ($6m per unit) $- Assembly Costs in Floating Dock $- Finishing Costs (Incl. Labour & Transport) $- Plant and Equipment (for Floating Dock & Main Factory) $30,000,000 - - - - - - - - 7,500,000 7,500,000 7,500,000 7,500,000 Land and Building - Factory ($5m + $53m) $58,000,000 - - 5,000,000 - 8,833,333 8,833,333 8,833,333 8,833,333 8,833,333 8,833,333 - - Tooling Moulds ($24m) $- - - - - - - - - - - - - Floating Docks x 3 ($150m) $150,000,000 - - 25,000,000 25,000,000 25,000,000 25,000,000 25,000,000 25,000,000 - - - - Engineering ($15.15m) $10,821,429 - - 2,164,286 - 2,164,286 - 2,164,286 - 2,164,286 - 2,164,286 - Technology Transfer - To CAL + HTF Royalties $15,000,000 15,000,000 - - - - - - - - - - - Cost of Sales Water per m3 + Barges $- Cost of Sales Electricity $- Government fee 4% + 2.5% to CAL Marine = 6.5% of Turnover $- Tug Towage to Site Cost $- Undersea Cable & Pipework to Shore - Placement and Anchoring $ CAL Marine Tugs - Ex Factory Cost $- Tug Manufacturing Plant - Capital Cost $50,000,000 16,666,667 16,666,667 16,666,666 Total Asset Purchases $313,821,429 15,000,000 - 32,164,286 25,000,000 35,997,619 33,833,333 35,997,619 33,833,333 18,497,619 33,000,000 26,330,953 24,166,666 $- $- Cash Flow from Operating Activities Loan Repayment at 6% interest $- Operating (Deficiency) / Surplus $(21,862,200) (1,821,850) (1,821,850) (1,821,850) (1,821,850) (1,821,850) (1,821,850) (1,821,850) (1,821,850) (1,821,850) (1,821,850) (1,821,850) (1,821,850) Sale of Water - $US0.70 per m3 $- Sale of Electricity - $US50.00 per MWh (61,320MWh annually) $- Water Power Generation (113,880MWh annually) $- Add Back Tug Transport $- Add Back 2.5% to CAL Marine $- Total $(21,862,200) (1,821,850) (1,821,850) (1,821,850) (1,821,850) (1,821,850) (1,821,850) (1,821,850) (1,821,850) (1,821,850) (1,821,850) (1,821,850) (1,821,850) Net (Deficiency) / Surplus before Investing (335,683,629) 933,178,150 931,356,300 897,370,164 870,548,314 832,728,845 797,073,662 759,254,193 723,599,010 703,279,540 668,457,690 640,304,887 614,316,371 $(335,683,629) 933,178,150 931,356,300 897,370,164 870,548,314 832,728,845 797,073,662 759,254,193 723,599,010 703,279,540 668,457,690 640,304,887 614,316,371 Cash Flow from Financing Activities $950,000,000 Invested Share Capital $950,000,000 Net - Surplus (Deficiency) - before Commissions $614,316,371 933,178,150 931,356,300 897,370,164 870,548,314 832,728,845 797,073,662 759,254,193 723,599,010 703,279,540 668,457,690 640,304,887 614,316,371 Less: Funding Commissions $9,500,000 Net - Surplus (Deficiency) - after Commissions $604,816,371 933,178,150 931,356,300 897,370,164 870,548,314 832,728,845 797,073,662 759,254,193 723,599,010 703,279,540 668,457,690 640,304,887 614,316,371 Cash at End of Month $604,816,371 $933,178,150 $931,356,300 $897,370,164 $870,548,314 $832,728,845 $797,073,662 $759,254,193 $723,599,010 $703,279,540 $668,457,690 $640,304,887 $614,316,371
- 3. CAL MARINE - One Plant Budget 2008 - 2013 22 23 24 25 26 27 28 29 30 31 32 33 USE OF CASH 2009 2009 2009 2009 2009 2009 2009 2009 2009 2009 2009 2009 2009 $US Annual Budget Jan Feb March April May June July Aug Sept Oct Nov Dec Machines Produced per Month Total Machines Installed 0 0 0 0 0 0 0 0 0 0 0 0 0 Cash at Beginning of Month $614,316,371 $614,316,371 $585,011,277 $555,706,183 $513,476,486 $487,913,456 $468,600,425 $449,287,394 $433,974,364 $418,661,333 $403,348,303 $388,035,272 $372,722,242 Use of Cash Development Costs $135,800,000 - - 15,088,889 15,088,889 15,088,889 15,088,889 15,088,889 15,088,889 15,088,889 15,088,889 15,088,889 - Site Costs, Foundations and Siting $- Ex Factory Cost ($6m per unit) $- Assembly Costs in Floating Dock $- Finishing Costs (Incl. Labour & Transport) $- Plant and Equipment (for Floating Dock & Main Factory) $25,000,000 6,250,000 6,250,000 6,250,000 6,250,000 - - - - - - - - Land and Building - Factory ($5m + $53m) $- - - - - - - - - - - - - Tooling Moulds ($24m) $24,000,000 4,000,000 4,000,000 4,000,000 4,000,000 4,000,000 4,000,000 - - - - - - Floating Docks x 3 ($150m) $- - - - - - - - - - - - - Engineering ($15.15m) $4,328,571 2,164,286 2,164,286 - - - - - - - - - - Technology Transfer - To CAL + HTF Royalties $- - - - - - - - - - - - - Cost of Sales Water per m3 + Barges $- Cost of Sales Electricity $- Government fee 4% + 2.5% to CAL Marine = 6.5% of Turnover $- Tug Towage to Site Cost $- Undersea Cable & Pipework to Shore - Placement and Anchoring $- CAL Marine Tugs - Ex Factory Cost $- Tug Manufacturing Plant - Capital Cost $50,000,000 16,666,667 16,666,667 16,666,666 Total Asset Purchases $239,128,571 29,080,953 29,080,953 42,005,555 25,338,889 19,088,889 19,088,889 15,088,889 15,088,889 15,088,889 15,088,889 15,088,889 - Cash Flow from Operating Activities Loan Repayment at 6% interest $- Operating (Deficiency) / Surplus $(2,689,700) (224,142) (224,142) (224,142) (224,142) (224,142) (224,142) (224,142) (224,142) (224,142) (224,142) (224,142) (224,142) Sale of Water - $US0.70 per m3 $- Sale of Electricity - $US50.00 per MWh (61,320MWh annually) $- Water Power Generation (113,880MWh annually) $- Add Back Tug Transport $- Add Back 2.5% to CAL Marine $- Total $(2,689,700) (224,142) (224,142) (224,142) (224,142) (224,142) (224,142) (224,142) (224,142) (224,142) (224,142) (224,142) (224,142) Net (Deficiency) / Surplus before Investing 372,498,100 585,011,277 555,706,183 513,476,486 487,913,456 468,600,425 449,287,394 433,974,364 418,661,333 403,348,303 388,035,272 372,722,242 372,498,100 $372,498,100 585,011,277 555,706,183 513,476,486 487,913,456 468,600,425 449,287,394 433,974,364 418,661,333 403,348,303 388,035,272 372,722,242 372,498,100 Cash Flow from Financing Activities $- Invested Share Capital $- Net - Surplus (Deficiency) - before Commissions $372,498,100 585,011,277 555,706,183 513,476,486 487,913,456 468,600,425 449,287,394 433,974,364 418,661,333 403,348,303 388,035,272 372,722,242 372,498,100 Less: Funding Commissions Net - Surplus (Deficiency) - after Commissions $372,498,100 585,011,277 555,706,183 513,476,486 487,913,456 468,600,425 449,287,394 433,974,364 418,661,333 403,348,303 388,035,272 372,722,242 372,498,100 Cash at End of Month $372,498,100 $585,011,277 $555,706,183 $513,476,486 $487,913,456 $468,600,425 $449,287,394 $433,974,364 $418,661,333 $403,348,303 $388,035,272 $372,722,242 $372,498,100
- 4. CAL MARINE - One Plant Budget 2008 - 2013 USE OF CASH 2010 2010 2010 2010 2010 2010 2010 2010 2010 2010 2010 2010 2010 $US Annual Budget Jan Feb March April May June July Aug Sept Oct Nov Dec Machines Produced per Month Total Machines Installed 0 0 0 0 0 0 0 0 0 0 0 0 0 Cash at Beginning of Month $372,498,100 $372,498,100 $372,243,708 $371,989,317 $371,734,925 $371,480,533 $371,226,142 $370,971,750 $370,717,358 $370,462,967 $370,208,575 $369,954,183 $369,699,792 Use of Cash Development Costs $- Site Costs, Foundations and Siting $- Ex Factory Cost ($6m per unit) $- Assembly Costs in Floating Dock $- Finishing Costs (Incl. Labour & Transport) $- Plant and Equipment (for Floating Dock & Main Factory) $- - - - - - - - - - - - - Land and Building - Factory ($5m + $53m) $- - - - - - - - - - - - - Tooling Moulds ($24m) $- - - - - - - - - - - - - Floating Docks x 3 ($150m) $- - - - - - - - - - - - - Engineering ($15.15m) $- - - - - - - - - - - - - Technology Transfer - To CAL + HTF Royalties $- - - - - - - - - - - - - Cost of Sales Water per m3 + Barges $- Cost of Sales Electricity $- Government fee 4% + 2.5% to CAL Marine = 6.5% of Turnover $- Tug Towage to Site Cost $- Undersea Cable & Pipework to Shore - Placement and Anchoring $- CAL Marine Tugs - Ex Factory Cost $- Tug Manufacturing Plant - Capital Cost $- Total Asset Purchases $- - - - - - - - - - - - - Cash Flow from Operating Activities Loan Repayment at 6% interest $- Operating (Deficiency) / Surplus $(3,052,700) (254,392) (254,392) (254,392) (254,392) (254,392) (254,392) (254,392) (254,392) (254,392) (254,392) (254,392) (254,392) Sale of Water - $US0.70 per m3 $- - - - - - - - - - - - - Sale of Electricity - $US50.00 per MWh (61,320MWh annually) $- - - - - - - - - - - - - Water Power Generation (113,880MWh annually) $- - - - - - - - - - - - - Add Back Tug Transport $- - - - - - - - - - - - - Add Back 2.5% to CAL Marine $- - - - - - - - - - - - - Total $(3,052,700) (254,392) (254,392) (254,392) (254,392) (254,392) (254,392) (254,392) (254,392) (254,392) (254,392) (254,392) (254,392) Net (Deficiency) / Surplus before Investing 369,445,400 372,243,708 371,989,317 371,734,925 371,480,533 371,226,142 370,971,750 370,717,358 370,462,967 370,208,575 369,954,183 369,699,792 369,445,400 $369,445,400 372,243,708 371,989,317 371,734,925 371,480,533 371,226,142 370,971,750 370,717,358 370,462,967 370,208,575 369,954,183 369,699,792 369,445,400 Cash Flow from Financing Activities $- Invested Share Capital $- Net - Surplus (Deficiency) - before Commissions $369,445,400 372,243,708 371,989,317 371,734,925 371,480,533 371,226,142 370,971,750 370,717,358 370,462,967 370,208,575 369,954,183 369,699,792 369,445,400 Less: Funding Commissions Net - Surplus (Deficiency) - after Commissions $369,445,400 372,243,708 371,989,317 371,734,925 371,480,533 371,226,142 370,971,750 370,717,358 370,462,967 370,208,575 369,954,183 369,699,792 369,445,400 Cash at End of Month $369,445,400 $372,243,708 $371,989,317 $371,734,925 $371,480,533 $371,226,142 $370,971,750 $370,717,358 $370,462,967 $370,208,575 $369,954,183 $369,699,792 $369,445,400
- 5. CAL MARINE - One Plant Budget 2008 - 2013 USE OF CASH 2011 2011 2011 2011 2011 2011 2011 2011 2011 2011 2011 2011 2011 $US Annual Budget Jan Feb March April May June July Aug Sept Oct Nov Dec Machines Produced per Month 105 5 5 5 10 10 10 10 10 10 10 10 10 Total Machines Installed 5 10 15 25 35 45 55 65 75 85 95 105 Cash at Beginning of Month $369,445,400 $369,445,400 $307,385,079 $250,007,747 $197,313,406 $87,551,541 $(12,844,343) $(103,874,248) $(185,538,173) $(257,836,117) $(320,768,082) $(374,334,067) $(418,534,072) Use of Cash Development Costs $- Site Costs, Foundations and Siting $126,000,000 6,000,000 6,000,000 6,000,000 12,000,000 12,000,000 12,000,000 12,000,000 12,000,000 12,000,000 12,000,000 12,000,000 12,000,000 Ex Factory Cost ($6m per unit) $828,514,050 39,453,050 39,453,050 39,453,050 78,906,100 78,906,100 78,906,100 78,906,100 78,906,100 78,906,100 78,906,100 78,906,100 78,906,100 Assembly Costs in Floating Dock $207,548,670 9,883,270 9,883,270 9,883,270 19,766,540 19,766,540 19,766,540 19,766,540 19,766,540 19,766,540 19,766,540 19,766,540 19,766,540 Finishing Costs (Incl. Labour & Transport) $63,000,000 3,000,000 3,000,000 3,000,000 6,000,000 6,000,000 6,000,000 6,000,000 6,000,000 6,000,000 6,000,000 6,000,000 6,000,000 Plant and Equipment (for Floating Dock & Main Factory) $- - - - - - - - - - - - - Land and Building - Factory ($5m + $53m) $- - - - - - - - - - - - - Tooling Moulds ($24m) $- - - - - - - - - - - - - Floating Docks x 3 ($150m) $- - - - - - - - - - - - - Engineering ($15.15m) $- - - - - - - - - - - - - Technology Transfer - To CAL + HTF Royalties $49,710,843 2,367,183 2,367,183 2,367,183 4,734,366 4,734,366 4,734,366 4,734,366 4,734,366 4,734,366 4,734,366 4,734,366 4,734,366 Cost of Sales Water per m3 + Barges $202,537,454 1,646,646 3,293,292 4,939,938 8,233,230 11,526,522 14,819,814 18,113,106 21,406,398 24,699,689 27,992,981 31,286,273 34,579,565 Cost of Sales Electricity $77,153,481 627,264 1,254,528 1,881,792 3,136,320 4,390,848 5,645,377 6,899,905 8,154,433 9,408,961 10,663,489 11,918,017 13,172,545 Government fee 4% + 2.5% to CAL Marine = 6.5% of Turnover $57,937,933 471,040 942,080 1,413,120 2,355,201 3,297,281 4,239,361 5,181,441 6,123,521 7,065,602 8,007,682 8,949,762 9,891,842 Tug Towage to Site Cost $15,750,000 750,000 750,000 750,000 1,500,000 1,500,000 1,500,000 1,500,000 1,500,000 1,500,000 1,500,000 1,500,000 1,500,000 Undersea Cable & Pipework to Shore - Placement and Anchoring $105,000,000 5,000,000 5,000,000 5,000,000 10,000,000 10,000,000 10,000,000 10,000,000 10,000,000 10,000,000 10,000,000 10,000,000 10,000,000 CAL Marine Tugs - Ex Factory Cost $15,810,000 770,000 770,000 770,000 1,500,000 1,500,000 1,500,000 1,500,000 1,500,000 1,500,000 1,500,000 1,500,000 1,500,000 Tug Manufacturing Plant - Capital Cost $- Total Asset Purchases $1,748,962,430 69,968,453 72,713,403 75,458,353 148,131,757 153,621,657 159,111,557 164,601,458 170,091,358 175,581,258 181,071,158 186,561,059 192,050,959 Cash Flow from Operating Activities Loan Repayment at 6% interest $- Operating (Deficiency) / Surplus $(3,237,700) (269,808) (269,808) (269,808) (269,808) (269,808) (269,808) (269,808) (269,808) (269,808) (269,808) (269,808) (269,808) Sale of Water - $US0.70 per m3 $150,585,313 1,224,271 2,448,542 3,672,813 6,121,354 8,569,896 11,018,438 13,466,979 15,915,521 18,364,063 20,812,604 23,261,146 25,709,688 Sale of Electricity - $US50.00 per MWh (61,320MWh annually) $448,950,000 3,650,000 7,300,000 10,950,000 18,250,000 25,550,000 32,850,000 40,150,000 47,450,000 54,750,000 62,050,000 69,350,000 76,650,000 Water Power Generation (113,880MWh annually) $291,817,500 2,372,500 4,745,000 7,117,500 11,862,500 16,607,500 21,352,500 26,097,500 30,842,500 35,587,500 40,332,500 45,077,500 49,822,500 Add Back Tug Transport $15,750,000 750,000 750,000 750,000 1,500,000 1,500,000 1,500,000 1,500,000 1,500,000 1,500,000 1,500,000 1,500,000 1,500,000 Add Back 2.5% to CAL Marine $22,283,820 181,169 362,339 543,508 905,846 1,268,185 1,630,523 1,992,862 2,355,201 2,717,539 3,079,878 3,442,216 3,804,555 Total $926,148,933 7,908,132 15,336,072 22,764,012 38,369,892 53,225,772 68,081,653 82,937,533 97,793,413 112,649,293 127,505,173 142,361,054 157,216,934 Net (Deficiency) / Surplus before Investing (453,368,097) 307,385,079 250,007,747 197,313,406 87,551,541 (12,844,343) (103,874,248) (185,538,173) (257,836,117) (320,768,082) (374,334,067) (418,534,072) (453,368,097) $(453,368,097) 307,385,079 250,007,747 197,313,406 87,551,541 (12,844,343) (103,874,248) (185,538,173) (257,836,117) (320,768,082) (374,334,067) (418,534,072) (453,368,097) Cash Flow from Financing Activities $- Invested Share Capital $- Net - Surplus (Deficiency) - before Commissions $(453,368,097) 307,385,079 250,007,747 197,313,406 87,551,541 (12,844,343) (103,874,248) (185,538,173) (257,836,117) (320,768,082) (374,334,067) (418,534,072) (453,368,097) Less: Funding Commissions Net - Surplus (Deficiency) - after Commissions $(453,368,097) 307,385,079 250,007,747 197,313,406 87,551,541 (12,844,343) (103,874,248) (185,538,173) (257,836,117) (320,768,082) (374,334,067) (418,534,072) (453,368,097) Cash at End of Month $(453,368,097) $307,385,079 $250,007,747 $197,313,406 $87,551,541 $(12,844,343) $(103,874,248) $(185,538,173) $(257,836,117) $(320,768,082) $(374,334,067) $(418,534,072) $(453,368,097)
- 6. CAL MARINE - One Plant Budget 2008 - 2013 USE OF CASH 2012 2012 2012 2012 2012 2012 2012 2012 2012 2012 2012 2012 2012 $US Annual Budget Jan Feb March April May June July Aug Sept Oct Nov Dec Machines Produced per Month 180 15 15 15 15 15 15 15 15 15 15 15 15 Total Machines Installed 120 135 150 165 180 195 210 225 240 255 270 285 Cash at Beginning of Month $(453,368,097) $(453,368,097) $(539,982,489) $(612,547,910) $(671,064,362) $(715,531,844) $(745,950,356) $(762,319,898) $(764,640,470) $(752,912,072) $(727,134,704) $(687,308,367) $(633,433,059) Use of Cash Development Costs $- Site Costs, Foundations and Siting $216,000,000 18,000,000 18,000,000 18,000,000 18,000,000 18,000,000 18,000,000 18,000,000 18,000,000 18,000,000 18,000,000 18,000,000 18,000,000 Ex Factory Cost ($6m per unit) $1,420,309,800 118,359,150 118,359,150 118,359,150 118,359,150 118,359,150 118,359,150 118,359,150 118,359,150 118,359,150 118,359,150 118,359,150 118,359,150 Assembly Costs in Floating Dock $355,797,720 29,649,810 29,649,810 29,649,810 29,649,810 29,649,810 29,649,810 29,649,810 29,649,810 29,649,810 29,649,810 29,649,810 29,649,810 Finishing Costs (Incl. Labour & Transport) $108,000,000 9,000,000 9,000,000 9,000,000 9,000,000 9,000,000 9,000,000 9,000,000 9,000,000 9,000,000 9,000,000 9,000,000 9,000,000 Plant and Equipment (for Floating Dock & Main Factory) $- - - - - - - - - - - - - Land and Building - Factory ($5m + $53m) $- - - - - - - - - - - - - Tooling Moulds ($24m) $- - - - - - - - - - - - - Floating Docks x 3 ($150m) $- - - - - - - - - - - - - Engineering ($15.15m) $- - - - - - - - - - - - - Technology Transfer - To CAL + HTF Royalties $85,218,588 7,101,549 7,101,549 7,101,549 7,101,549 7,101,549 7,101,549 7,101,549 7,101,549 7,101,549 7,101,549 7,101,549 7,101,549 Cost of Sales Water per m3 + Barges $800,269,939 39,519,503 44,459,441 49,399,379 54,339,317 59,279,255 64,219,193 69,159,131 74,099,068 79,039,006 83,978,944 88,918,882 93,858,820 Cost of Sales Electricity $304,850,338 15,054,338 16,936,130 18,817,922 20,699,714 22,581,506 24,463,299 26,345,091 28,226,883 30,108,675 31,990,468 33,872,260 35,754,052 Government fee 4% + 2.5% to CAL Marine = 6.5% of Turnover $228,925,491 11,304,963 12,718,083 14,131,203 15,544,323 16,957,444 18,370,564 19,783,684 21,196,805 22,609,925 24,023,045 25,436,166 26,849,286 Tug Towage to Site Cost $27,000,000 2,250,000 2,250,000 2,250,000 2,250,000 2,250,000 2,250,000 2,250,000 2,250,000 2,250,000 2,250,000 2,250,000 2,250,000 Undersea Cable & Pipework to Shore - Placement and Anchoring $180,000,000 15,000,000 15,000,000 15,000,000 15,000,000 15,000,000 15,000,000 15,000,000 15,000,000 15,000,000 15,000,000 15,000,000 15,000,000 CAL Marine Tugs - Ex Factory Cost $18,000,000 1,500,000 1,500,000 1,500,000 1,500,000 1,500,000 1,500,000 1,500,000 1,500,000 1,500,000 1,500,000 1,500,000 1,500,000 Tug Manufacturing Plant - Capital Cost $- Total Asset Purchases $3,744,371,875 266,739,312 274,974,163 283,209,013 291,443,864 299,678,714 307,913,564 316,148,415 324,383,265 332,618,116 340,852,966 349,087,816 357,322,667 Cash Flow from Operating Activities Loan Repayment at 6% interest $- Operating (Deficiency) / Surplus $(4,747,700) (395,642) (395,642) (395,642) (395,642) (395,642) (395,642) (395,642) (395,642) (395,642) (395,642) (395,642) (395,642) Sale of Water - $US0.70 per m3 $594,995,625 29,382,500 33,055,313 36,728,125 40,400,938 44,073,750 47,746,563 51,419,375 55,092,188 58,765,000 62,437,813 66,110,625 69,783,438 - Sale of Electricity - $US50.00 per MWh (61,320MWh annually) $1,773,900,000 87,600,000 98,550,000 109,500,000 120,450,000 131,400,000 142,350,000 153,300,000 164,250,000 175,200,000 186,150,000 197,100,000 208,050,000 - Water Power Generation (113,880MWh annually) $1,153,035,000 56,940,000 64,057,500 71,175,000 78,292,500 85,410,000 92,527,500 99,645,000 106,762,500 113,880,000 120,997,500 128,115,000 135,232,500 - Add Back Tug Transport $27,000,000 2,250,000 2,250,000 2,250,000 2,250,000 2,250,000 2,250,000 2,250,000 2,250,000 2,250,000 2,250,000 2,250,000 2,250,000 - Add Back 2.5% to CAL Marine $88,048,266 4,348,063 4,891,570 5,435,078 5,978,586 6,522,094 7,065,602 7,609,109 8,152,617 8,696,125 9,239,633 9,783,141 10,326,648 - Total $3,632,231,191 180,124,921 202,408,741 224,692,561 246,976,382 269,260,202 291,544,022 313,827,843 336,111,663 358,395,483 380,679,304 402,963,124 425,246,944 Net (Deficiency) / Surplus before Investing (565,508,782) (539,982,489) (612,547,910) (671,064,362) (715,531,844) (745,950,356) (762,319,898) (764,640,470) (752,912,072) (727,134,704) (687,308,367) (633,433,059) (565,508,782) $(565,508,782) (539,982,489) (612,547,910) (671,064,362) (715,531,844) (745,950,356) (762,319,898) (764,640,470) (752,912,072) (727,134,704) (687,308,367) (633,433,059) (565,508,782) Cash Flow from Financing Activities $- Invested Share Capital $- Net - Surplus (Deficiency) - before Commissions $(565,508,782) (539,982,489) (612,547,910) (671,064,362) (715,531,844) (745,950,356) (762,319,898) (764,640,470) (752,912,072) (727,134,704) (687,308,367) (633,433,059) (565,508,782) Less: Funding Commissions Net - Surplus (Deficiency) - after Commissions $(565,508,782) (539,982,489) (612,547,910) (671,064,362) (715,531,844) (745,950,356) (762,319,898) (764,640,470) (752,912,072) (727,134,704) (687,308,367) (633,433,059) (565,508,782) Cash at End of Month $(565,508,782) $(539,982,489) $(612,547,910) $(671,064,362) $(715,531,844) $(745,950,356) $(762,319,898) $(764,640,470) $(752,912,072) $(727,134,704) $(687,308,367) $(633,433,059) $(565,508,782)
- 7. CAL MARINE - One Plant Budget 2008 - 2013 Balance Sheet CAPITAL BUDGET Totals 2008 2008 $US Annual Jan ASSETS Equipment Development Costs $135,800,000 $- Plant and Equipment (for Floating Dock & Main Factory) $55,000,000 $30,000,000 Land and Building - Factory ($5m + $53m) $58,000,000 $58,000,000 Tooling Moulds ($24m) $24,000,000 $- Floating Docks x 3 ($150m) $150,000,000 $150,000,000 Engineering ($15.15m) $15,150,000 $10,821,429 Technology Transfer $15,000,000 $15,000,000 15,000,000 Tug Manufacturing Plant - Capital Cost $100,000,000 $100,000,000 Total Asset Purchases $552,950,000 $363,821,429 $15,000,000
- 8. 2008 2008 2008 2008 2008 2008 2008 Feb March April May June July Aug 5,000,000 8,833,333 8,833,333 8,833,333 8,833,333 25,000,000 25,000,000 25,000,000 25,000,000 25,000,000 25,000,000 2,164,286 2,164,286 2,164,286 16,666,667 16,666,667 16,666,667 16,666,667 16,666,667 16,666,667 $- $48,830,952 $41,666,667 $52,664,286 $50,500,000 $52,664,286 $50,500,000
- 9. 2008 2008 2008 2008 2009 Sept Oct Nov Dec Annual $135,800,000 7,500,000 7,500,000 7,500,000 7,500,000 $25,000,000 8,833,333 8,833,333 $- $24,000,000 $- 2,164,286 2,164,286 $4,328,571 $- $- $18,497,619 $16,333,333 $9,664,286 $7,500,000 $189,128,571
- 10. 2009 2009 2009 2009 2009 2009 Jan Feb March April May June 15,088,889 15,088,889 15,088,889 15,088,889 6,250,000 6,250,000 6,250,000 6,250,000 4,000,000 4,000,000 4,000,000 4,000,000 4,000,000 4,000,000 2,164,286 2,164,286 $12,414,286 $12,414,286 $25,338,889 $25,338,889 $19,088,889 $19,088,889
- 11. 2009 2009 2009 2009 2009 2009 July Aug Sept Oct Nov Dec 15,088,889 15,088,889 15,088,889 15,088,889 15,088,889 $15,088,889 $15,088,889 $15,088,889 $15,088,889 $15,088,889 $-
- 12. 2010 2010 2010 2010 2010 Annual Jan Feb March April $- $- $- $- $- $- $- $- $- $- $- $-
- 13. 2010 2010 2010 2010 2010 May June July Aug Sept $- $- $- $- $-
- 14. 2010 2010 2010 2011 2011 Oct Nov Dec Annual Jan $- $- $- $- $- $- $- $- $- $- $- $-
- 15. 2011 2011 2011 2011 2011 Feb March April May June $- $- $- $- $-
- 16. 2011 2011 2011 2011 2011 July Aug Sept Oct Nov $- $- $- $- $-
- 17. 2011 2012 2012 2012 2012 Dec Annual Jan Feb March $- $- $- $- $- $- $- $- $- $- $- $-
- 18. 2012 2012 2012 2012 2012 April May June July Aug $- $- $- $- $-
- 19. 2012 2012 2012 2012 Sept Oct Nov Dec $- $- $- $-
- 20. 2013 2013 2013 2013 2013 Annual Jan Feb March April $- $- $- $- $- $- $- $- $- $- $- $-
- 21. 2013 2013 2013 2013 2013 May June July Aug Sept $- $- $- $- $-
- 22. 2013 2013 2013 Oct Nov Dec $- $- $-
- 23. EXECUTIVE OVERHEAD SUMMARY $US Pre-Production Production 2008 2009 2010 2011 2012 2013 2014 2015 Personnel Costs: President 160,000 160,000 200,000 200,000 350,000 350,000 350,000 350,000 VP Research & Dev 55,000 110,000 140,000 140,000 200,000 200,000 200,000 200,000 VP Turbines 55,000 110,000 140,000 140,000 200,000 200,000 200,000 200,000 VP Marine 55,000 110,000 140,000 140,000 200,000 200,000 200,000 200,000 VP Financial 55,000 110,000 140,000 140,000 200,000 200,000 200,000 200,000 VP Marketing 55,000 110,000 140,000 140,000 200,000 200,000 200,000 200,000 VP Manufacturing 110,000 140,000 140,000 200,000 200,000 200,000 200,000 VP Electrical 55,000 110,000 140,000 140,000 200,000 200,000 200,000 200,000 Office Personal 30,000 60,000 70,000 80,000 100,000 100,000 100,000 100,000 Executive Directors & Staff 200,000 400,000 450,000 600,000 700,000 700,000 700,000 700,000 Director of Project Management 160,000 160,000 200,000 200,000 350,000 350,000 350,000 350,000 Consulting: Consultants (incl $20m labour hireage allowance) 20,200,000 200,000 200,000 200,000 300,000 300,000 300,000 300,000 Total Personnel Costs 21,080,000 1,750,000 2,100,000 2,260,000 3,200,000 3,200,000 3,200,000 3,200,000 Other Overheads: Office Rent 150,000 300,000 300,000 300,000 600,000 600,000 600,000 600,000 Office Equip Rental 10,000 17,700 17,700 17,700 17,700 17,700 17,700 17,700 Printing &Stationary 20,000 2,000 5,000 5,000 5,000 5,000 5,000 5,000 Communications 10,000 10,000 20,000 20,000 30,000 30,000 30,000 30,000 Vehicle Running 39,000 50,000 50,000 50,000 50,000 50,000 50,000 50,000 Vehicle Leases 43,200 60,000 60,000 60,000 60,000 60,000 60,000 60,000 Legal 80,000 20,000 20,000 30,000 40,000 40,000 40,000 40,000 Accounting/Audit 50,000 10,000 10,000 15,000 15,000 15,000 15,000 15,000 Local Travel 50,000 50,000 50,000 50,000 50,000 50,000 50,000 50,000 Overseas Travel 200,000 200,000 200,000 200,000 300,000 300,000 300,000 300,000 Private Accommodation 110,000 200,000 200,000 200,000 300,000 300,000 300,000 300,000 Advertising/Web Site 20,000 20,000 20,000 30,000 80,000 80,000 80,000 80,000 Total Other Overheads 782,200 939,700 952,700 977,700 1,547,700 1,547,700 1,547,700 1,547,700 Total Operating Costs 21,862,200 2,689,700 3,052,700 3,237,700 4,747,700 4,747,700 4,747,700 4,747,700
- 24. Sheet Line No 14 15 16 17 24 25 40 37 38 39 26 29
- 26. Varaible Cost PER MACHINE Site Costs, Foundations and Siting Ex Factory Cost (HT Ferro Components of wind turbine) Assembly Costs (in Floating Dock) Finishing Costs IE Blades, and 3 Generators - Wind Generator, Solar Generation, Water Current generator Total Cost for Floating unit Cost of Sales Water per m3 + Barges = $0.3692674/m3 4,197,500 m3 Annual Divided by Capital Cost per Machine = $15,000,000 plus $500,000 cost of Barge = $15,500,000 x 6 % + 2 % = 4,197,500 = 0.0285884 x 8% plus 2% Maintenance = Cost of Electricity = $8,000,000 x 6 % + 2% = $0208741 KWh = Ex Factory Margin Over Cost per Unit Ex Factory Margin Over Cost per Unit Cost ex Factory Sale of Water per Unit = $2.55 x 4,179,500 m3 = $10,661,650 Annual divided by 12 = 888,470.83 Per Month x $2.54 + $2,256,715.90 m3 Sale of Electricity Per unit: Ivory Coast = $70 per MWh x 2,555 MWh per Month Europe = $90 per MWh x 2,555 MWh per Month Solar and Water Generation - calculate it will take the Electricity up to 100% CAPACITY FACTOR = 4,745 MWh per month x either $90 per MWh or $70 per MWh This figure will reduce as turnover is not as high as first shown it will be Cal Marine Tugs ex Factory - allow for 2 tugs per month at the start-up level (each tug can tow up to 3 wind turbines at a time) Unit Towage Site Costs per unit Unit assembly on floating dock Finishing costs Undersea Cable & Pipework to Shore - Placement and Anchoring Tug Manufactured Cost Desalination Plant Capital Cost per machine Water production (cubic meters per machine per annum) Cost of capital Maintenance cost Total cost Monthly cost Electricity Generation Capital cost ROI & Maintenance Power generation capacity @ 20 MW per unit Capacity factor MWh per machine per annum Monthly cost Annual Cost Cost per MWh Sale of Water per machine
- 27. Water production per annum (cubic metres) Selling price per cubic meter Revenue per annum Electricity sales Selling price per MWh Electricity selling price per machine Electricity production per month (MWh) Selling Price
- 28. Cost Figure $1,200,000 $4,311,768 $326,340 $5,500,000 x 6% Funds Borrowed so unit cost is $10,138,108 $0.3692674 $0.00357355 $0.2087410 per MWH $0 Power $13,000,000 Gereration Plants - Capital value $5,109,390 7,890,610 $178,850 $229,950 6.5% of Turnover per month $770,000 for 2 tugs $150,000 $1,200,000 $1,976,654 $600,000 $1,000,000 $385,000 $15,500,000 4,197,500 349,791.67 8% 2% $329,329.19 0.94 Wind Water Total $8,000,000 $5,000,000 $13,000,000 10% 10% 10% 175,200 175,200 175,200 35% 65% 100% 61,320 113,880 175,200 $77,201.73 $48,251.08 $125,452.81 $926,421 $579,013 $1,505,434 $15.11 $5.08 $8.59 per annum per month
- 29. 4,197,500 $0.70 $2,938,250 $244,854 $50.00 Wind Water Total 5,110 9,490 14,600 $50.00 $50.00 $50.00 $255,500 $474,500 $730,000
- 30. Budget For CAL MARINE in reference to the CashFlow $US ENGINEERING COSTS Completetion of Wind Tunnel testing 100,000 Wind Tunnel model including Instrumentation 50,000 Engineering of Floating C86-10MW HT Ferro Attaractor, Centre Body, Centre-Body Supports, Column and Ballest Keel, Including Sea-Bed Anchoring 1,500,000 Engineering of Flotation and Sea-Tow, stationing on pre-set Cooridinates; power cable connection, fixture and layout; yaw control 750,000 Design/Engineering of Column Structure 25m dia x 70m length Anchoring fixture for sea-bed Foundation Pile tops and fixing Yaw capability, guidence of column base to foundation tops and fixing. 750,000 Engineering of Floating Dock: 450m x 200m 800,000 Launching Technique, Craneage assembly on Floating Dock, Assembley Process 500,000 Engineering/Design Variable Speed 10MW AC Generator Control System and Switchgear 500,000 Engineering/Design 10MW Direct Current Generator, Control System, Switchgear, DC/AC shore System with switching 750,000 Design/Blueprint 80m x 20m Electrical Assembley Shed 650,000 Design/Blueprint 80m x 20m Mechanical assembley shed 650,000 Design/Blueprint Steel reinforcing assembley shed 650,000 Design/Engineer Blade and Hub assembly; Drive train Brake, Hydraulics, assembly and fitting out centre-body and rotors 1,500,000 Design/Engineer Towing System; Tug Sizing, Launching from Floating Dock, Site Installation, Multiple unit connection and Precision placement 1,000,000 Design, build test, co-generator 5,000,000 Sub Total 15,150,000 CAPITAL COSTS Floating Docks x 3 off (Tender Allowance) 150,000,000 Tug Plant alonside main Plant, Budget reqd for Design Technology Transfer, Engineering and Moulds, Tug Length 77.7m beam 77m draught 7.1m with two 10,000 KW Supercharged Diesels 100,000,000 Purchase Waterfront Land - allow 100 Hectares x $50,000 per Hectare 5,000,000 Production Plant 200m x 530m at $500/m2 53,000,000 Exclusive Licence for HTFerro Plants 15,000,000 Plant and Equipment (Main Plant) 25,000,000 Plant and Equipment (Floating Dock) 30,000,000 Main Structure Moulds: Attractor 13,500,000 Column 25m dia x 70m 3,500,000
- 31. Bell Flotation Unit 2,500,000 Keel Ballast Support Legs 3,000,000 Keel Ballast 1,500,000 24,000,000 Sub Total 402,000,000 DEVELOPMENT COSTS Wharf and Floating Dock Tethering 1000m 100,000,000 Dredge Foreshore to accomodateF/Docks and Towage path 900,000 cubic metres x $70/m3 6,300,000 Desalination Barge: 35m x 7m capable of transporting & housing 42 x 20ft desalination container modules 3 high - design moulds, plant, and motive power 20,000,000 Brokerage Fees - allow 1% total budget 9,500,000 Sub Total 135,800,000 TOTAL 552,950,000 Plus Contingency Allowance of 10% (not included in cashflow) but allowed for in Funding Application. 55,295,000