Spark the rise Recycle e-waste
•Download as XLS, PDF•
0 likes•218 views

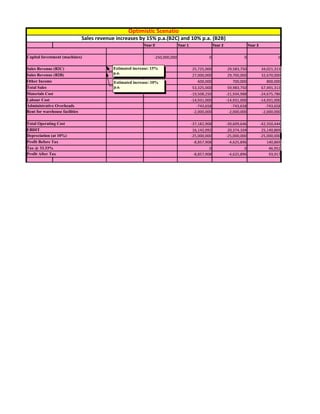
The document presents optimistic and pessimistic scenarios for company revenue and costs over 4 years. Under the optimistic scenario, B2C sales increase 15% annually and B2B sales increase 10% annually. Profits are positive by year 3. Under the pessimistic scenario, B2C sales increase 10% annually and B2B sales increase 7.5% annually. Profits remain negative over the 3 year period. Both scenarios assume a one-time capital investment in year 0 and 10% annual depreciation.

Recommended
More Related Content
What's hot
What's hot (19)
Similar to Spark the rise Recycle e-waste
Similar to Spark the rise Recycle e-waste (20)
Recently uploaded
Recently uploaded (20)
Spark the rise Recycle e-waste
- 1. Optimistic Scenatio Sales revenue increases by 15% p.a.(B2C) and 10% p.a. (B2B) Year 0 Year 1 Year 2 Year 3 Capital Investment (machines) -250,000,000 0 0 0 Sales Revenue (B2C) Estimated increase: 15% 25,725,000 29,583,750 34,021,313 Sales Revenue (B2B) p.a. 27,000,000 29,700,000 32,670,000 Other Income Estimated increase: 10% 600,000 700,000 800,000 Total Sales p.a. 53,325,000 59,983,750 67,491,313 Materials Cost -19,508,250 -21,934,988 -24,675,786 Labour Cost -14,931,000 -14,931,000 -14,931,000 Administrative Overheads -743,658 -743,658 -743,658 Rent for warehouse facilities -2,000,000 -2,000,000 -2,000,000 Total Operating Cost -37,182,908 -39,609,646 -42,350,444 EBDIT 16,142,092 20,374,104 25,140,869 Depreciation (at 10%) -25,000,000 -25,000,000 -25,000,000 Profit Before Tax -8,857,908 -4,625,896 140,869 Tax @ 33.33% 0 0 46,952 Profit After Tax -8,857,908 -4,625,896 93,917
- 2. Pessimistic Scenario Sales revenue increases by 10% p.a.(B2C) and 7.5% p.a. (B2B) Year 0 Year 1 Year 2 Capital Investment (machines) -250,000,000 0 0 Sales Revenue (B2C) Estimated increase: 10% 25,725,000 28,297,500 Sales Revenue (B2B) p.a. 27,000,000 29,025,000 Other Income Estimated increase: 7.5% 600,000 700,000 Total Sales p.a. 53,325,000 58,022,500 Materials Cost -19,508,250 -21,209,325 Labour Cost -14,931,000 -14,931,000 Administrative Overheads -743,658 -743,658 Rent for warehouse facilities -2,000,000 -2,000,000 Total Operating Cost -37,182,908 -38,883,983 EBDIT 16,142,092 19,138,517 Depreciation (at 10%) -25,000,000 -25,000,000 Profit Before Tax -8,857,908 -5,861,483 Tax @ 33.33% 0 0 Profit After Tax -8,857,908 -5,861,483
- 3. 5% p.a. (B2B) Year 3 Year 4 0 0 31,127,250 34,239,975 31,201,875 33,542,016 800,000 900,000 63,129,125 68,681,991 -23,061,776 -25,079,337 -14,931,000 -14,931,000 -743,658 -743,658 -2,000,000 -2,000,000 -40,736,434 -42,753,995 22,392,691 25,927,996 -25,000,000 -24,999,999 -2,607,309 927,997 0 309,301 -2,607,309 618,696
- 4. Estimated financials for recycling of 5 tonnes of e-waste 5 tonnes of computer waste: 5000kgs/27.2kgs (wt. of one component) = 183 nos. Waste estimation from 183 computers: Thus, taking a very conservative estimate of the materials recovered, total value of the recoverable materials from 183 compu The input cost of 183 computers (from various market sources) is approx. 183 x 600 (inclusive of the logistics) = Rs. 109800 Therefore difference: output–input = Rs. 1,78,308 Rs 1,78,308 will include the processing cost and profit for the recycler. Percentage cost distribution: - 38 per cent on input materials - 62 per cent on processing of materials and profit