5 THINGS TO KNOW ABOUT U.S. JULY PERFORMANCE DATA
•
0 likes•158 views

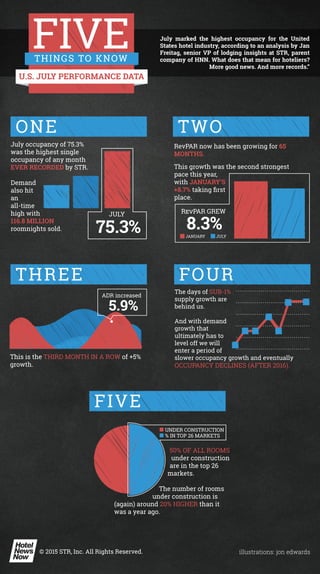
July marked the highest occupancy for the United States hotel industry, according to an analysis by Jan Freitag, senior VP of lodging insights at STR, parent company of HNN. What does that mean for hoteliers? More good news. And more records.”
Report
Share
Report
Share
Download to read offline
Recommended
5 things to know about U.S. March performance data
After talking about the Easter shift and the corresponding softness in RevPAR it finally happened. Well, sort of. When you look at March’s growth versus the first two months of the year, March data was really not that bad, according to STR SVP of lodging insights Jan Freitag. Here are five things you need to know about the data.
JAN FREITAG’S 5 THINGS TO KNOW ABOUT U.S. OCTOBER PERFORMANCE DATA
RevPAR growth for the US hotel industry in October was 6.5%, which is the fourth lowest for the year. While October RevPAR growth was positive, it was not as strong as in previous months despite having an extra Saturday. Five factors that influenced October hotel performance included: RevPAR growth for October being the highest since 2010; supply growth increasing for the third straight month; a lack of over 5% increases in average daily rate; and STR revising its forecasts down due to more muted RevPAR growth expected for the year.
5 THINGS TO KNOW ABOUT U.S. APRIL PERFORMANCE DATA
What goes down must come up. With that said, revenue-per-available-room growth was up,driven equally by increases in average -daily -rate and occupancy growth. April’s RevPAR increase was the best this year and the best since last October, but there are doubts that this marks the reversal of recent weak performance, according to STR’s SVP of lodging insights Jan Freitag. Here are five things you need to know about April’s U.S. performance data. (STR is the parent company of Hotel News Now.)
JAN FREITAG’S 5 THINGS TO KNOW ABOUT U.S. NOVEMBER PERFORMANCE DATA
If you take into consideration that the lowest RevPAR performance month was because of the Labor Day comp in August, November was really a new low point. Jan Freitag, senior VP of lodging insights for HNN parent company STR, breaks down performance data in the United States for November, saying the calendar did not help matters because we lost a Saturday (a high demand day) and gained a Monday (a so-so demand day) compared to November 2014. But this one day is not enough to really move the needle, so we have to come to terms with some underlying structural weakness that might be with us for some time to come. Here are five things to know about November’s data.
Sinclair.macro economicforecasting
The document discusses the reliability of macroeconomic forecasts. While forecasts may perform reasonably on average, they often fail to predict significant changes or misses in the economy. Forecasts are most likely to fail at key times when accuracy is needed most. Early government economic data is also often estimated and revised over time as more information becomes available. Therefore, it is important not to rely too heavily on single forecasts or early economic reports, but to consider private data and take forecasts with caution given their inherent unreliability.
Build a Content Plan
Mike Roberts presents this webinar on choosing high-opportunity topics to cover in your content plan.
5 THINGS TO KNOW ABOUT U.S. JANUARY PERFORMANCE DATA
In physics, molecular diffusion describes the movement of liquid particles at certain temperatures. The colder it gets, the less particles move. It turns out U.S. January revenue per available room also was such a particle, according to Jan Freitag, SVP of lodging insights for HNN’s parent company STR. Baby it’s (or was) cold outside.
Abuses Of Statistics
This document discusses several graphs and statistics that can be misleading. It provides examples of graphs that use scales to exaggerate differences, imply causation, or lack necessary context. Readers are advised to consider whether the data is presented accurately, whether the graph is trying to influence them, and whether margins of error are too large.
Abuses of statistics
This document discusses how graphs and statistics can be misleading. It provides examples of graphs that exaggerate differences through misleading scales or that imply correlations without sufficient evidence. Readers are advised to consider whether the data is presented accurately, whether the graph is trying to influence them, and whether conclusions follow when margins of error are large. Graphs should use regular intervals and present information clearly without biased implications.
Arbor U.S. Economic Overview 2018 q4
Arbor Realty's U.S. Economic Overview for 2018 q4 with insights on U.S. employment growth, the consumer price index, average earnings and the homeownership rate.
There are three kinds of lies
This document discusses how statistics can be misleading and manipulated. It provides examples of selection bias, such as only surveying a non-representative sample. Other ways statistics can be misleading include using biased questions, asking the wrong question, misleading graphs, implying causation from correlation, making results seem more precise than they are, and making up statistics. The document encourages critically analyzing data and graphs by checking for correct information, potential influence attempts, and proper scale usage. It also discusses how to manually manipulate real data and graphs to draw misleading conclusions.
Mercer Capital's Value Focus: Real Estate Industry | Q3 2017 | Segment Focus:...
The document summarizes residential real estate market trends in the third quarter of 2017. Key points include:
- Housing inventory remains low, constraining the market and putting upward pressure on home prices. New and existing home sales saw growth in the third quarter.
- Homeownership rates increased slightly in the third quarter from the prior year. New home construction rose significantly in September.
- Mortgage rates remain low by historical standards but increased in 2017 following Fed rate hikes.
- Commercial real estate prices and REIT returns showed modest growth in the third quarter, with industrial REITs performing strongest. M&A activity in real estate was flat compared to prior quarters.
Implied volatility explanation
Implied volatility represents the volatility that makes the theoretical value of an option equal to its market price. It is typically expressed as an annual percentage that represents how much a stock's price could move up or down in one standard deviation. The document explains how to convert implied annual volatility into expected price movements over different time periods like days or weeks by taking the square root of the fraction of days relative to a year. For example, a stock with 35% annual implied volatility would be expected to move up or down around 2.2% within one day, 4.93% within five days, and 9.86% within 20 days. The document demonstrates how to use these expected movements to assess risk for options positions.
Rethinking China- 30 sept 2021 - war-room slides
The negative vibes out of China keep getting worse. It wasn't just about Jack Ma, or Alibaba. It wasn’t just about state control of DiDi, or Evergrande, or any other specific target. Suddenly hostile to its own best companies and with debt defaults looming, the Chinese leadership is taking a hammer to the 30-year long investment narrative.
- Is China becoming uninvestable?
- What exposure do US investors face?
- Is talk of systemic risk overdone?
Join us as we revamp our China scenario, and discuss why crypto has been a miserable Yuan hedge, in the next HiddenLevers War Room.
The Power of Voice
The document discusses the rise of voice as the next big technology trend, noting that by 2017 voice will be a major focus area. It explains that voice assistants like Alexa can be used to play music, read books and headlines aloud, access recipes, fitness information, and answers to any questions just by speaking. The document predicts that within a few years, a third of all commands will be made by voice and Amazon will control about two-thirds of the voice market, having grown product searches started on its site from 44% in 2015 to 55% in 2016. It advises companies to understand voice as a medium, use multiple platforms to build their brand, focus on storytelling, make their data accessible, and build useful connections using
Listen In: How to Gain Insights from Conversations by Frank Cotignola of Mond...
Social Media and search behavior has forever changed the way we gather and interpret consumer insights. Through detailed examples, you’ll discover how to use social media and search data to uncover important insights that you can use in new product development, category “white space” analysis, and other broad trends that impact the consumer marketplace. Using a mixture of “paid” and “unpaid” tools, you’ll learn how social media and search data can help you uncover valuable consumer insights.
Us stock market june 1st week 2018
Advance level AI led analytics on US Stock Market. Get Personalized portfolio tracking, stock specific news updates for making better investment & trading decision. Be an expert in stock market exploring the tool. #StockMarket, #Trading, #Investment #FinancialPlanning, #WallStreet #InvestingGuide #Nasdaq #Dow
Arbor US Economic Overview 2018 Q1
The document provides an economic overview and projections for Q1 2018. It summarizes the Federal Reserve's projections for GDP growth, unemployment, inflation, and interest rates through 2020. It also reviews recent employment, wage growth, GDP, corporate profits, home prices, and other economic indicators. Overall, the outlook presented is for continued moderate economic expansion in the US.
Arbor US Economic Overview 2018 Q3
An overview of economic growth in US during q 3 of 2018. Overview includes data on: Economic Projections of the Federal Reserve Board, Employment Growth, Employment Growth by Industry, Employment Growth by Metropolitan Area, Consumer Price Index, Corporate Profits an Compensation of Employees, etc.
JAN FREITAG’S 5 THINGS TO KNOW ABOUT U.S. SEPTEMBER PERFORMANCE DATA
Revenue per available room in the US hotel industry increased 8% in September, reversing the 2.2% growth seen in August. The Labor Day calendar shift positively impacted September numbers, unlike the effect of the August calendar shift. The forecast for annual revenue growth remains at 6.8%, implying some increase in the fourth quarter. Economy hotels increased room rates 6.3% while upper-upscale hotels grew rates 2.4%, and lower-rated chains outperformed high-end hotels.
5 THINGS TO KNOW ABOUT US JUNE PERFORMANCE DATA
With revenue per available room now growing for 64 months, June was another good month for the U.S. hotel industry, according to an analysis by STR’s Jan Freitag. Here are five things you need to know about the data.
5 THINGS TO KNOW ABOUT U.S. AUGUST PERFORMANCE DATA
Revenue-per-available-room growth for the United States hotel industry slowed during August. But Jan Freitag, senior VP of lodging insights for HNN’s parent company STR, said that’s partly because Labor Day weekend wasn’t during the same week as last year, and it also wasn’t even in the same month. Here are five things you need to know about August’s data.
5 things to know about U.S. February performance data
While US hotel industry revenue per available room (RevPAR) growth was slightly higher in February than January, it remained below the long-term average for February. The report notes that RevPAR growth has been positive for the past 72 months and the analyst expects it to remain positive for the next 18 months, although increases will continue to be small. Occupancy declined across all hotel chain scales in February, most sharply in midscale and economy segments, as room supply growth continued to outpace demand growth for the second consecutive month.
FREITAG'S 5 INFOGRAPHIC DECEMEBER 2014
November showed the impact a single day in calendar shift can have on the United States hotel
industry. November 2014 had one more Sunday (a low-demand day) and one less Friday (high demand)
than November 2013, resulting in the lowest demand growth since January, according to an analysis
from Jan Freitag, senior VP of strategic development for STR, parent company of HNN.
Jan Freitag’s 5 things to Know U.S. August Performance Data
As supply continues to increase and widen its lead over demand, the U.S. hotel industry reported continued occupancy declines, as occupancy fell 0.4% in August. Jan Freitag, SVP of lodging insights at STR, HNN’s parent company, gives his take on how the chain scales performed, which markets show above-average supply growth and more.
Yardi-Matrix-Monthly-Jun-2016
U.S. apartment rents rose 0.9% in June according to a survey, marking the third straight month of double-digit gains. Rents were up 2.7% in the second quarter and 5.6% year-over-year. The national average rent reached a new high of $1,213. Rent growth has been led by West Coast markets like San Francisco, Sacramento, and Seattle, though some Northeast and Mid-Atlantic markets showed strengthening as well in the latest period. Occupancy remained strong at 96.1% nationally for the third month in a row.
Daily Economic Update for August 31, 2010
The Case-Shiller 20-city home price index rose 0.3% in June and 4.2% from June 2009, with San Francisco, San Diego, and Minneapolis seeing gains over 10% while Seattle, Charlotte, and Las Vegas saw declines of at least 2%. The Conference Board's consumer confidence index increased 4.9% in August to 53.5, though still below 54.5 in August 2009, driven mainly by higher expectations for the next six months. Increases in consumer confidence and home prices indicate growing consumer demand, which benefits the existing home market, but both remain below historical averages.
5 THINGS TO KNOW ABOUT THE US PIPELINE
The U.S. hotel industry is seeing supply growth pick up, with the most significant spike expected to come in summer 2016, according Julie Gafney, VP of the database operations center for STR, parent company of Hotel News Now.
5 THINGS TO KNOW ABOUT US DECEMBER PERFORMANCE DATA
December saw no calendar shifts, and the amount of weekdays and weekends remained the same. The argument could be made that because the 31st fell on a Thursday (making the following Friday a holiday and hence producing a very long weekend) it could have enticed longer trips, but we did not see any of that, said Jan Freitag, SVP of lodging insights at HNN’s parent company STR. Here are five things you need to know about December’s hotel performance.
Market Takes a Breather - The Real Estate Report July/August
The Real Estate Report July/August, local market trends San Francisco: "Market Takes a Breather" by AMSI's Real Estate Broker Robb Fleischer
More Related Content
What's hot
Abuses of statistics
This document discusses how graphs and statistics can be misleading. It provides examples of graphs that exaggerate differences through misleading scales or that imply correlations without sufficient evidence. Readers are advised to consider whether the data is presented accurately, whether the graph is trying to influence them, and whether conclusions follow when margins of error are large. Graphs should use regular intervals and present information clearly without biased implications.
Arbor U.S. Economic Overview 2018 q4
Arbor Realty's U.S. Economic Overview for 2018 q4 with insights on U.S. employment growth, the consumer price index, average earnings and the homeownership rate.
There are three kinds of lies
This document discusses how statistics can be misleading and manipulated. It provides examples of selection bias, such as only surveying a non-representative sample. Other ways statistics can be misleading include using biased questions, asking the wrong question, misleading graphs, implying causation from correlation, making results seem more precise than they are, and making up statistics. The document encourages critically analyzing data and graphs by checking for correct information, potential influence attempts, and proper scale usage. It also discusses how to manually manipulate real data and graphs to draw misleading conclusions.
Mercer Capital's Value Focus: Real Estate Industry | Q3 2017 | Segment Focus:...
The document summarizes residential real estate market trends in the third quarter of 2017. Key points include:
- Housing inventory remains low, constraining the market and putting upward pressure on home prices. New and existing home sales saw growth in the third quarter.
- Homeownership rates increased slightly in the third quarter from the prior year. New home construction rose significantly in September.
- Mortgage rates remain low by historical standards but increased in 2017 following Fed rate hikes.
- Commercial real estate prices and REIT returns showed modest growth in the third quarter, with industrial REITs performing strongest. M&A activity in real estate was flat compared to prior quarters.
Implied volatility explanation
Implied volatility represents the volatility that makes the theoretical value of an option equal to its market price. It is typically expressed as an annual percentage that represents how much a stock's price could move up or down in one standard deviation. The document explains how to convert implied annual volatility into expected price movements over different time periods like days or weeks by taking the square root of the fraction of days relative to a year. For example, a stock with 35% annual implied volatility would be expected to move up or down around 2.2% within one day, 4.93% within five days, and 9.86% within 20 days. The document demonstrates how to use these expected movements to assess risk for options positions.
Rethinking China- 30 sept 2021 - war-room slides
The negative vibes out of China keep getting worse. It wasn't just about Jack Ma, or Alibaba. It wasn’t just about state control of DiDi, or Evergrande, or any other specific target. Suddenly hostile to its own best companies and with debt defaults looming, the Chinese leadership is taking a hammer to the 30-year long investment narrative.
- Is China becoming uninvestable?
- What exposure do US investors face?
- Is talk of systemic risk overdone?
Join us as we revamp our China scenario, and discuss why crypto has been a miserable Yuan hedge, in the next HiddenLevers War Room.
The Power of Voice
The document discusses the rise of voice as the next big technology trend, noting that by 2017 voice will be a major focus area. It explains that voice assistants like Alexa can be used to play music, read books and headlines aloud, access recipes, fitness information, and answers to any questions just by speaking. The document predicts that within a few years, a third of all commands will be made by voice and Amazon will control about two-thirds of the voice market, having grown product searches started on its site from 44% in 2015 to 55% in 2016. It advises companies to understand voice as a medium, use multiple platforms to build their brand, focus on storytelling, make their data accessible, and build useful connections using
Listen In: How to Gain Insights from Conversations by Frank Cotignola of Mond...
Social Media and search behavior has forever changed the way we gather and interpret consumer insights. Through detailed examples, you’ll discover how to use social media and search data to uncover important insights that you can use in new product development, category “white space” analysis, and other broad trends that impact the consumer marketplace. Using a mixture of “paid” and “unpaid” tools, you’ll learn how social media and search data can help you uncover valuable consumer insights.
Us stock market june 1st week 2018
Advance level AI led analytics on US Stock Market. Get Personalized portfolio tracking, stock specific news updates for making better investment & trading decision. Be an expert in stock market exploring the tool. #StockMarket, #Trading, #Investment #FinancialPlanning, #WallStreet #InvestingGuide #Nasdaq #Dow
Arbor US Economic Overview 2018 Q1
The document provides an economic overview and projections for Q1 2018. It summarizes the Federal Reserve's projections for GDP growth, unemployment, inflation, and interest rates through 2020. It also reviews recent employment, wage growth, GDP, corporate profits, home prices, and other economic indicators. Overall, the outlook presented is for continued moderate economic expansion in the US.
Arbor US Economic Overview 2018 Q3
An overview of economic growth in US during q 3 of 2018. Overview includes data on: Economic Projections of the Federal Reserve Board, Employment Growth, Employment Growth by Industry, Employment Growth by Metropolitan Area, Consumer Price Index, Corporate Profits an Compensation of Employees, etc.
What's hot (11)
Mercer Capital's Value Focus: Real Estate Industry | Q3 2017 | Segment Focus:...
Mercer Capital's Value Focus: Real Estate Industry | Q3 2017 | Segment Focus:...
Listen In: How to Gain Insights from Conversations by Frank Cotignola of Mond...
Listen In: How to Gain Insights from Conversations by Frank Cotignola of Mond...
Similar to 5 THINGS TO KNOW ABOUT U.S. JULY PERFORMANCE DATA
JAN FREITAG’S 5 THINGS TO KNOW ABOUT U.S. SEPTEMBER PERFORMANCE DATA
Revenue per available room in the US hotel industry increased 8% in September, reversing the 2.2% growth seen in August. The Labor Day calendar shift positively impacted September numbers, unlike the effect of the August calendar shift. The forecast for annual revenue growth remains at 6.8%, implying some increase in the fourth quarter. Economy hotels increased room rates 6.3% while upper-upscale hotels grew rates 2.4%, and lower-rated chains outperformed high-end hotels.
5 THINGS TO KNOW ABOUT US JUNE PERFORMANCE DATA
With revenue per available room now growing for 64 months, June was another good month for the U.S. hotel industry, according to an analysis by STR’s Jan Freitag. Here are five things you need to know about the data.
5 THINGS TO KNOW ABOUT U.S. AUGUST PERFORMANCE DATA
Revenue-per-available-room growth for the United States hotel industry slowed during August. But Jan Freitag, senior VP of lodging insights for HNN’s parent company STR, said that’s partly because Labor Day weekend wasn’t during the same week as last year, and it also wasn’t even in the same month. Here are five things you need to know about August’s data.
5 things to know about U.S. February performance data
While US hotel industry revenue per available room (RevPAR) growth was slightly higher in February than January, it remained below the long-term average for February. The report notes that RevPAR growth has been positive for the past 72 months and the analyst expects it to remain positive for the next 18 months, although increases will continue to be small. Occupancy declined across all hotel chain scales in February, most sharply in midscale and economy segments, as room supply growth continued to outpace demand growth for the second consecutive month.
FREITAG'S 5 INFOGRAPHIC DECEMEBER 2014
November showed the impact a single day in calendar shift can have on the United States hotel
industry. November 2014 had one more Sunday (a low-demand day) and one less Friday (high demand)
than November 2013, resulting in the lowest demand growth since January, according to an analysis
from Jan Freitag, senior VP of strategic development for STR, parent company of HNN.
Jan Freitag’s 5 things to Know U.S. August Performance Data
As supply continues to increase and widen its lead over demand, the U.S. hotel industry reported continued occupancy declines, as occupancy fell 0.4% in August. Jan Freitag, SVP of lodging insights at STR, HNN’s parent company, gives his take on how the chain scales performed, which markets show above-average supply growth and more.
Yardi-Matrix-Monthly-Jun-2016
U.S. apartment rents rose 0.9% in June according to a survey, marking the third straight month of double-digit gains. Rents were up 2.7% in the second quarter and 5.6% year-over-year. The national average rent reached a new high of $1,213. Rent growth has been led by West Coast markets like San Francisco, Sacramento, and Seattle, though some Northeast and Mid-Atlantic markets showed strengthening as well in the latest period. Occupancy remained strong at 96.1% nationally for the third month in a row.
Daily Economic Update for August 31, 2010
The Case-Shiller 20-city home price index rose 0.3% in June and 4.2% from June 2009, with San Francisco, San Diego, and Minneapolis seeing gains over 10% while Seattle, Charlotte, and Las Vegas saw declines of at least 2%. The Conference Board's consumer confidence index increased 4.9% in August to 53.5, though still below 54.5 in August 2009, driven mainly by higher expectations for the next six months. Increases in consumer confidence and home prices indicate growing consumer demand, which benefits the existing home market, but both remain below historical averages.
5 THINGS TO KNOW ABOUT THE US PIPELINE
The U.S. hotel industry is seeing supply growth pick up, with the most significant spike expected to come in summer 2016, according Julie Gafney, VP of the database operations center for STR, parent company of Hotel News Now.
5 THINGS TO KNOW ABOUT US DECEMBER PERFORMANCE DATA
December saw no calendar shifts, and the amount of weekdays and weekends remained the same. The argument could be made that because the 31st fell on a Thursday (making the following Friday a holiday and hence producing a very long weekend) it could have enticed longer trips, but we did not see any of that, said Jan Freitag, SVP of lodging insights at HNN’s parent company STR. Here are five things you need to know about December’s hotel performance.
Market Takes a Breather - The Real Estate Report July/August
The Real Estate Report July/August, local market trends San Francisco: "Market Takes a Breather" by AMSI's Real Estate Broker Robb Fleischer
The Real Estate Report May/June - Prices Hit All-Time Highs
- The median home sale price in San Francisco reached $1,000,000 for the first time ever in April, while the median condo price was $855,000, also an all-time high.
- The sales to list price ratio was 108.2% for homes and 105.2% for condos, both at their highest levels since 2005, indicating a very competitive market for buyers.
- Inventory is extremely low, with only 506 total homes, condos, and lofts for sale in San Francisco as of early April, representing a three week supply versus a normal six month supply.
8
The document discusses differing views on the state of the US housing market recovery:
1) Some data and analysts suggest the housing market recovery is making slow but steady progress, with housing indices and sales increasing gradually over time.
2) However, others note that the slow rate of recovery remains a concern, and many local markets and homeowners are still not feeling the effects of the economic recovery.
3) Economists have become more optimistic about the housing outlook over the next two years due to an improving job market, but views still differ on how quickly the market will normalize.
Similar to 5 THINGS TO KNOW ABOUT U.S. JULY PERFORMANCE DATA (13)
JAN FREITAG’S 5 THINGS TO KNOW ABOUT U.S. SEPTEMBER PERFORMANCE DATA
JAN FREITAG’S 5 THINGS TO KNOW ABOUT U.S. SEPTEMBER PERFORMANCE DATA
5 THINGS TO KNOW ABOUT U.S. AUGUST PERFORMANCE DATA
5 THINGS TO KNOW ABOUT U.S. AUGUST PERFORMANCE DATA
5 things to know about U.S. February performance data
5 things to know about U.S. February performance data
Jan Freitag’s 5 things to Know U.S. August Performance Data
Jan Freitag’s 5 things to Know U.S. August Performance Data
5 THINGS TO KNOW ABOUT US DECEMBER PERFORMANCE DATA
5 THINGS TO KNOW ABOUT US DECEMBER PERFORMANCE DATA
Market Takes a Breather - The Real Estate Report July/August
Market Takes a Breather - The Real Estate Report July/August
The Real Estate Report May/June - Prices Hit All-Time Highs
The Real Estate Report May/June - Prices Hit All-Time Highs
More from HOTEL NEWS NOW (STR)
5 things to know about Easter hotel performance
This document analyzes hotel performance data over the 2016 Easter holiday weekend. It reports that among major global markets, Kyoto, Japan and Macau, China had the highest Easter eve occupancy rates at 98.4% and 98.1% respectively. In the US, New York City and the Florida Keys had the highest Easter eve occupancy rates at 92.2% and 91.5%. Additionally, Easter eve average daily rates in the US have exceeded $100 for the past five years, with only 2008 previously reaching over $100. Globally, hotel occupancy and rates are typically higher on the Saturday before Easter than on Easter Sunday itself.
Consumers Don't Know Much About Cybersecurity
At a time when hotels need to take every precaution to avoid falling victim to a data breach and being branded as insecure, consumers don't seem to know much about the security issues that worry them.
The Biggest Hotel Companies by Market Cap
Marriott International and Hilton clearly lead the way for publicly listed hotel companies in terms of market capitalization, but both lag well behind the largest players in the overall world of travel.
3 Top Tech Trends for 2017
Sabre Labs has identified three emerging technologies that could influence the travel industry this year.
The In-Room Tech Guests Really Want
A recent survey of U.S. guests from Oracle Hospitality and Phocuswright shows that guests have strong opinions about in-room Wi-Fi. temperature and light controls, entertainment and technology-assisted housekeeping.
Jan Freitag’s 5 things to Know U.S. January Performance Data
Luxury and upper upscale hotel chains saw RevPAR growth of 7.1% and 4.3% respectively in January, driven by healthy increases in average daily rates. The inauguration of the US President led to double-digit RevPAR growth in 10 markets including Washington D.C. at 77.1%, boosting occupancy and rates. However, outside the top 25 markets, hotel occupancy remained below 50% for January.
The World's Largest
A glance at the world's largest hotel companies, brands, properties, pipelines and global markets by room count. All figures are as of December 2016, according to STR.
Some guests will share data for rewards
New research from GfK shows roughly a quarter of consumers are willing to be open with companies about their personal data if they're getting something in return.
Jan Freitag’s 5 things to Know U.S. December Performance Data
Closing out a year of both new records and disappointments, U.S. hotel performance in December was decidedly average.
New Year's Eve cocktails from around the world
Looking for a good hotel bar with great cocktails this New Year’s Eve? Look no further. Here are a few favorite cocktail recipes from hoteliers and F&B experts in NYE markets around the world.
How Corporate Travelers Use Mobile
Widespread adoption of smartphones has changed corporate travel habits, but behaviors vary between the U.S. and Europe.
Jan Freitag’s 5 things to Know U.S. October Performance Data
Key performance indicators, as expected, show the hotel industry riding out the curve in October, with RevPAR growing for the 80th straight month, but at the slowest rate this year.
5 things to know about Thanksgiving Travel
Data suggests hoteliers in top markets for Thanksgiving travel should prepare for a record number of guests this holiday weekend.
Defend against these types of data breaches
Hackers take numerous approaches to probe for and exploit weaknesses in corporate computer systems in their hunt for valuable personal and financial information.
The State of Chip and Pin Technology
A year after the launch of chip payment, businesses and consumers are still working to get a handle on the technology, while card processors say they’ve seen improvement.
Marriott & Starwood by the numbers
Marriott International’s acquisition of Starwood Hotels & Resorts Worldwide resulted in a behemoth of 27 hotel brands.
Here’s a look at some of the numbers at play in the deal.
Expectations for mobile
A recent survey of executives from Open Mobile Media shows how the business community expects to prioritize mobile development.
Mobile is Everywhere for Hotel Guests
Mobile devices like smartphones are ranked as the most important travel accessory, and potential guests use them to book travel in various situations, according to data from Hotels.com.
Utilities & Labor Costs at a glance
The 2016 HOST Almanac indicates utility costs were down across the country in 2015 and were particularly low in the central regions. Labor costs are poised to increase in many markets over the next few years. Data from the 2016 HOST Almanac shows the regions with the highest labor costs were the Mid-Atlantic, Paci c and East North Central.
10 ways to improve your hotel’s Pinterest strategy
Hotel marketers should consider Pinterest a priority since it plays a key role at both the aspirational and planning stages of the travel-decision-making process.
More from HOTEL NEWS NOW (STR) (20)
Jan Freitag’s 5 things to Know U.S. January Performance Data
Jan Freitag’s 5 things to Know U.S. January Performance Data
Jan Freitag’s 5 things to Know U.S. December Performance Data
Jan Freitag’s 5 things to Know U.S. December Performance Data
Jan Freitag’s 5 things to Know U.S. October Performance Data
Jan Freitag’s 5 things to Know U.S. October Performance Data
10 ways to improve your hotel’s Pinterest strategy
10 ways to improve your hotel’s Pinterest strategy
Recently uploaded
How To Change A Name On American Airlines Ticket.pptx
You can easily change/correct a name on your flight ticket under the American Airlines name change policy. The airline provides multiple online and offline modes to place a name change request. To learn more about how to change a name on American Airlines ticket, you can directly approach the airline’s customer support. Moreover, you can connect with a flight expert at +1-866-738-0741 for quick assistance.
Wayanad-The-Touristry-Heaven to the tour.pptx
Wayanad, nestled in Kerala's Western Ghats, is a lush paradise renowned for its scenic landscapes, rich biodiversity, and cultural heritage. From trekking Chembra Peak to exploring ancient Edakkal Caves, Wayanad offers thrilling adventures and serene experiences. Its vibrant economy, driven by agriculture and tourism, highlights a harmonious blend of nature, tradition, and modernity.
How To Change Your Name On American Airlines Aadvantage.pptx
American Airlines permits passengers to change/correct names on their AAdvantage account. Also, you can request a name change both online via a web portal and offline over the phone. For further information on how to change your name on American Airlines Advantage, get in touch with the airline’s customer service. Also, you can reach out to a consolidation desk at +1-866-738-0741 for quick assistance.
Agama Tours&Safaris-Kilimanjaro day trip
Guaranteed departures to Tanzania most memorable wildlife safari and kilimanjaro climbing in
Excursions in Tahiti Island Adventure
Our excursions in tahiti offer stunning lagoon tours, vibrant marine life encounters, and cultural experiences. We ensure unforgettable adventures amidst breathtaking landscapes and serene waters. For more information, mail us at tracey@uniquetahiti.com.
How Do I Plan a Kilimanjaro Climb? 7 Essential Tips Revealed.pdf
How do I plan a Kilimanjaro Climb?
Planning to climb Mount Kilimanjaro is an exciting yet detailed process. Here’s a step-by-step guide to help you prepare for this incredible adventure.
What Challenges Await Beginners in Snowshoeing
Discover the exhilarating world of snowshoeing through our presentation, highlighting the challenges faced by beginners. From physical exertion to technical finesse and braving harsh winter conditions, each step in the snow brings new obstacles and unforgettable adventures. Embrace the challenge and conquer the winter wonderland with confidence!
Assessing the Influence of Transportation on the Tourism Industry in Nigeria
This research dissertation investigates the complex interplay between transportation and the tourism industry in Nigeria, aiming to unravel critical insights that contribute to the enhancement of the overall tourist experience. The study employs a multi-faceted approach, literature review establishes a robust theoretical framework, incorporating The Service Quality and Satisfaction Theory to guide the research questions and hypotheses.
The methodology involves the distribution of a structured questionnaire, ensuring a representative sample and facilitating a comprehensive analysis of the gathered data.
Key findings include the nuanced perceptions of transportation infrastructure adequacy, safety and security concerns, financial influences on travel decisions, and the cultural and ecological impacts of transportation choices. These findings culminate in a comprehensive set of recommendations for policymakers and practitioners in the Nigerian tourism industry. The findings contribute to the existing literature by providing actionable insights for policymakers, stakeholders, and researchers in the Nigerian tourism sector.
The recommendations encompass gender-sensitive planning, infrastructure enhancements, safety measures, and strategic interventions to address financial constraints, ensuring a holistic and sustainable development of the tourism industry in Nigeria.
Author: Imafidon Osademwingie Martins
Best Places to Stay in New Brunswick, Canada.
New Brunswick, a picturesque province in eastern Canada, offers a plethora of unique and charming places to stay for every kind of traveler. From the historic allure of Fredericton and the vibrant culture of Saint John to the natural beauty of Fundy National Park and the serene coastal towns like St. Andrews by-the-Sea, there's something for everyone. Whether you prefer luxury resorts, cozy inns, rustic lodges, or budget-friendly options, the best places to stay in New Brunswick ensure a memorable stay, allowing you to fully immerse yourself in the province's rich history, stunning landscapes, and warm hospitality.
https://www.mmanor.ca/blog/best-5-bed-and-breakfast-new-brunswick-canada
Top 10 Tourist Places in South India to Explore.pdf
Get the information here about top 10 tourist places in South India to explore with your family or friends by a taxi booked from Bharat Taxi.
在线办理(BU毕业证书)波士顿大学毕业证录取通知书一模一样
学校原件一模一样【微信:741003700 】《(BU毕业证书)波士顿大学毕业证》【微信:741003700 】学位证,留信认证(真实可查,永久存档)原件一模一样纸张工艺/offer、雅思、外壳等材料/诚信可靠,可直接看成品样本,帮您解决无法毕业带来的各种难题!外壳,原版制作,诚信可靠,可直接看成品样本。行业标杆!精益求精,诚心合作,真诚制作!多年品质 ,按需精细制作,24小时接单,全套进口原装设备。十五年致力于帮助留学生解决难题,包您满意。
本公司拥有海外各大学样板无数,能完美还原。
1:1完美还原海外各大学毕业材料上的工艺:水印,阴影底纹,钢印LOGO烫金烫银,LOGO烫金烫银复合重叠。文字图案浮雕、激光镭射、紫外荧光、温感、复印防伪等防伪工艺。材料咨询办理、认证咨询办理请加学历顾问Q/微741003700
【主营项目】
一.毕业证【q微741003700】成绩单、使馆认证、教育部认证、雅思托福成绩单、学生卡等!
二.真实使馆公证(即留学回国人员证明,不成功不收费)
三.真实教育部学历学位认证(教育部存档!教育部留服网站永久可查)
四.办理各国各大学文凭(一对一专业服务,可全程监控跟踪进度)
如果您处于以下几种情况:
◇在校期间,因各种原因未能顺利毕业……拿不到官方毕业证【q/微741003700】
◇面对父母的压力,希望尽快拿到;
◇不清楚认证流程以及材料该如何准备;
◇回国时间很长,忘记办理;
◇回国马上就要找工作,办给用人单位看;
◇企事业单位必须要求办理的
◇需要报考公务员、购买免税车、落转户口
◇申请留学生创业基金
留信网认证的作用:
1:该专业认证可证明留学生真实身份
2:同时对留学生所学专业登记给予评定
3:国家专业人才认证中心颁发入库证书
4:这个认证书并且可以归档倒地方
5:凡事获得留信网入网的信息将会逐步更新到个人身份内,将在公安局网内查询个人身份证信息后,同步读取人才网入库信息
6:个人职称评审加20分
7:个人信誉贷款加10分
8:在国家人才网主办的国家网络招聘大会中纳入资料,供国家高端企业选择人才
Un viaje a Buenos Aires y sus alrededores
A travelogue of my recent trip to Argentina, most to Buenos Aires, but including excursion to Iguazú waterfalls, Tigre, and Colonia del Sacramento in Uruguay
Discovering Egypt A Step-by-Step Guide to Planning Your Trip.ppt
Travelling to Egypt is like stepping into a time capsule where the past and present coexist, offering a unique blend of history, culture, and stunning landscapes.
See more: https://imperialegypt.com/tour-packages/
Recently uploaded (15)
How To Change A Name On American Airlines Ticket.pptx
How To Change A Name On American Airlines Ticket.pptx
How To Change Your Name On American Airlines Aadvantage.pptx
How To Change Your Name On American Airlines Aadvantage.pptx
How Do I Plan a Kilimanjaro Climb? 7 Essential Tips Revealed.pdf
How Do I Plan a Kilimanjaro Climb? 7 Essential Tips Revealed.pdf
Assessing the Influence of Transportation on the Tourism Industry in Nigeria
Assessing the Influence of Transportation on the Tourism Industry in Nigeria
Top 10 Tourist Places in South India to Explore.pdf
Top 10 Tourist Places in South India to Explore.pdf
Discovering Egypt A Step-by-Step Guide to Planning Your Trip.ppt
Discovering Egypt A Step-by-Step Guide to Planning Your Trip.ppt
5 THINGS TO KNOW ABOUT U.S. JULY PERFORMANCE DATA
- 1. July marked the highest occupancy for the United States hotel industry, according to an analysis by Jan Freitag, senior VP of lodging insights at STR, parent company of HNN. What does that mean for hoteliers? More good news. And more records.” July occupancy of 75.3% was the highest single occupancy of any month EVER RECORDED by STR. Demand also hit an all-time high with 116.8 MILLION roomnights sold. ONE THINGS TO KNOW U.S. JULY PERFORMANCE DATA JULY TWO RevPAR now has been growing for 65 MONTHS. This growth was the second strongest pace this year, with JANUARY’S +8.7% taking first place. 8.3% RevPAR GREW THREE This is the THIRD MONTH IN A ROW of +5% growth. ADR increased 5.9% FOUR JANUARY JULY The days of SUB-1% supply growth are behind us. And with demand growth that ultimately has to level off we will enter a period of slower occupancy growth and eventually OCCUPANCY DECLINES (AFTER 2016). FIVE 50% OF ALL ROOMS under construction are in the top 26 markets. The number of rooms under construction is (again) around 20% HIGHER than it was a year ago. UNDER CONSTRUCTION % IN TOP 26 MARKETS © 2015 STR, Inc. All Rights Reserved. illustrations: jon edwards