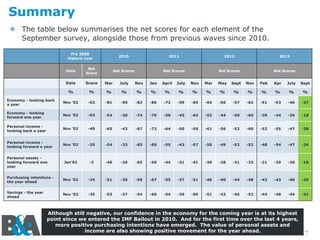
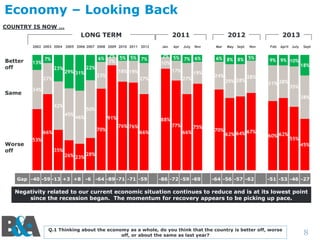
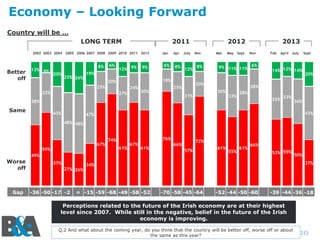
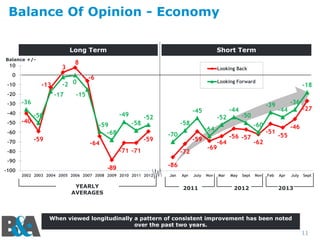
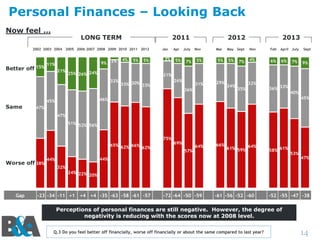
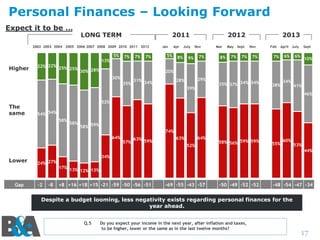
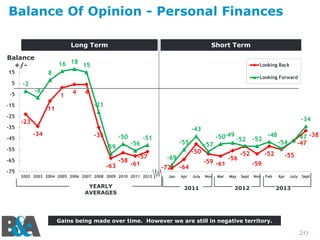
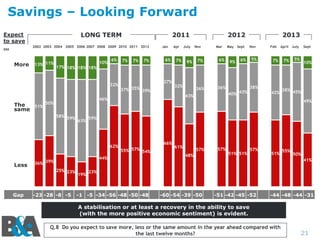
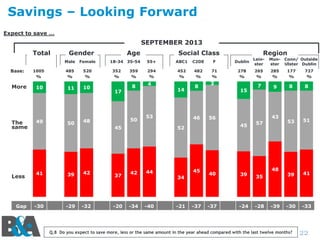
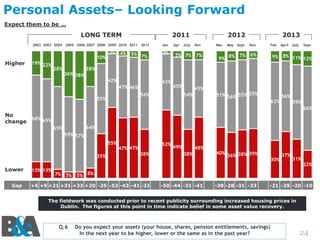
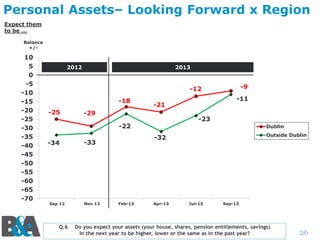
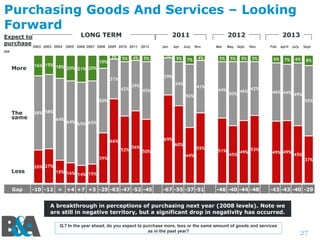
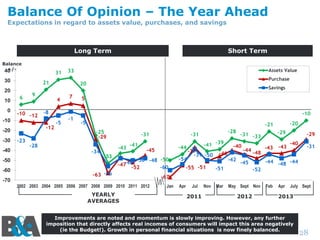
- Consumer confidence in Ireland is showing signs of improvement according to the latest survey by Behaviour & Attitudes. While still negative, perceptions of the economy and personal finances over the next year have risen to their highest levels since before the financial crisis.
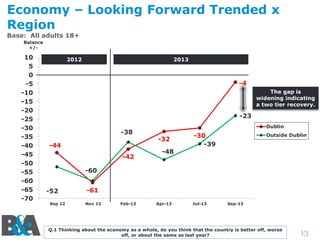
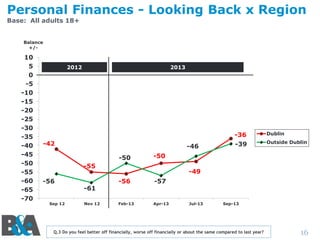
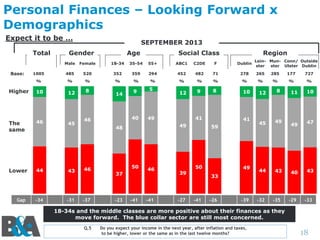
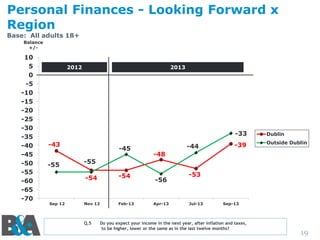
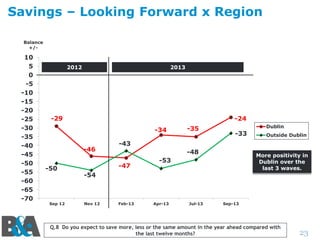
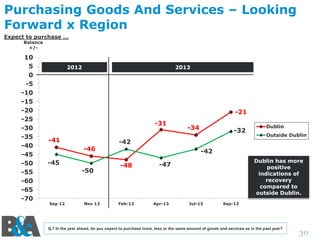
- The recovery appears to be stronger in Dublin compared to the rest of Ireland. Dublin residents are significantly more positive about the economy and their financial prospects than those outside Dublin, and this gap is widening.
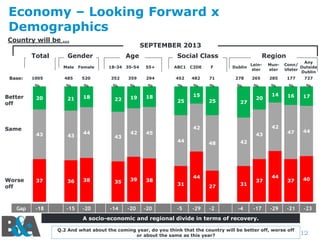
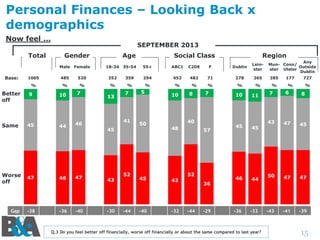
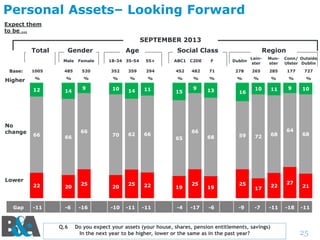
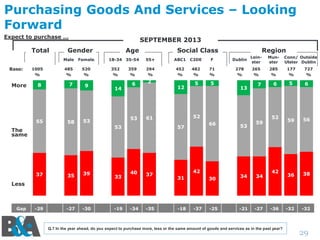
- There are also divisions according to socioeconomic class, with middle and upper class citizens expressing more optimism than blue-collar workers. Younger people also view the future more positively than older respondents.
2. Introduction
This report presents the findings of the latest phase of the Behaviour &
Attitudes’ Consumer Confidence Tracker.
Survey results for this phase are based on a sample of 1,001 adults aged
16+, quota controlled in terms of age, gender, socio-economic class and
region to reflect the profile of the adult population of the Republic of
Ireland.
All interviewing on the survey is conducted on our fortnightly face-to-face
Barometer by trained members of the B&A field force working under
ESOMAR guidelines.
Fieldwork on the latest wave was carried out between 6th and 20th
September, 2013.
2
3. About Behaviour & Attitudes
Behaviour and Attitudes is Ireland’s largest and most experienced
independently owned research company.
We pride ourselves on having the most experienced director team
in Ireland. All projects have a director involved.
Established over 25 years ago, Behaviour and Attitudes provides a full
range of market research services, ranging from CAPI, CATI, online and of
course qualitative.
Specialist sectors include: Retail & Shopper, Technology & Telecoms, Media,
Financial, Political & Social, Polling, Automotive, Healthcare and Public
Sector & Utilities.
For more information please visit our website at: www.banda.ie or contact
us on +353 1 2057500.
3
5. Summary
In line with other economic indicators such as the recent CSO Residential
Property Price Index (year to August 2013) consumer confidence for the
coming year has risen significantly. Although still negative, confidence is
now at its highest point since we entered the IMF Bailout in 2010. Thus the
momentum for recovery appears to be picking up pace. If we also factor in
the recent ESRI 2014 growth forecasts the picture is one of increased
positivity.
However, a two-paced recovery in sentiment is evident. While both Dublin
and outside Dublin are displaying more positive sentiment toward the
economy, Dubliners are significantly more positive, and the gap regionally is
widening.
The divisions in our society are also evident with the middle-upper class
(ABC1) and the farming sector (F) significantly more positive in outlook
compared to the blue collar (C2DE) sector.
Despite a budget looming, less negativity exists regarding personal finances
for the year ahead. However we need to be cognisant of the sharp divide
between the white and blue collar sectors. Also those over 35 years of age
are more negative regarding their income next year. Note this cohort has
more responsibility and are more conservative in outlook.
5
6. Summary
Our discretionary income measure is also indicating a stablisation after five
years of decline. However, note we are still at 2001 levels.
We are also witnessing a recovery or at least a levelling off in the perceived
ability to save. Again the Dublin region is less negative compared to those
outside Dublin across 2013.
Overall any growth in personal financial perceptions is finely balanced. We
must remember that the Irish consumer is sensitive, as is the Irish
economy, to external reports and trends. However consumers, especially
those in Dublin, have a more positive outlook towards 2014. It will be
important to track and understand how the various cohorts of our society
emerge from these ‘dark times’ as we are witnessing societal divisions.
6
7. Summary
The table below summarises the net scores for each element of the
September survey, alongside those from previous waves since 2010.
Pre 2008
Historic Low
2010
2011
2012
2013
Net Scores
Net Scores
Net Scores
Net Scores
Date
Net
Score
Date
Score
Mar
July
Nov
Jan
April
July
Nov
Mar
May
Sept
Nov
Feb
Apr
July
Sept
%
%
%
%
%
%
%
%
%
%
%
%
%
%
%
%
%
Economy - looking back
a year
Nov '02
-62
-81
-50
-82
-86
-72
-59
-69
-64
-56
-57
-62
-51
-53
-46
-27
Economy - looking
forward one year
Nov '02
-63
-54
-20
-74
-70
-58
-45
-64
-52
-44
-50
-60
-39
-44
-36
-18
Personal income looking back a year
Nov '02
-40
-65
-43
-67
-72
-64
-50
-59
-61
-56
-52
-60
-52
-55
-47
-38
Personal income looking forward a year
Nov '02
-20
-54
-33
-65
-69
-55
-43
-57
-50
-49
-52
-52
-48
-54
-47
-34
Personal assets looking forward one
year
Jan'02
-2
-49
-26
-55
-50
-44
-31
-41
-39
-28
-31
-33
-21
-29
-20
-10
Purchasing intentions the year ahead
Nov '02
-24
-51
-36
-56
-67
-55
-37
-51
-46
-40
-44
-48
-43
-43
-40
-29
Savings - the year
ahead
Nov '02
-35
-53
-37
-54
-60
-54
-39
-50
-51
-42
-45
-52
-44
-48
-44
-31
Although still negative, our confidence in the economy for the coming year is at its highest
point since we entered the IMF Bailout in 2010. And for the first time over the last 4 years,
more positive purchasing intentions have emerged. The value of personal assets and
income are also showing positive movement for the year ahead.
7
8. Economy – Looking Back
COUNTRY IS NOW …
LONG TERM
2011
2002 2003 2004 2005 2006 2007 2008 2009 2010 2011 2012
Better
off
13%
6% 2% 5% 5% 7%
7%
7%
23%
29% 31%
22%
Same
July
Nov
17%
27%
19%
27%
Mar
May Sept
2013
Nov
6% 8% 8% 5%
24%
29% 28%
28%
Feb
April July
9% 9% 10%
31% 28%
34%
Sept
18%
35%
38%
42%
45%
50%
46%
91%
70%
66%
Worse
off
Apr
2% 5%
7% 6%
10%
18% 19%
23%
27%
Jan
2012
88%
77%
76% 76%
66%
66%
75%
53%
35%
70%
67%
62% 64%
60% 62%
55%
45%
26% 23% 28%
Gap -40 -59 -13 +3 +8 -6 -64 -89 -71 -71 -59
-86 -72 -59 -69
-64 -56 -57 -62
-51 -53 -46 -27
Negativity related to our current economic situation continues to reduce and is at its lowest point
since the recession began. The momentum for recovery appears to be picking up pace.
Q.1 Thinking about the economy as a whole, do you think that the country is better off, worse
off, or about the same as last year?
8
9. The Future: Psychologically, we may be ready to
move on in 2014
Source: B&A Consumer Confidence Report
Balance
+/10
Dublin
-4
Outside -23
0
-10
Looking Forward
-20
-30
-40
-50
-60
-70
-18
Looking Back
-20
-42
-44
-45
-41 -56
-58
-54
-65
-66 -67 -65
-69
-55
-74 -76
-69
-80
-73
-90
-77 -79
-93
-100
-50
-74
-70
-86
-81
-82
-50
-56 -57
-59
-69
-36
-64
-27
-44
-60
-64
-72
-91
-88
-52
-58
-39
-51 -53
-46
-62
-86
Jan Mar July Sept Oct Dec Mar May Sept Nov Mar July Nov Jan Apr July Nov Mar May Sept Nov Feb Apr July Sept
2008
Initial shock!
But widespread belief that:
2009
2010
Despair! (IMF
Bailout)
Things would return to ‘normal’
Spending habits and
behaviour changing
for good
Spending reined in – but not in any
planned or strategic manner
Value sought
everywhere
This was a ‘speedbump’
2011
Readjustment
People adjusting
to ‘new reality’
Less focus on
(or interest in)
doom and
gloom
2012
2013
Movement towards positivity
A significant uplift in the
consumer mood vs pre
budget last year.
However a Dublin vs
outside Dublin recovery is
evident.
Q.1
Thinking about the economy as a whole, do you think that the country is better off, worse off, or about the same as last year?
Q.2
And what about the coming year, do you think that the country will be better off, worse off or about the same as this year?
9
10. Economy – Looking Forward
Country will be …
LONG TERM
2011
2002 2003 2004 2005 2006 2007 2008 2009 2010 2011 2012
Better
off
13% 9%
8%
20%
25% 26%
6%
19%
12% 9%
9%
6%
Apr
8%
July
12%
18%
20%
25%
24%
32%
Jan
27%
Nov
8%
Mar
May Sept
30%
31%
2013
Nov
9% 11% 11% 6%
20%
25%
30%
2012
43%
April July
Sept
14% 12% 14%
20%
28%
33%
28%
32%
38%
Same
Feb
33%
36%
43%
47%
48% 48%
67%
59%
76%
74%
61%
67%
61%
49%
Worse
off
Gap
37%
27% 26%
-36 -50 -17 -2
72%
66%
57%
61%
55%
61%
66%
53% 55% 50%
37%
34%
= -15 -59 -68 -49 -58 -52
-70 -58 -45 -64
-52 -44 -50 -60
-39 -44 -36 -18
Perceptions related to the future of the Irish economy are at their highest
level since 2007. While still in the negative, belief in the future of the Irish
economy is improving.
Q.2 And what about the coming year, do you think that the country will be better off, worse off or about
the same as this year?
10
11. Balance Of Opinion - Economy
Long Term
Balance +/-
10
3
8
0
-13
-10
-30
Looking Back
-6
Looking Forward
-50 -40
-49
-50
-60
-59
-59
-68
-58
-58
-70
-71 -71
-90
-89
2002 2003 2004 2005 2006 2007 2008 2009 2010 2011 2012
YEARLY
AVERAGES
-44
-45
-52
-59
-64
-80
-100
-18
-15
-36
-40
-70
-2 0
-17
-20
Short Term
-52
-39
-50
-60
-64
-59
-72
-64
-69
-56 -57
-51
-62
-36
-44
-27
-46
-55
-86
Jan
Apr
July
2011
Nov
Mar
May
Sept
2012
Nov
Feb
Apr
July
Sept
2013
When viewed longitudinally a pattern of consistent improvement has been noted
over the past two years.
11
12. Economy – Looking Forward x
Demographics
Country will be …
Total
SEPTEMBER 2013
Gender
Age
Male
Better
off
Same
Worse
off
Gap
Female
1005
485
520
352
359
294
452
%
Base:
%
%
%
%
%
%
20
43
21
43
18
44
37
36
38
-18
-15
-20
18-34 35-54
Social Class
22
43
35
-14
55+
19
18
42
45
Dublin
Leinster
Munster
482
71
278
265
285
177
727
%
%
%
%
%
%
%
16
17
47
44
37
40
-21
-23
15
-20
38
-20
25
27
20
14
42
42
43
44
39
48
42
44
31
-5
Any
Conn/
Outside
Ulster
Dublin
F
ABC1 C2DE
25
Region
27
-29
-2
31
-4
37
-17
44
-29
A socio-economic and regional divide in terms of recovery.
Q.2 And what about the coming year, do you think that the country will be better off, worse off
or about the same as this year?
12
13. Economy – Looking Forward Trended x
Region
Base: All adults 18+
Balance
+/-
10
5
0
-5
-10
-15
-20
-25
-30
-35
-40
-45
-50
-55
-60
-65
-70
2012
2013
-4
The gap is
widening indicating
a two tier recovery.
-23
-38
-44
-42
Dublin
-32
-48
-30
-39
Outside Dublin
-60
-52
Sep 12
-61
Nov 12
Feb-13
Apr-13
Jul-13
Sep-13
Q.1 Thinking about the economy as a whole, do you think that the country is better off, worse
off, or about the same as last year?
13
14. Personal Finances – Looking Back
Now feel …
LONG TERM
2011
2002 2003 2004 2005 2006 2007 2008 2009 2010 2011 2012
Better off
15%
9%
11%
21%
2%
5%
5%
25% 26% 24%
3%
Apr
5%
July
Nov
Mar
5%
5%
31%
7%
29%
2013
May Sept
Nov
Feb
April July
5%
4%
6%
6%
7%
7%
26%
33% 30% 33%
36%
34%
32%
35%
36% 33%
9%
40%
45%
46%
45%
Sept
21%
32%
Same
4%
Jan
2012
47%
47%
51% 52% 56%
75%
65% 62% 66%
62%
Worse off 38%
69%
57%
64%
66%
61% 59% 64%
58% 61%
44%
44%
53%
47%
32%
24% 22%
20%
Gap
-23 -34 -11 +1
+4 +4 -35 -63 -58 -61 -57
-72 -64 -50 -59
-61 -56 -52 -60
-52 -55 -47 -38
Perceptions of personal finances are still negative. However, the degree of
negativity is reducing with the scores now at 2008 level.
Q.3 Do you feel better off financially, worse off financially or about the same compared to last year?
14
15. Personal Finances – Looking Back x
demographics
Now feel …
Total
SEPTEMBER 2013
Age
Male Female
Base:
Gender
18-34 35-54
Social Class
Region
55+
ABC1
C2DE
F
Dublin
Leinster
Any
Mun- Conn/
Outside
ster Ulster
Dublin
1005
485
520
352
359
294
452
482
71
278
265
285
177
727
%
%
%
%
%
%
%
%
%
%
%
%
%
%
Better
off
9
10
7
Same
45
44
46
Worse
off
47
46
47
Gap
-38
-36
-40
13
7
41
45
43
-30
52
-44
5
50
10
8
7
40
48
45
42
-40
-32
57
52
36
-44
-29
10
11
45
45
46
44
-36
-33
Q.3 Do you feel better off financially, worse off financially or about the same compared to last year?
7
6
8
43
47
45
50
47
47
-43
-41
-39
15
16. Personal Finances - Looking Back x Region
Base: All adults 18+
Balance
+/-
10
5
0
-5
-10
-15
-20
-25
-30
-35
-40
-45
-50
-55
-60
-65
-70
2012
2013
-42
-46
-50
Sep 12
-61
Nov 12
Dublin
Outside Dublin
-50
-55
-56
-36
-39
-49
-56
-57
Feb-13
Apr-13
Jul-13
Sep-13
Q.3 Do you feel better off financially, worse off financially or about the same compared to last year?
16
17. Personal Finances – Looking Forward
Expect it to be …
LONG TERM
2011
2002 2003 2004 2005 2006 2007 2008 2009 2010 2011 2012
5%
13%
Higher
22% 22% 25%
25%
7%
7%
7%
30% 28%
Jan
Apr
5%
July
8%
2012
Nov
9%
7%
Mar
8%
May Sept
7%
7%
2013
Nov
7%
Feb
7%
April July
6%
Sept
6%
10%
20%
30%
35%
29%
28%
31% 34%
39%
35% 37% 34% 34%
38%
34%
41%
46%
The
same
52%
54% 54%
58%
58%
58% 59%
74%
64%
Lower
Gap
57%
63% 59%
64%
63%
52%
58% 56% 59% 59%
55%
60%
53%
44%
34%
24% 27%
-2
-8
17% 13%
12% 13%
+8 +16 +18 +15 -21 -59 -50 -56 -51
-69 -55 -43 -57
-50 -49 -52 -52
-48 -54 -47 -34
Despite a budget looming, less negativity exists regarding personal finances for the
year ahead.
Q.5
Do you expect your income in the next year, after inflation and taxes,
to be higher, lower or the same as in the last twelve months?
17
18. Personal Finances – Looking Forward x
Demographics
Expect it to be …
Total
SEPTEMBER 2013
Gender
Age
Social Class
Region
Lein- Mun- Conn/ Outside
ster ster Ulster Dublin
Male
Female
18-34
35-54
55+
ABC1
C2DE
F
Dublin
1005
485
520
352
359
294
452
482
71
278
265
285
177
727
%
%
%
%
%
%
%
%
%
%
%
%
%
%
Higher
10
12
12
9
8
10
The
same
46
45
Lower
44
43
46
-34
-31
-37
Base:
Gap
8
46
9
5
40
14
49
49
48
50
37
-23
41
-41
46
-41
39
-27
41
59
50
49
33
-41
-26
-39
12
8
45
49
44
-32
11
10
49
47
43
40
43
-35
-29
-33
18-34s and the middle classes are more positive about their finances as they
move forward. The blue collar sector are still most concerned.
Q.5
Do you expect your income in the next year, after inflation and taxes,
to be higher, lower or the same as in the last twelve months?
18
19. Personal Finances - Looking Forward x
Region
Base: All adults 18+
Balance
+/-
10
5
0
-5
-10
-15
-20
-25
-30
-35
-40
-45
-50
-55
-60
-65
-70
2012
2013
-33
-43
-55
-45
-55
-54
Sep 12
Nov 12
Q.5
-54
Feb-13
-44
Dublin
-39
Outside Dublin
-48
-56
Apr-13
-53
Jul-13
Sep-13
Do you expect your income in the next year, after inflation and taxes,
to be higher, lower or the same as in the last twelve months?
19
20. Balance Of Opinion - Personal Finances
Long Term
Balance
+/-
16 18 15
15
5
-2
-8
-15
-35
-45
-55
-65
-75
Looking Back
8
-5
-25
Short Term
Looking Forward
1
-11
4
4
-21
-34
-23
-34
-43
-35
-50
-59
-56
-51
-57
-58
-61
-63
2002 2003 2004 2005 2006 2007 2008 2009 2010 2011 2012
YEARLY
AVERAGES
-55
-50
-69
-72
Jan
-59 -61
-64
Apr
-57
-50-49 -52
July
2011
Nov
Mar
-56
May
-52
-52
-47 -38
-47
-48
-54
-52
-55
-59
Sept
Nov
Feb
2012
Apr
July
Sept
2013
Gains being made over time. However we are still in negative territory.
20
21. Savings – Looking Forward
Expect
to save
…
More
LONG TERM
2002 2003 2004 2005 2006 2007 2008 2009 2010 2011 2012
13% 11%
17% 18% 18% 18%
10%
6%
32%
The
51%
same
7%
7%
6%
27%
37% 35% 39%
Apr
7%
63%
-23 -28 -8 -5
Mar
32%
7%
6%
36%
9%
36%
May Sept
9%
Nov
6%
40% 43%
5%
Feb
April July
7%
38%
42%
7%
Sept
5%
10%
38% 45%
59%
36% 39%
19%
Nov
2013
49%
66%
55% 57% 54%
44%
25% 23%
July
2012
43%
62%
Gap
7%
Jan
46%
50%
58% 59%
Less
2011
61%
57%
48%
57%
51% 51%
57%
51%
55%
50%
41%
23%
-1 -5 -34 -56 -48 -50 -48
-60 -54 -39 -50
-51 -42 -45 -52
-44 -48 -44 -31
A stabilisation or at least a recovery in the ability to save
(with the more positive economic sentiment) is evident.
Q.8 Do you expect to save more, less or the same amount in the year ahead compared with
the last twelve months?
21
22. Savings – Looking Forward
Expect to save …
SEPTEMBER 2013
Total
Gender
Male
Female
1005
%
485
%
520
%
More
10
11
10
The
same
49
50
48
41
39
42
-30
-29
-32
Age
Base:
Less
Gap
18-34 35-54
352
%
17
359
%
8
50
Social Class
55+
ABC1
C2DE
F
294
%
452
%
482
%
71
%
4
53
45
37
-20
14
8
46
44
-34
-40
15
34
-37
Mun- Conn/ Outside
ster Ulster Dublin
265
%
285
%
177
%
7
9
8
8
53
51
39
41
-30
-33
43
56
45
45
-21
278
%
3
52
42
Region
LeinDublin
ster
57
48
40
39
35
-37
-24
-28
-39
Q.8 Do you expect to save more, less or the same amount in the year ahead compared with the last twelve months?
727
%
22
23. Savings – Looking Forward x Region
Balance
+/-
10
5
0
-5
-10
-15
-20
-25
-30
-35
-40
-45
-50
-55
-60
-65
-70
2012
2013
-29
-24
-34
-46
-50
Sep 12
-35
Dublin
-33
-43
-48
-47
More positivity in
Dublin over the
last 3 waves.
-53
-54
Nov 12
Outside Dublin
Feb-13
Apr-13
Jul-13
Sep-13
Q.8 Do you expect to save more, less or the same amount in the year ahead compared with
the last twelve months?
23
24. Personal Assets– Looking Forward
Expect them to be …
LONG TERM
2011
2002 2003 2004 2005 2006 2007 2008 2009 2010 2011 2012
Higher
10%
19% 22%
28%
36% 38%
2% 4% 5%
7%
Jan
2%
Apr
July
2012
Nov
5% 7% 7%
Mar
May Sept
2013
Nov
Feb
7% 6%
9% 8%
April July
Sept
9% 8% 11% 12%
28%
42%
43%
47% 46%
45%
54%
55%
45%
54%
51% 56% 55% 55%
62%
56%
59%
66%
No
68% 65%
change
64%
65%
59% 57%
55%
35%
Lower
Gap
13% 13%
52%
47% 47%
38%
49%
48%
38%
40%
36% 38% 39%
30%
37%
31%
22%
7% 5% 5% 8%
+6 +9 +21 +31 +33 +20 -25 -53 -43 -41 -31
-50 -44 -31 -41
-39 -28 -31 -33
-21 -29 -20 -10
The fieldwork was conducted prior to recent publicity surrounding increased housing prices in
Dublin. The figures at this point in time indicate belief in some asset value recovery.
Q.6
Do you expect your assets (your house, shares, pension entitlements, savings)
In the next year to be higher, lower or the same as in the past year?
24
25. Personal Assets– Looking Forward
Expect them
to be …
SEPTEMBER 2013
Total
Gender
Male
Female
Age
18-34 35-54
Social Class
55+
ABC1 C2DE
Region
F
Dublin
Leinster
Munster
Conn/ Outside
Ulster Dublin
Base:
1005
485
520
352
359
294
452
482
71
278
265
285
177
727
Higher
%
%
%
%
%
%
%
%
%
%
%
%
%
%
12
14
10
11
9
72
68
No
change
Lower
Gap
66
66
22
20
-11
-6
Q.6
9
66
25
-16
10
14
11
70
62
66
25
22
19
-11
-11
-4
20
-10
15
9
66
65
25
-17
13
16
68
59
19
-6
25
-9
22
17
-7
-11
Do you expect your assets (your house, shares, pension entitlements, savings)
In the next year to be higher, lower or the same as in the past year?
64
27
-18
10
68
21
-11
25
26. Personal Assets– Looking Forward x Region
Expect them
to be …
Balance
+/-
10
5
0
-5
-10
-15
-20
-25
-30
-35
-40
-45
-50
-55
-60
-65
-70
2012
2013
-9
-12
-18
-25
-21
-29
-23
-22
-34
Sep 12
Q.6
Dublin
Outside Dublin
-32
-33
Nov 12
-11
Feb-13
Apr-13
Jul-13
Sep-13
Do you expect your assets (your house, shares, pension entitlements, savings)
In the next year to be higher, lower or the same as in the past year?
26
27. Purchasing Goods And Services – Looking
Forward
Expect to
purchase
2002
…
More
LONG TERM
2011
2003 2004 2005 2006 2007 2008 2009 2010 2011 2012
16% 15% 18%
20% 21% 20%
10%
3%
5%
4%
5%
Jan
2%
Apr
5%
42%
39%
34%
Mar
5%
44%
50%
May Sept
5%
5%
Nov
5%
Feb
6%
April July
7%
Sept
6%
8%
50%
46%
42%
46% 44%
49%
55%
58% 58%
64%
64% 65% 65%
69%
66%
52%
56%
60%
50%
39%
Gap
4%
41%
45%
50%
Less
7%
Nov
2013
29%
31%
The
same
July
2012
55%
44%
51%
45%
49%
53%
49% 49%
45%
37%
26% 27%
18% 16%
14% 15%
-10 -12 = +4 +7 +5 -29 -63 -47 -52 -45
-67 -55 -37 -51
-46 -40 -44 -48
-43 -43 -40 -29
A breakthrough in perceptions of purchasing next year (2008 levels). Note we
are still in negative territory, but a significant drop in negativity has occurred.
Q.7 In the year ahead, do you expect to purchase more, less or the same amount of goods and services
as in the past year?
27
28. Balance Of Opinion – The Year Ahead
Expectations in regard to assets value, purchases, and savings
Long Term
Balance
+/40
31
30
10
0
-10
6
9
-10 -12
-30
-40
-50
-60
-23
-28
Purchase
20
4
7
Savings
5
-8
-12
-20
Assets Value
33
21
20
Short Term
-5
-1
-10
-5
-20
-21
-25
-29
-34
-31
-43
-53
-41
-44
-45
-50
-48 -50 -48
-47
-60
-52
-63 -56
-70
2002 2003 2004 2005 2006 2007 2008 2009 2010 2011 2012
YEARLY
AVERAGES
-28
-31
-54
-41 -39
-37
-39 -50
-40
-46
-42
-55 -51
-51
Jul
Mar
-29
-31 -33
-44 -48
-45
-52
-43
-43
-29
-40
-31
-44 -48 -44
-67
Jan
Apr
2011
Nov
May Sept Nov
2012
Feb
Apr
July Sept
2013
Improvements are noted and momentum is slowly improving. However, any further
imposition that directly affects real incomes of consumers will impact this area negatively
(ie the Budget!). Growth in personal financial situations is now finely balanced.
28
29. Purchasing Goods And Services – Looking
Forward
Expect to purchase …
Total
SEPTEMBER 2013
Gender
Male
Base:
1005
%
Female
485
%
520
%
8
7
9
55
58
35
39
-29
-27
-30
18-34 35-54
352
%
359
%
Social Class
55+
294
%
14
6
2
53
53
37
More
Age
33
-19
12
40
37
-34
-35
F
482
%
71
%
5
5
278
%
13
66
42
31
-18
30
-37
-25
53
Munster
265
%
285
%
7
6
52
57
Less
Gap
452
%
61
53
The
same
ABC1 C2DE
Region
LeinDublin
ster
59
34
34
-21
-27
52
42
-36
Q.7 In the year ahead, do you expect to purchase more, less or the same amount of goods and services as in the past year?
Conn/ Outside
Ulster Dublin
177
%
727
%
5
6
59
56
36
38
-32
-32
29
30. Purchasing Goods And Services – Looking
Forward x Region
Expect to purchase …
Balance
+/-
10
5
0
-5
-10
-15
-20
-25
-30
-35
-40
-45
-50
-55
-60
-65
-70
2012
2013
-21
-31
-41
-46
-45
-50
Sep 12
Nov 12
-34
-32
-42
Dublin
Outside Dublin
-42
-48
Feb-13
Dublin has more
positive
indications of
recovery
compared to
outside Dublin.
-47
Apr-13
Jul-13
Sep-13
Q.7 In the year ahead, do you expect to purchase more, less or the same amount of goods and services as in the past year?
30
31. The New Reality of Recession: Discretionary
Income Has Halved in Five Years but
decline appears to have abated
Base: All adults 18+
€90
2013
83.97
77.30
€80
71.38
€70
75.07
66.70
61.29
€60
62.32
54.62 55.17
50.94
50.05
47.23
46.68
47.08
42.91
€50
50.30
€40
€30
Q. About how much would you say you spend each week
on things you buy for yourself including money spent
on clothes, eating out, going for a drink, going to the
cinema, gambling, sporting activities and so on?
€20
€10
€0
'01
'02
'03
'04
'05
'06
'07
'08
'09
'10
Apr
'11
Jul
'12
Feb
'13
Apr
'13
Jul
'13
Sept
'13
31