Download as PDF, PPTX

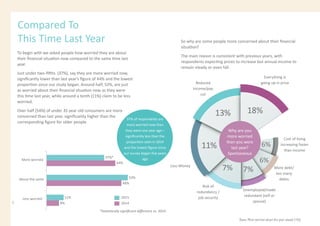
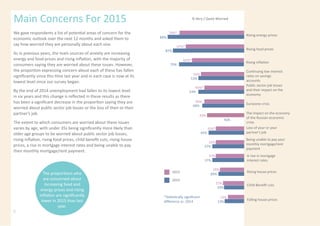

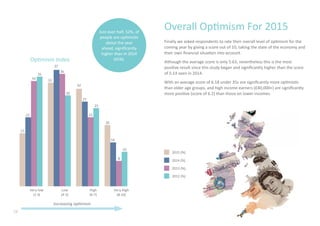


The 'Money Matters' survey for January 2015 reveals an increasing optimism among UK consumers regarding their financial situation, with a notable rise in the average optimism score compared to 2014. Despite some concerns about rising prices and job security, the percentage of respondents worried about their finances has decreased, especially among the under 35 demographic. In terms of expectations for 2015, many anticipate wage stagnation despite a belief in increased household spending, particularly among younger consumers who appear more willing to incur debt.