The document provides an earnings conference call summary and outlook for Curtiss-Wright Corporation for 1Q 2016 and full year 2016. Some key points:
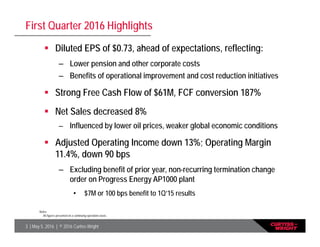
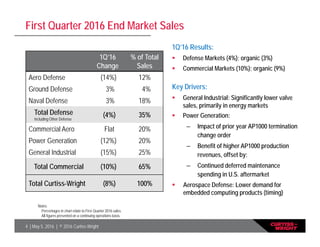
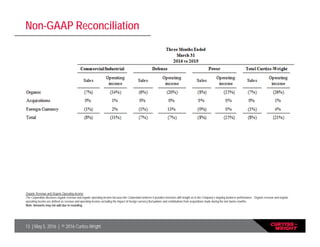
- 1Q 2016 EPS of $0.73, ahead of expectations, with lower costs and strong free cash flow of $61M. However, sales decreased 8% due to weaker industrial markets.
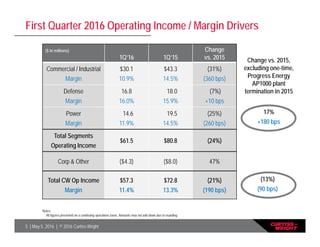
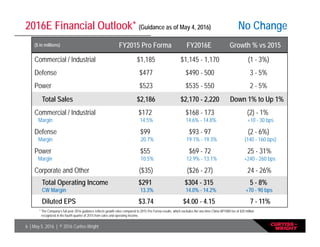
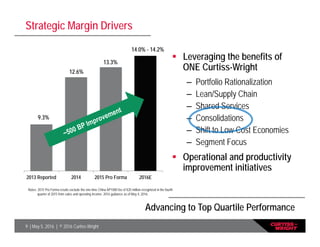
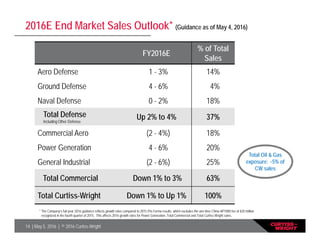
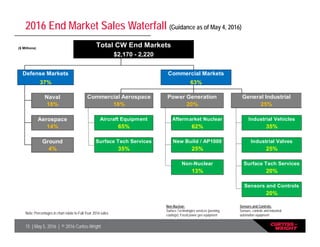
- Full year 2016 guidance expects sales growth of -1% to 1% with operating margin expansion to 14.0-14.2% through cost savings and improving defense and power markets.
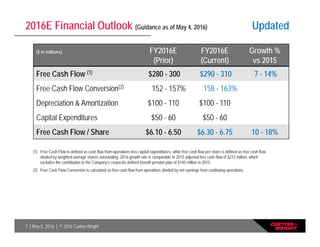
- The outlook expects solid earnings growth of 7-11% and continued strong free cash flow of $290-310M through ongoing initiatives and AP1000 reactor component sales.