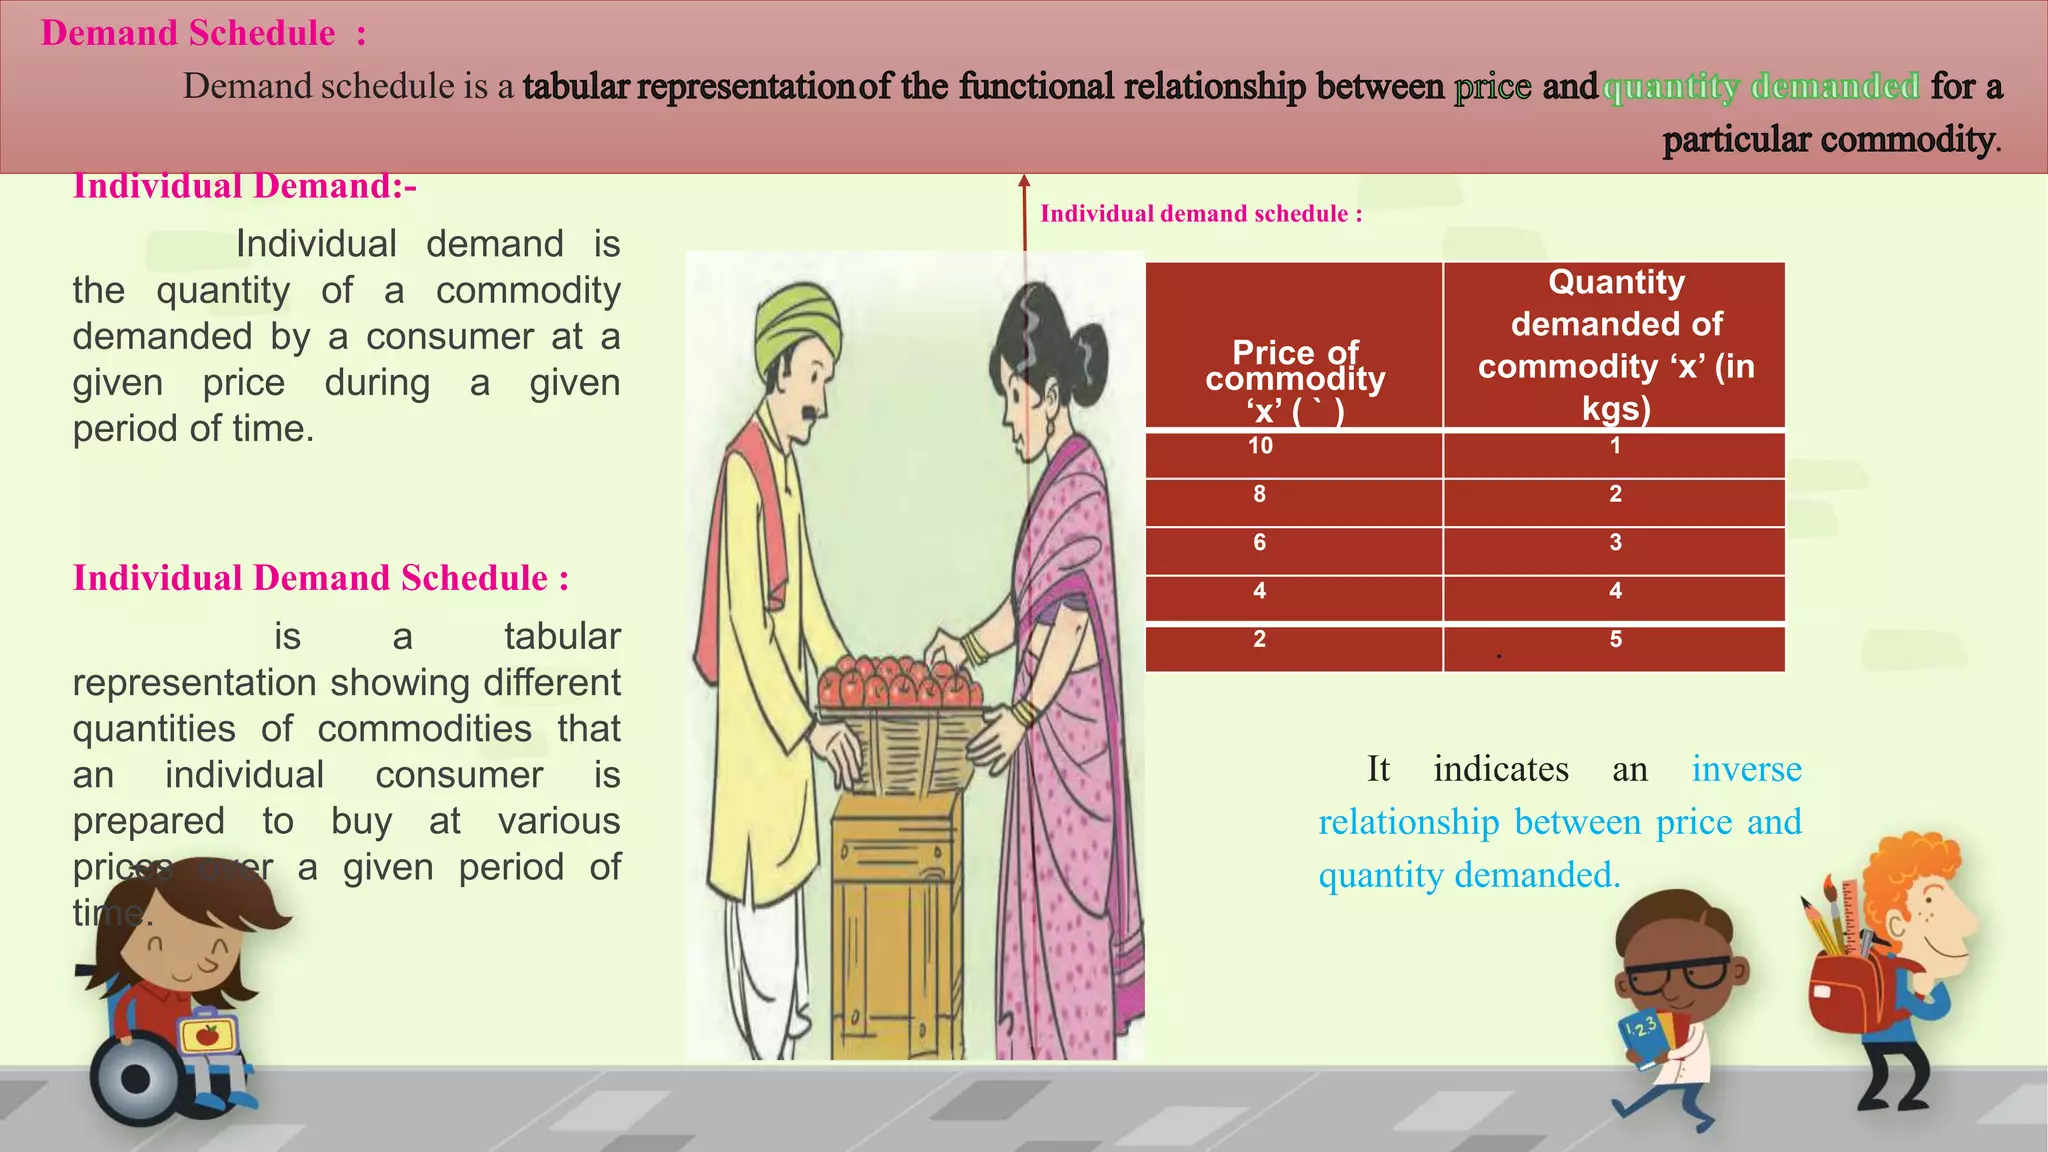
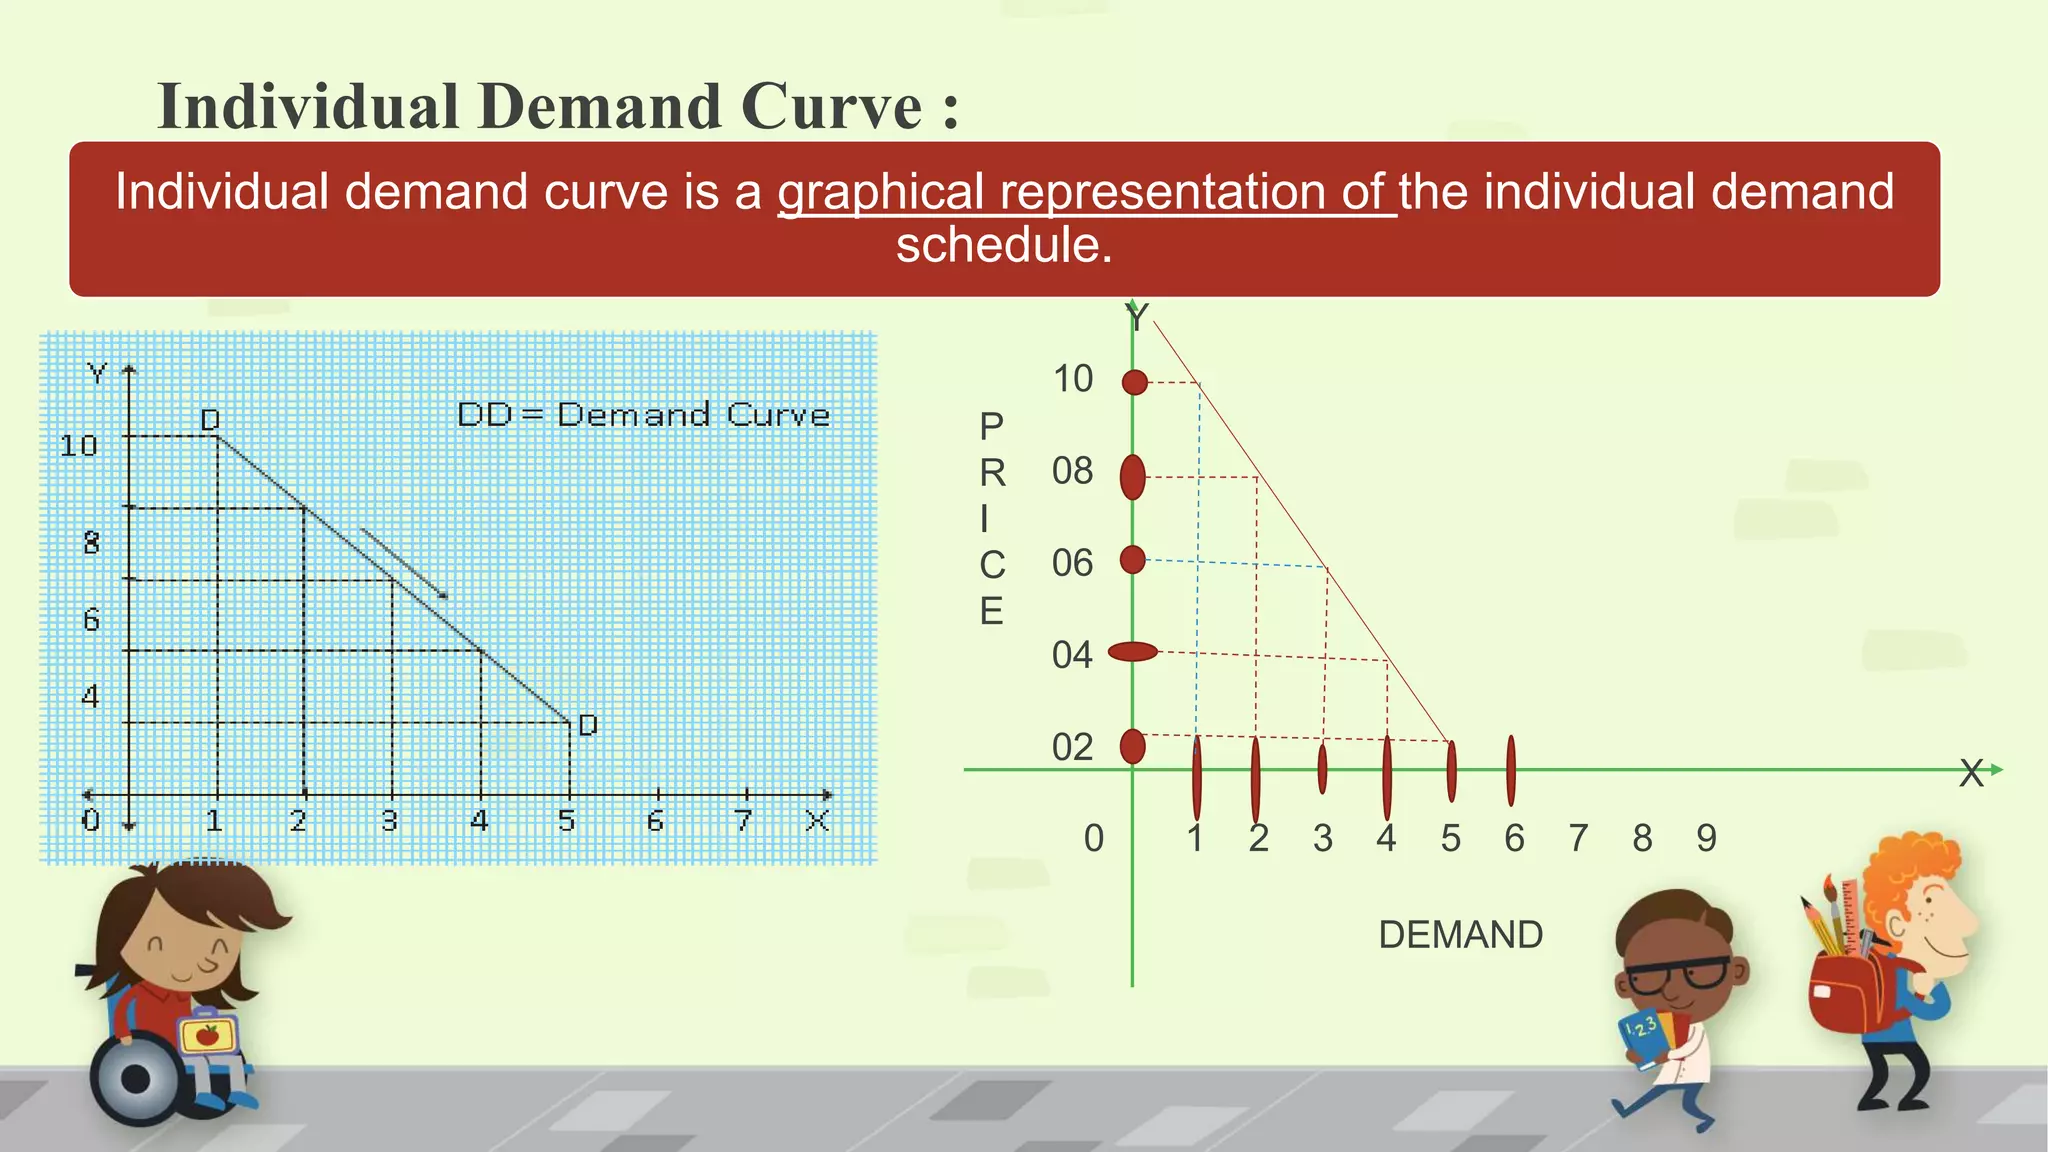
1) Demand refers to an effective desire backed by both willingness and ability to pay for a good. It is represented through demand schedules and curves which show an inverse relationship between price and quantity demanded.
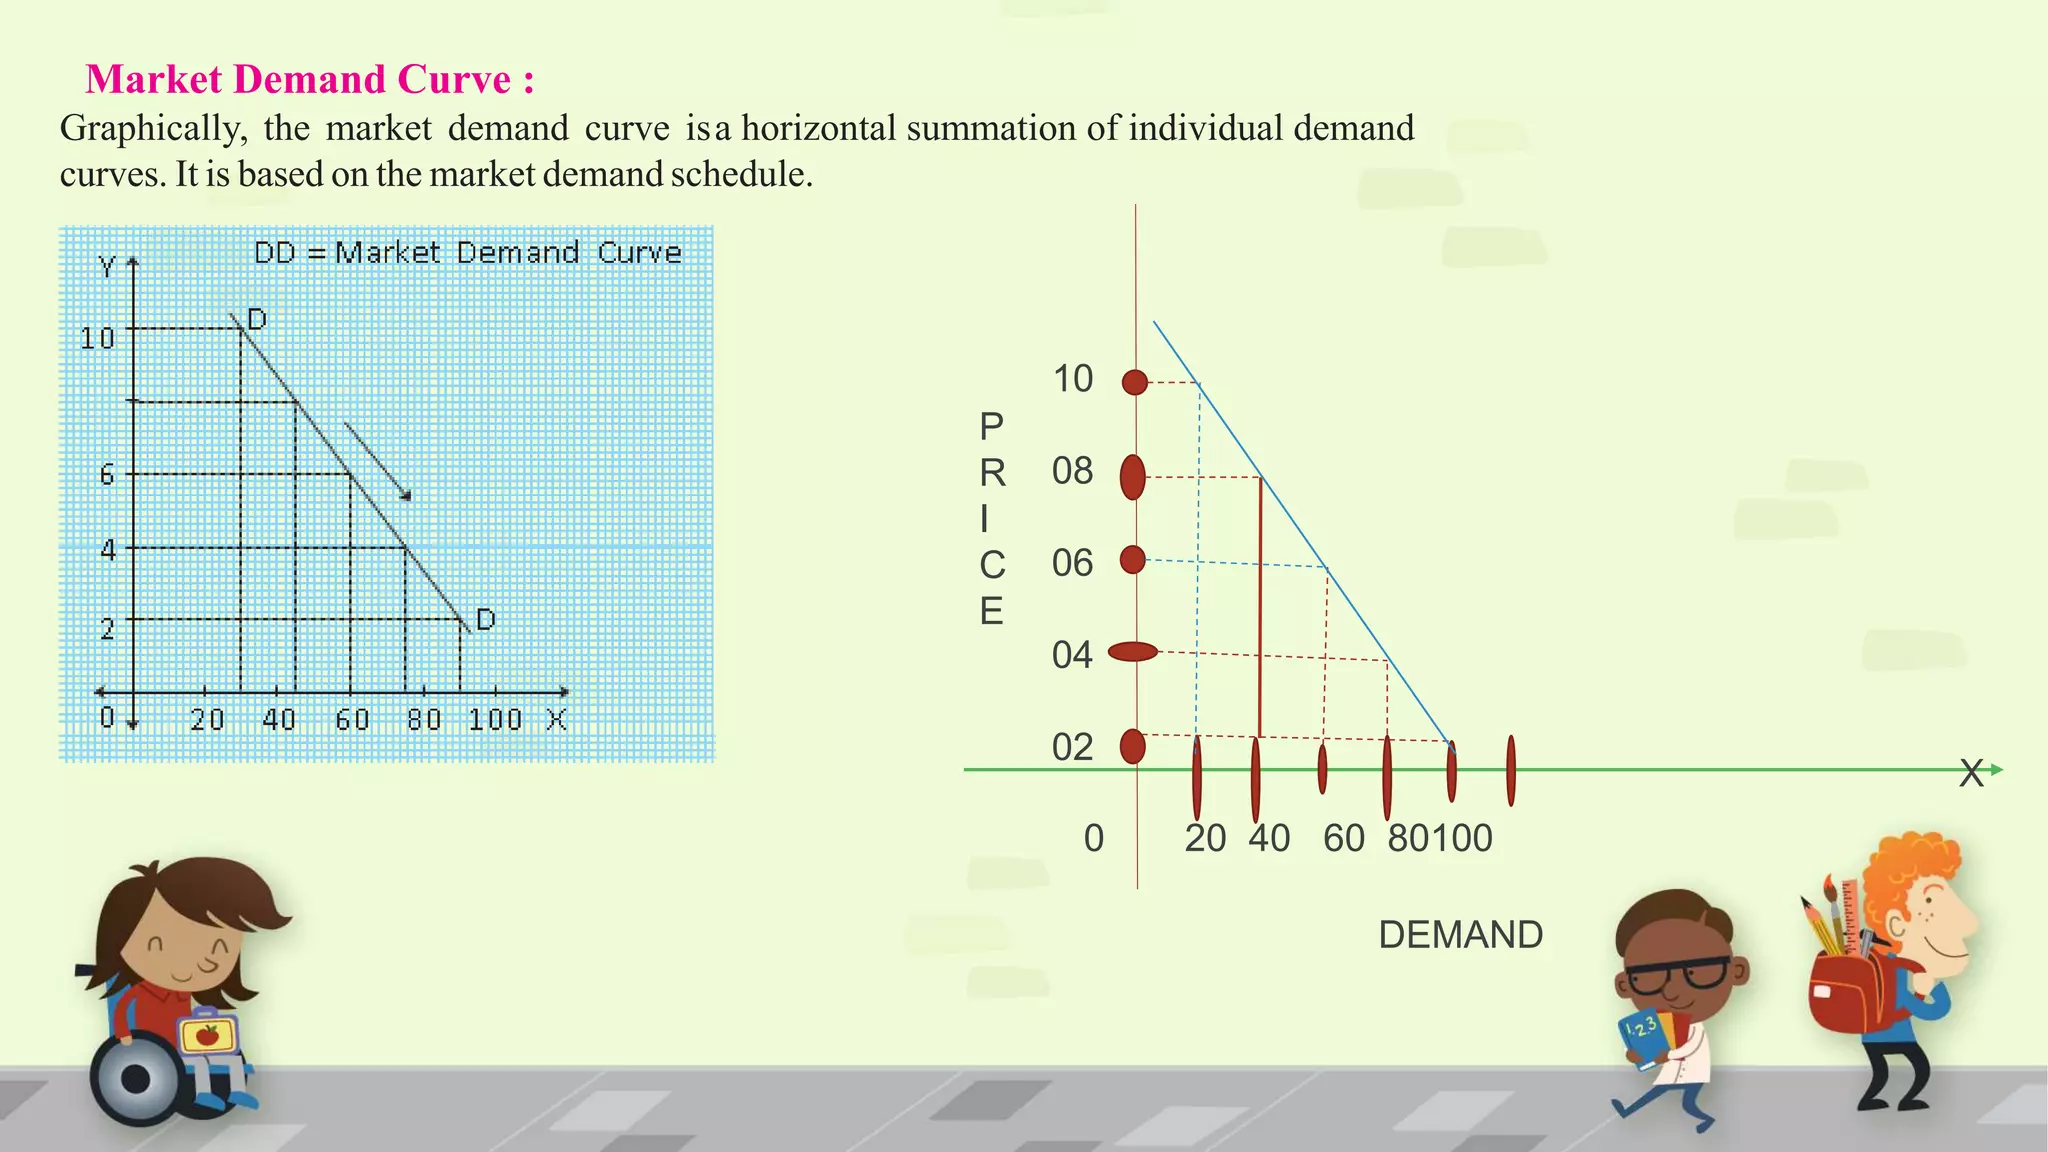
2) Individual demand is for a single consumer, while market demand is the total demand from all consumers. Market demand curves are created through horizontal summation of individual curves.
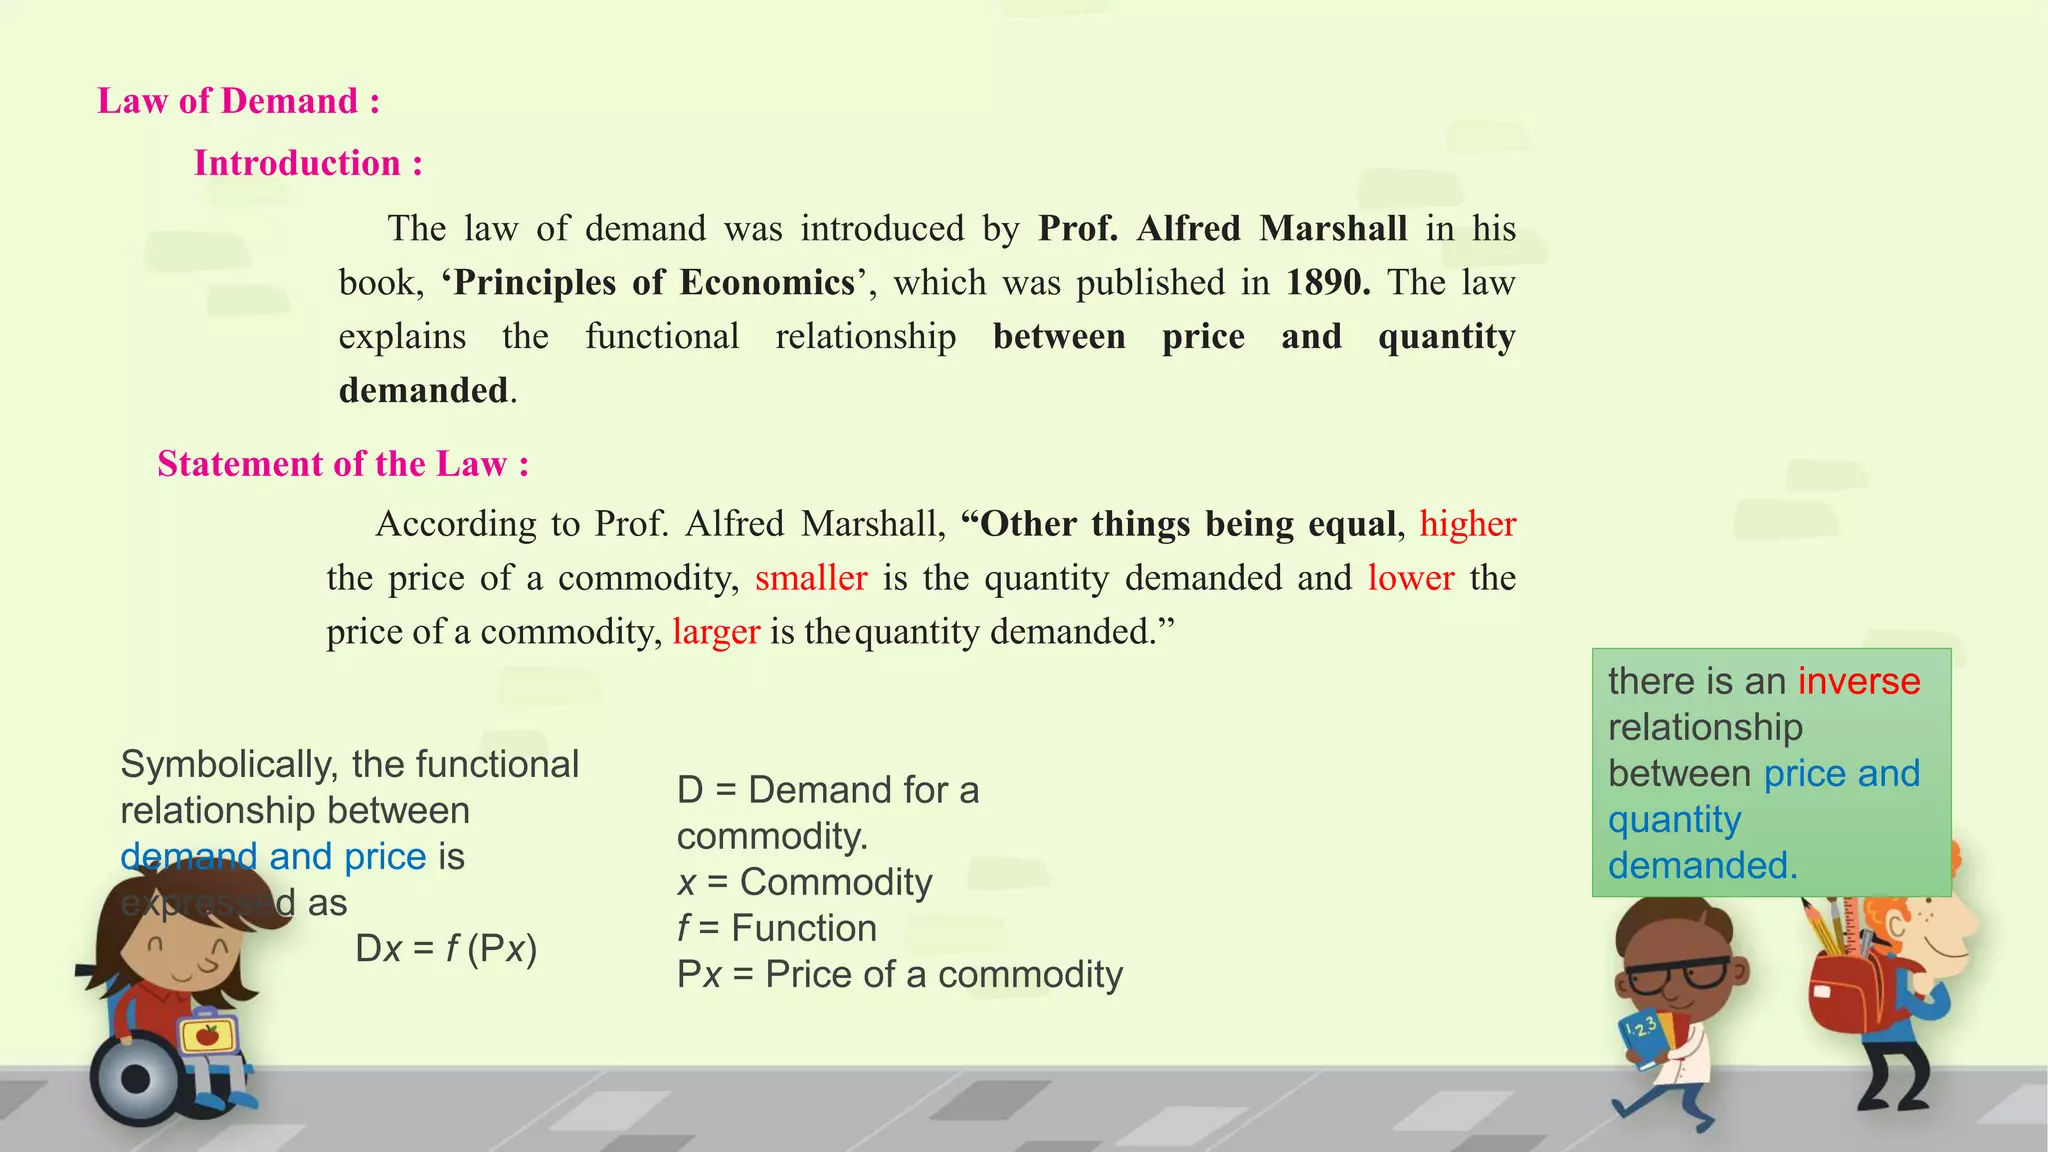
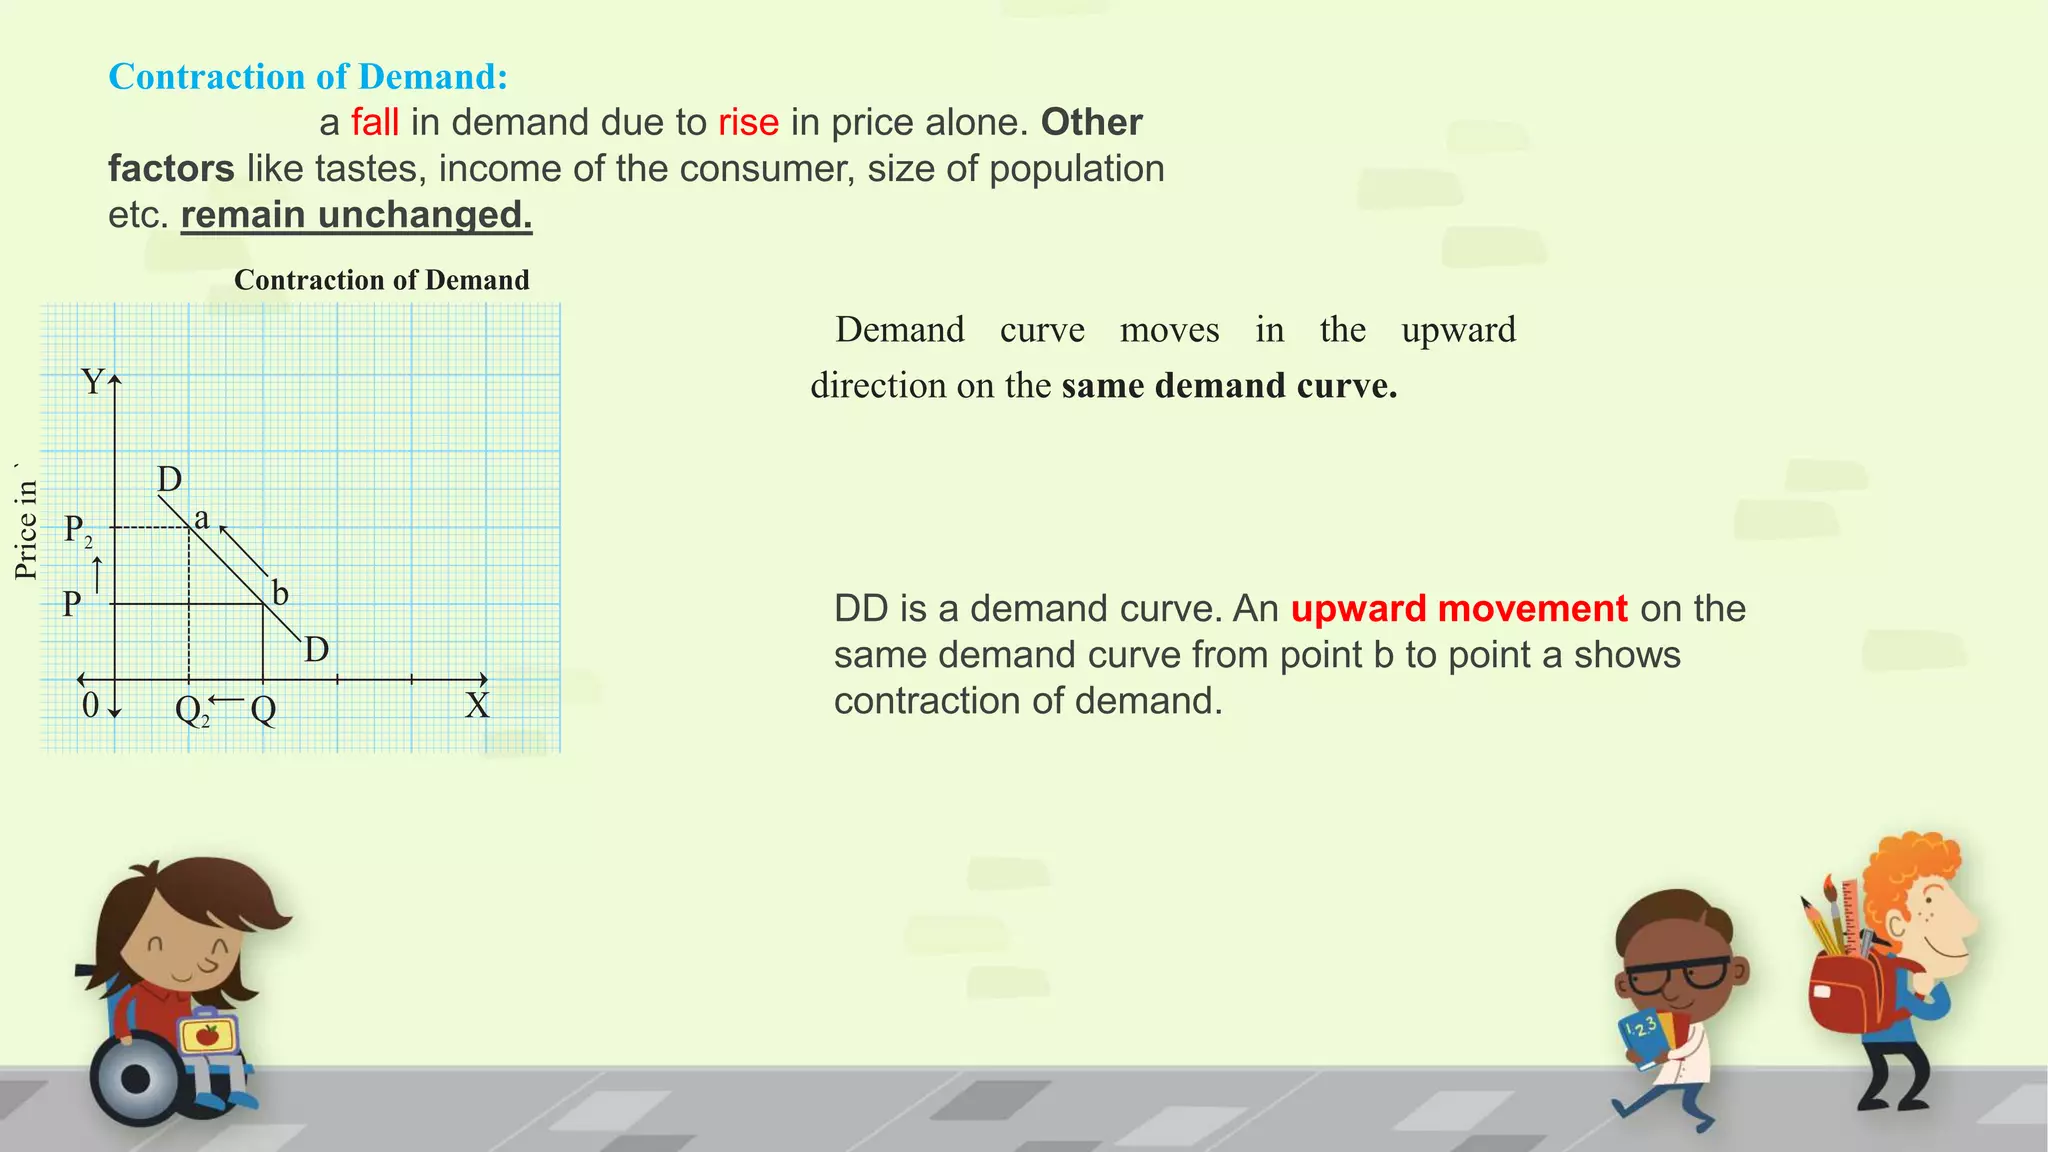
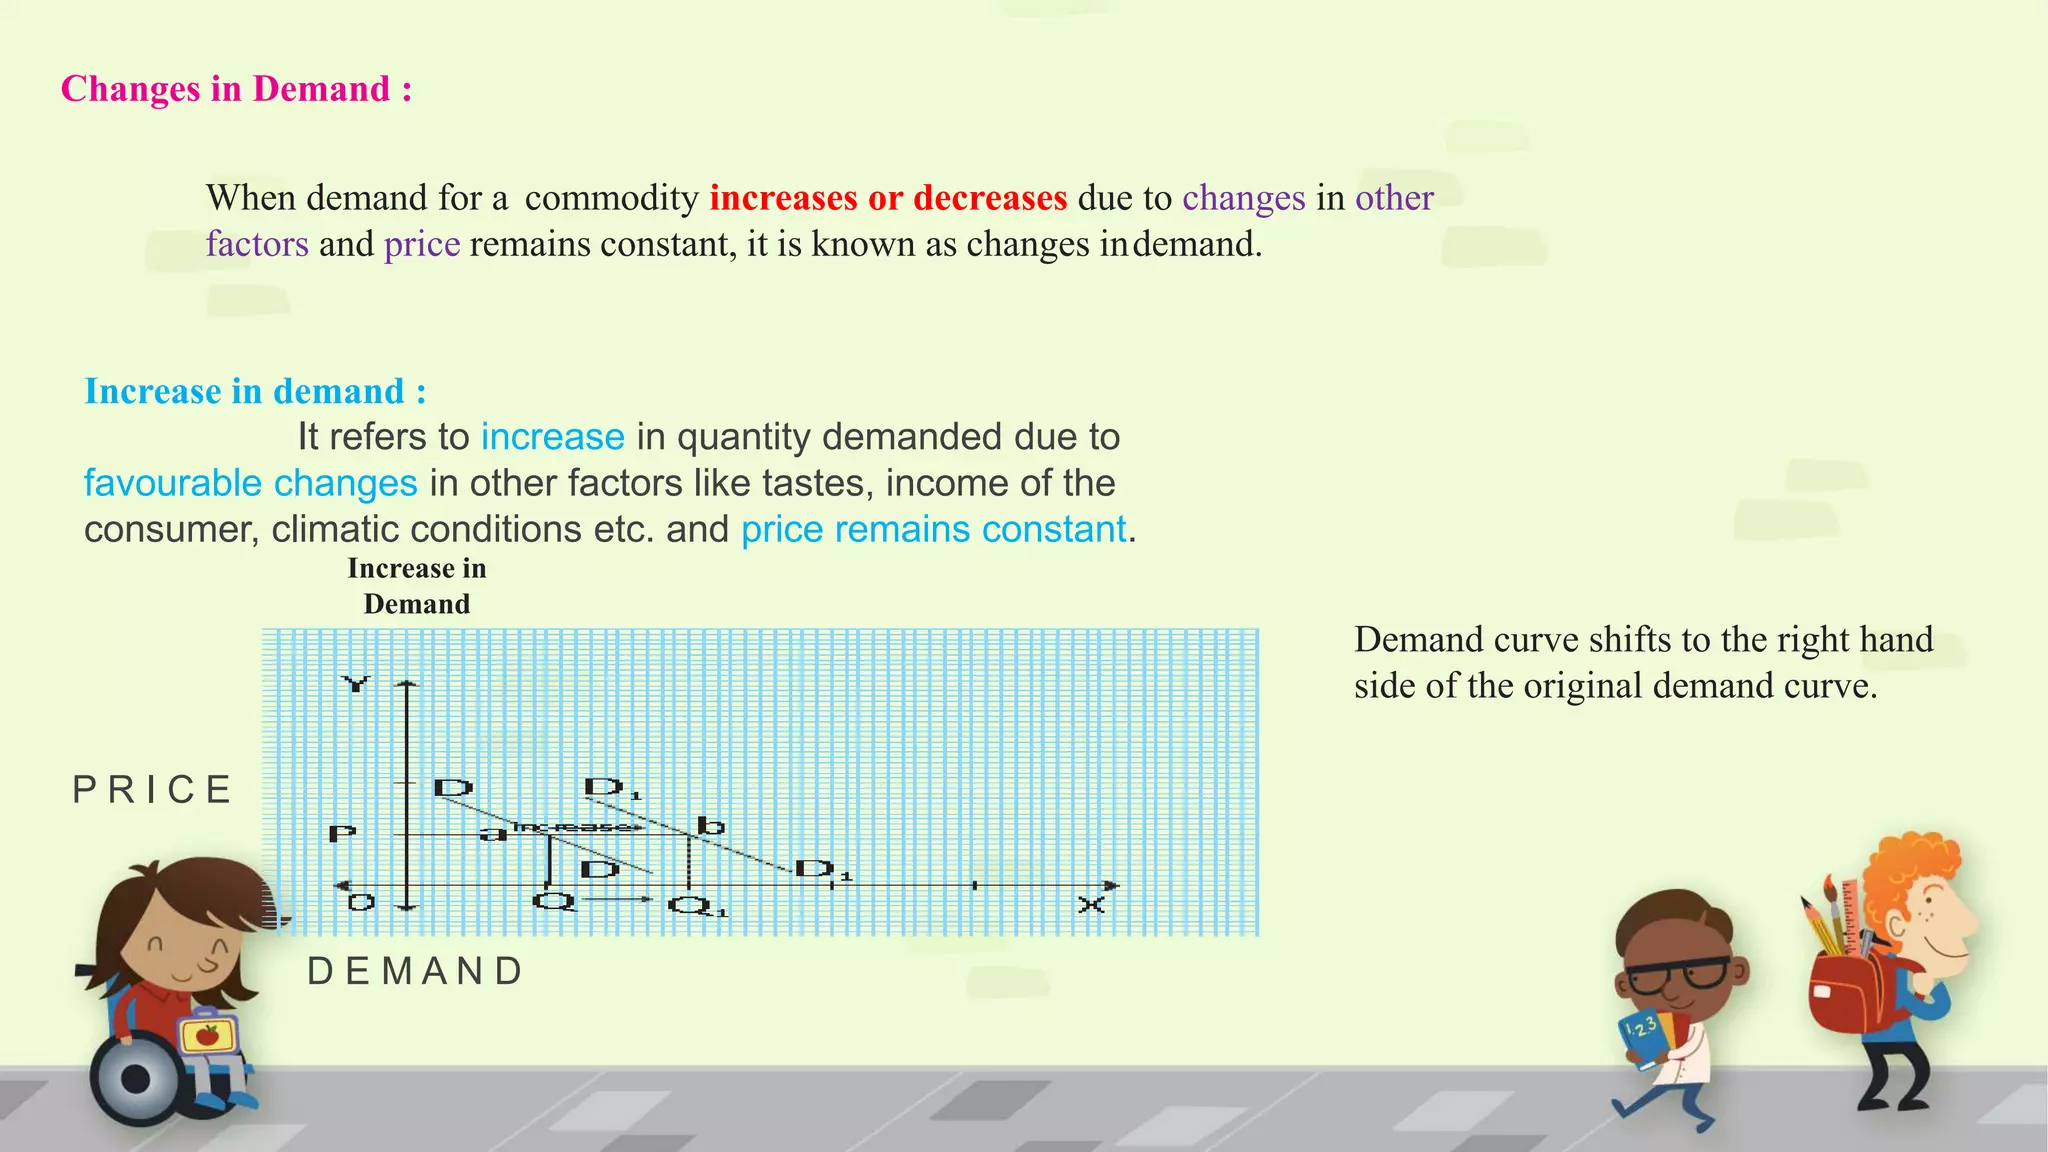
3) According to the law of demand, assuming other factors are constant, quantity demanded varies inversely with price - as price increases, quantity demanded decreases, and vice versa. There are some exceptions to this law.