Download to read offline
![International Refereed Journal of Engineering and Science (IRJES)
ISSN (Online) XXXX-XXXX, (Print) XXXX-XXXX
Volume X, Issue X (XXXXX 2014), PP.
There are various modulation methods but they all have two objectives. The first objective is to
calculate the on time for switches and the desired fundamental output voltage is obtained. The second objective
is to arrange the switching process in order to minimize the harmonic distortion, switching losses and/or other
specified criterion. The pulse pattern is generated by the pulse width modulation (PWM) where the reference
signal is compared with the triangular carrier waveform signal. This fast control makes it possible to create any
phase angle or amplitude which can be done almost instantaneously providing independent control of both
active and reactive power.
The converters are using a set of six valves, two each phase equipped with high power transistors,
IGBT (Insulated Gate Bipolar Transistor). The IGBTs switch can be switched on or off at will, therefore the
output voltages and currents on the AC side can be controlled precisely. IGBTs are connected in series in order
to be able to handle higher voltage than the rated voltage of one IGBT. All IGBTs must turn on and off at the
same moment to achieve an evenly distributed voltage across the valve.
2.3 HVDC Light Cable
The cable used in HVDC Light applications are a new developed type, where the insulation is made of
an extruded polymer material that is particularly resistant to DC voltage [1], [2] and they are very strong and
robust. HVDC Light cables are buried underground or underwater so there is no visual impact from the power
cables and contain no oil. They do not emit fluctuating electric and magnetic fields (EMFs) so there are no
human health related issues. The cables are operated in bipolar mode, one cable with positive polarity and
another with negative polarity. The cables are installed close in bipolar pairs with anti-parallel currents and thus
eliminating the magnetic fields [2] as illustrated in figure 3. These cables are constructed both for submarine
(copper) and land (aluminium) applications.
Fig. 3. Diagram of a bipolar DC cable system
2.4 Operating Principle of Voltage Source Converter
The converter can be brought as an equivalent of AC voltage source where amplitude, phase and
frequency can be controlled independently. Thus the VSC Bridge can be regarded as fast controllable
synchronous machine whose instantaneous phase voltage û is described by;
harmonicstmSinUu edc ++= )(
2
1
ˆ δω (1)
Where m is the modulation index which is defined as the ratio of peak value of the modulation signal and the
peak value of the carrier signal, ωe is the fundamental frequency and δ is the phase shift of the output voltage.
Variables m and δ can be adjusted independently to obtain any combination of voltage amplitude and phase shift
in relation to the fundamental frequency voltage of the AC system. The voltage drop Δv across the phase reactor
X can be varied to control active and reactive power flows. The active power flow between the converter and the
AC system can be controlled by controlling the phase angle between the fundamental frequency voltage
generated by the converter and the voltage across the AC-filter.
Taking the voltage at filter bus as a reference and assuming lossless reactor, the power transfer from
the converter to the AC system will be
)(
||||
δSin
X
Uv
P = (2)
The reactive power flow is determined by the relative difference in magnitude between the converter
and filter voltages. The reactive power flow is calculated as
)(
|)||(|||
δSin
X
Uvv
Q
−
= (3)
www.irjes.org 3 | Page](https://image.slidesharecdn.com/310029-150408003856-conversion-gate01/85/On-the-Viability-Analysis-of-HVDC-Light-for-Electrification-of-Mafia-Island-by-National-Grid-3-320.jpg)
![International Refereed Journal of Engineering and Science (IRJES)
ISSN (Online) XXXX-XXXX, (Print) XXXX-XXXX
Volume X, Issue X (XXXXX 2014), PP.
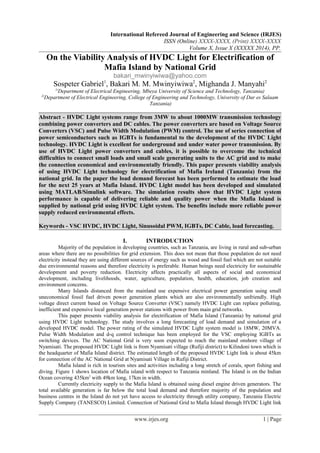
Figure 4 shows the details of the HVDC Light system in a simplified way which indicates the arrangement
of all the basic system components from AC side to DC and then to AC system again. Figure 5 elaborates some
more details of the converter station as one of the major component in HVDC Light which is formed by the
IGBT valves using StakPak module with a number of chips depending on the level of power.
III. ELECTRIC LOAD FORECASTING
Forecasting means predicting what is going to happen in the future, next day, month, year, decade, etc.
In general, the load forecasting is performed by studying the past events so as to be able to predict what the
future electricity demand will be. Accurate forecasting requires high quality data, application of the appropriate
forecasting technique and knowledge of data interpretation. According to [5], [6] the load forecasting is
distinguished on the basis of forecasting periods as short term, medium term and long-term load forecasting.
Short Term Load Forecasting (STLF): Short term load forecasting (STLF) starts from few hours to weeks
used for scheduling generating capacity and day to day operation and is commonly referred as to hourly load
forecast.
Medium Term Load Forecasting (MTLF): Medium term load forecasting (MTLF) starts from few months to
few years ahead and is used for the purpose of scheduling maintenance and fuel supply.
Long Term Load Forecasting (LTLF): Long term load forecasting (LTLF) starts from five (5) to twenty five
(25) years is used for system capacity planning and is usually called annual load demand and energy forecast.
III.1 Load Forecasting Variables
Load forecasting variables represent the numerous factors that influence growth of electric load
demand. In this case the load variables are electrical energy distributed by the supply authority, TANESCO
Limited (Mafia Branch), to consumers in kWh, new customer connections trends which indicate the number of
new customers connected to the power systems on monthly basis and the maximum apparent power demand in
kVA for five years i.e. 2008-2012.
III.2 Load forecasting methods
Load forecasting methods are mainly classified into two categories, Statistical or Classical methods and
Artificial Neural Network (ANN) based methods or Artificial Intelligence methods. In statistical methods a
mathematical equation can be obtained showing the relationship between load and its relative factors after
training the historical data, while ANN methods try to imitate human beings way of thinking and reasoning to
get knowledge from the past experience and forecast the future load. In this research, statistical methods for load
forecasting using historical load data collected is applied. The load forecasting using statistical method is mainly
divided into three categories which are trend analysis, end use analysis and econometric analysis. In this paper
the trend analysis model is applied using previous collected load data to forecast the future electricity demand
for the next twenty five (25) years. The trend analysis focuses on past changes or movements in electricity
demand and uses them to predict future changes in electricity demand.
www.irjes.org 4 | Page
Fig. 4. Simplified circuit diagram for 2-level VSC-
HVDC showing the major components of the system [3] Fig. 5. HVDC Light IGBT arrangements [4].](https://image.slidesharecdn.com/310029-150408003856-conversion-gate01/85/On-the-Viability-Analysis-of-HVDC-Light-for-Electrification-of-Mafia-Island-by-National-Grid-4-320.jpg)
![International Refereed Journal of Engineering and Science (IRJES)
ISSN (Online) XXXX-XXXX, (Print) XXXX-XXXX
Volume X, Issue X (XXXXX 2014), PP.
IV. ANALYSIS AND DISCUSSION OF TRENDS RESULTS
4.1 Customer Connection Trends for Mafia Island
The customer connection trends as shown in table 1 in appendices for five years from 2008 to 2012 as
outsourced from TANESCO Mafia Island indicates the increase in number of costumers in different rates. In the
year 2008 the new consumers connected by TANESCO was 20 costumers where 29 customers were connected
in the year 2009, this was the growth increase of 45%. In the year 2010, the growth increase was 97% from that
of 2009, while in the year 2011, growth increase was 19% from that of 2010. In the year 2012, growth increase
was 103% from that of 2011. Generally this indicates that there has been an increase rate of new customer
connection at the average of 66% in the years under this study.
This trend gives a good indicator to show that there is a high demand of electrical power at Mafia
Island and this is regardless of insufficient and poor power distribution network system. It is the assumption of
this research paper that if there were a reliable power source and good power distribution network at Mafia
Island, then the number of new customer connection would have been more than these indicates here.
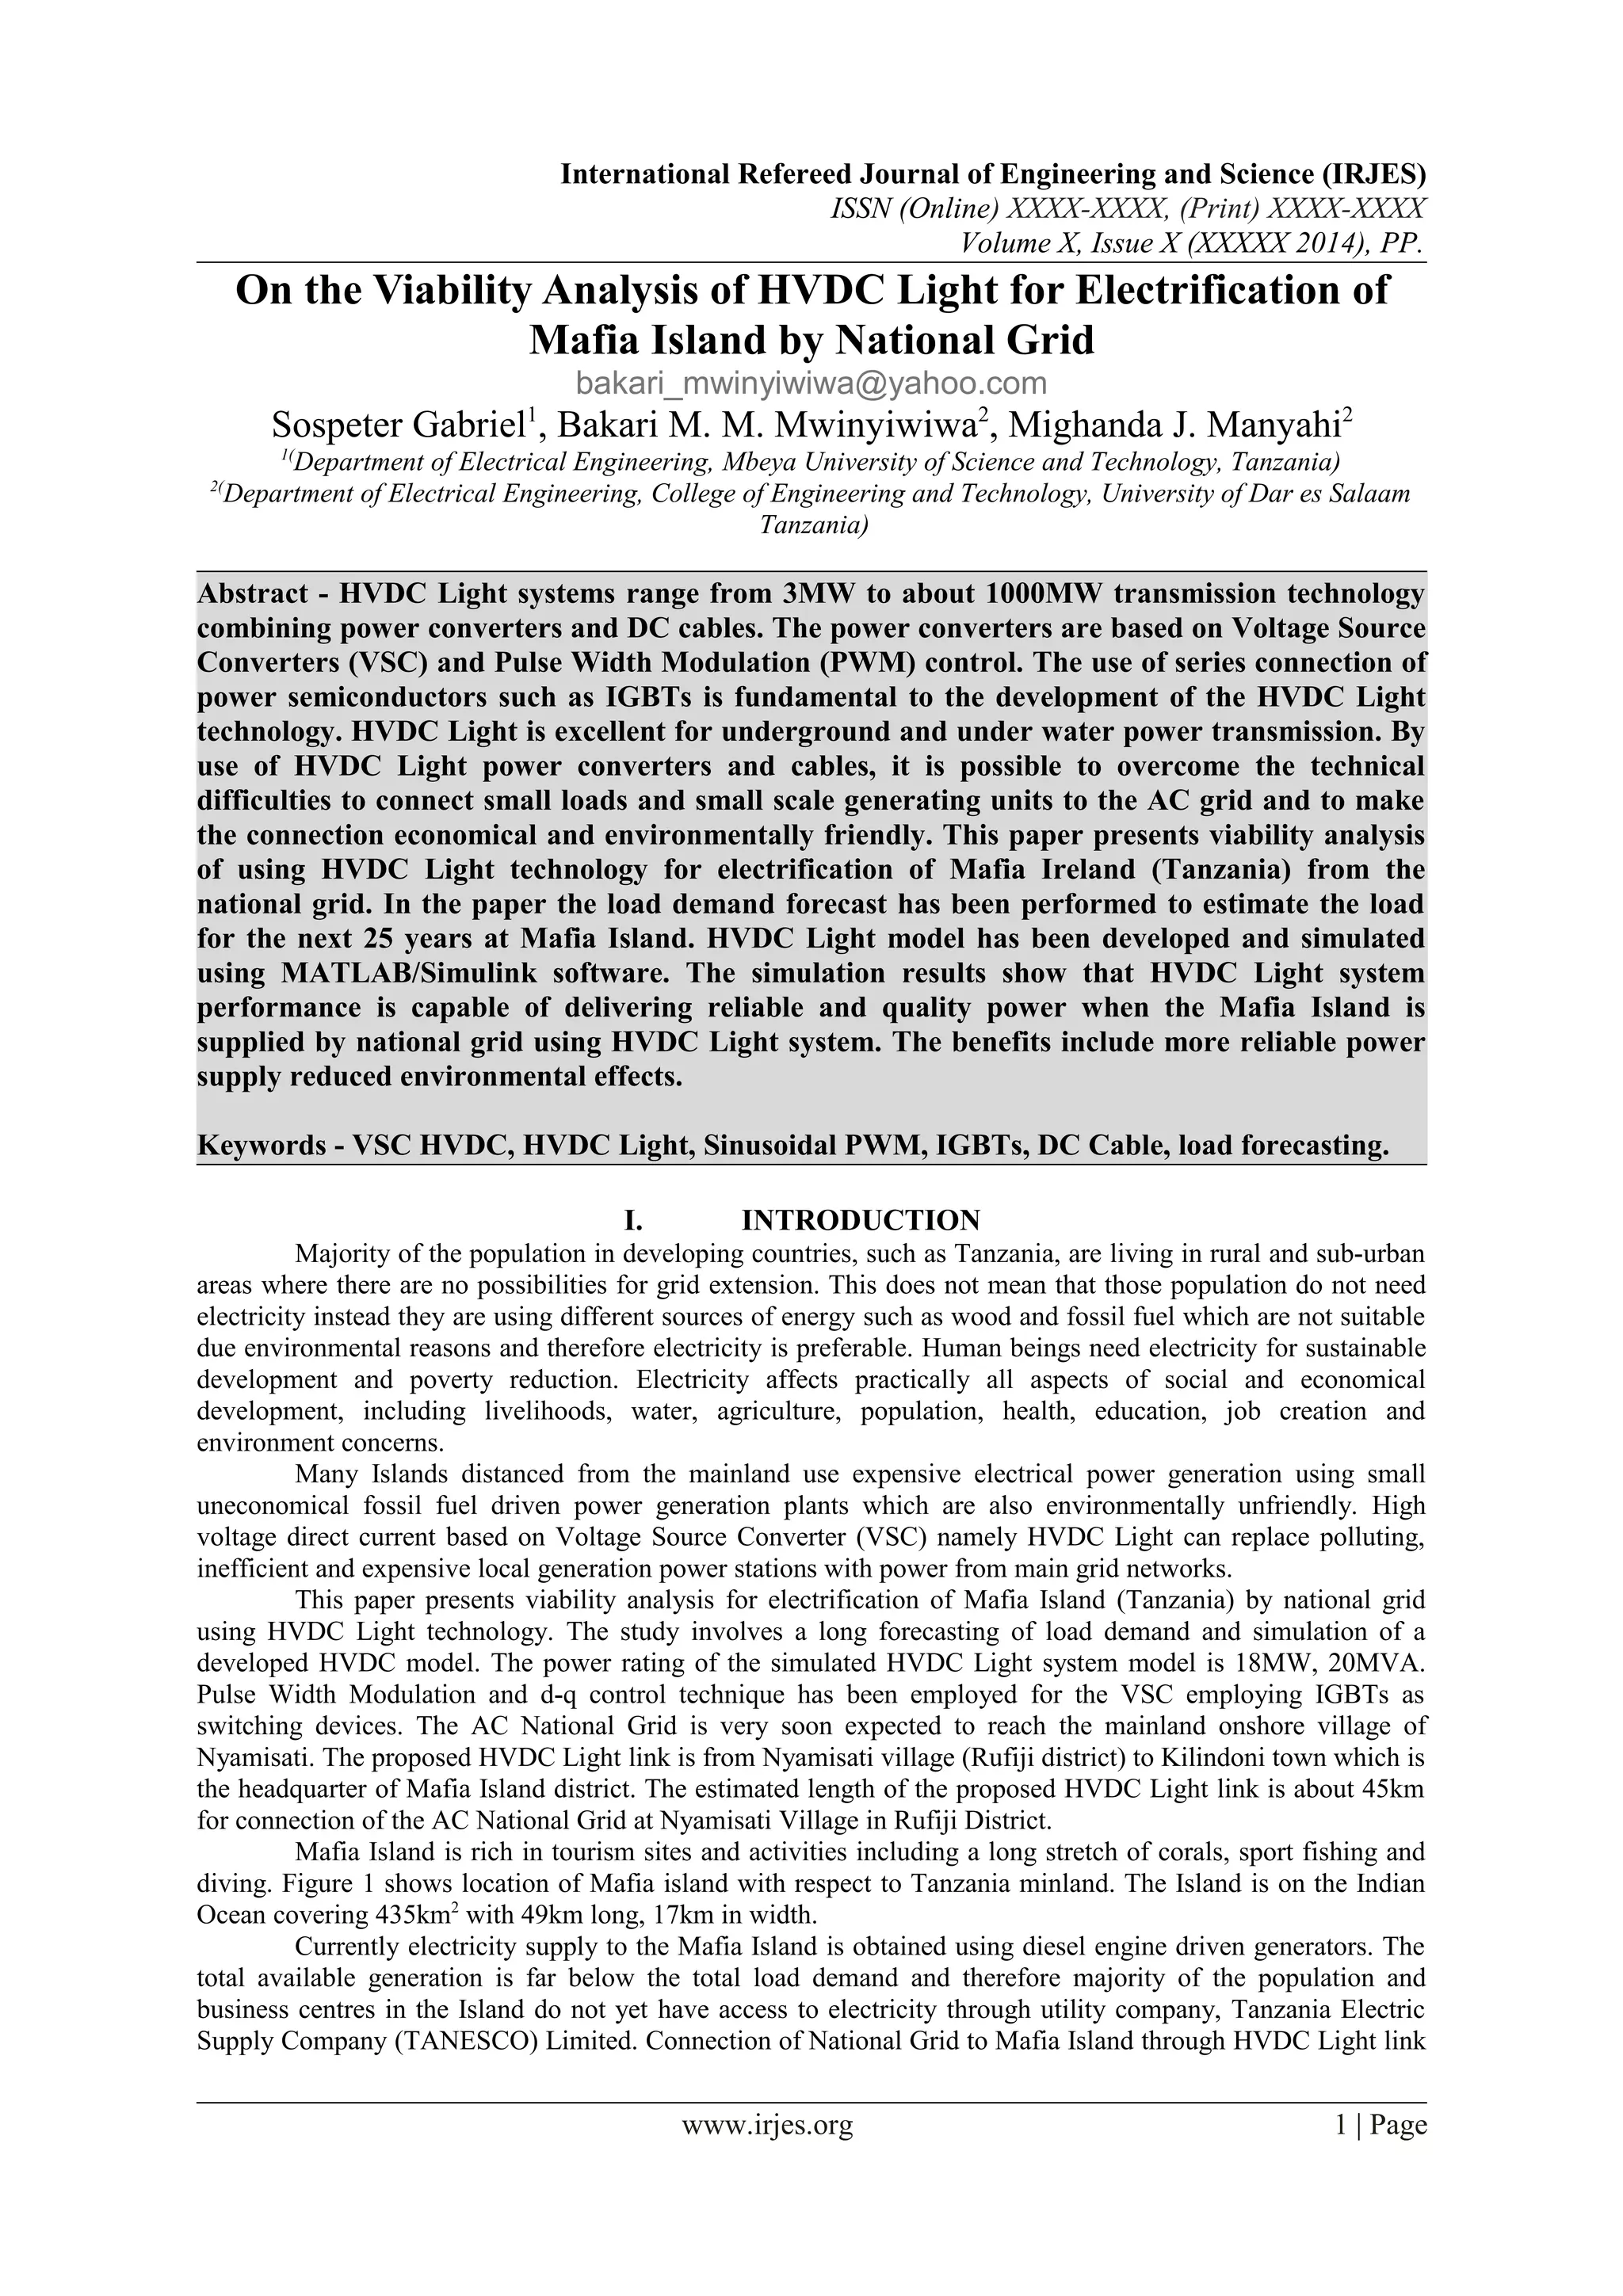
4.2 Power Distribution Trends for Mafia Island.
According to [7] report, the electric power distributed to consumers was approximated 1500MWh per
year in 2005. Three year later in the year 2008 the electric power consumed was more than 2060MWh; this was
an increase of 37%. In the year 2012 five years from 2008 the electric power consumed was 4039MWh; this
was an increase of 96% for that period under study. The trend line analysis has been applied to indentify the
existing trends for electric power supplied to consumer for five years as indicated in figure 6. The mathematical
formula presented is used to derive an estimate of electric load for the next twenty five (25) years.
4.3 Fuel Consumption Trends at Mafia
Island TANESCO Power Plant
Electric power generation at Mafia Island is performed using two diesel generators rated at 525kVA
each. Fuel consumption has been increasing from one year to another regardless of the difficulties in its
transportation to Mafia Island which leads for sometimes shutdown of the power plant. In the year 2008, fuel
consumption was 680,992 litres and in five year later in 2012, the fuel consumption was 1,255,132 litres, which
is 84.3% increase.
4.4 Lubricants Consumption Trends at Mafia Island TANESCO Power Plant
Lubricants are one among the major components which contributes to the electricity generation cost. They are
used to maintain smooth running of the mechanical parts of the electric generator systems. In the year 2008 the
lubricants consumption was 9,050 litres while in 2012 the lubricant consumption was 11,080 litres, this was an
increase of 22.4% for the years under study.
4.5 Maximum Demand Trends at Mafia Island
The maximum demand is the greatest demand of load on the power station during a given period. Maximum
demand is generally less than the connected load because all consumers do not switch on their connected load to
the system simultaneously. In the year 2008 the average maximum demand was 518.33kVA, while in 2012 the
average maximum demand was 839.17kVA, this was an increase of about 62%. The trend line analysis has been
applied to indentify the existing trends for maximum power demand for five years as indicated in figure 7. The
mathematical formula presented is used to derive an estimate of electric load for the next twenty five (25) years.
www.irjes.org 5 | Page
Fig.6 Trend Analysis for the Electric Energy
Distributed to Consumers.](https://image.slidesharecdn.com/310029-150408003856-conversion-gate01/85/On-the-Viability-Analysis-of-HVDC-Light-for-Electrification-of-Mafia-Island-by-National-Grid-5-320.jpg)
![International Refereed Journal of Engineering and Science (IRJES)
ISSN (Online) XXXX-XXXX, (Print) XXXX-XXXX
Volume X, Issue X (XXXXX 2014), PP.
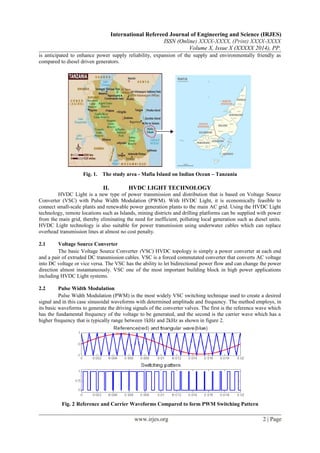
4.6 Load Forecasting at Mafia Island
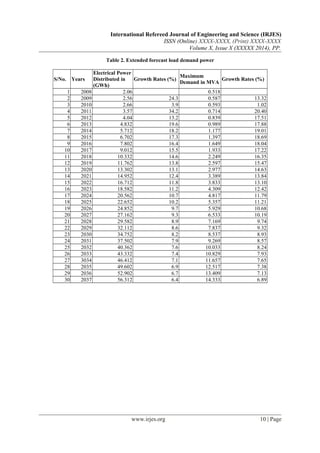
The full extended demand forecast is presented in figure 8 for electric energy to be supplied to consumers and
figure 9 for maximum demand forecast as extended from equations indicated in figure 6 and 7 respectively. The
load forecasting distributed and their respective percentage increase for both maximum power demand and
electric power to be twenty five (25) years is as shown in table 2 in the appendices.
Fig. 7. Trend Analysis for the Average Annual
Electric Power Demand.
Fig. 8. Electric Energy forecast to be distributed
to consumers in GWh at Mafia Island for the next
25 years.
The load demand forecasting
shown in figure 9 does not include those
customers which get their electric power
independent of TANESCO. As it was
pointed out in MIRREA report of 2005 [7]
that, there was an installed capacity of
electric power of about 2.5MW
independent of TANESCO, this means that
for proper load demand forecasting this
power need also to be incorporated because
on the availability of reliable and cheap
electric power source from the Utility
Company (TANESCO) all these consumers
will need to be connected. From that
reality, the electric power independent from
TANESCO was assumed to increase at 8%
i.e. 0.2MW, i.e. from 2.5MW to 2.7MW.
Since the Maximum Power demand are always less than the installed capacity of the power plant for a
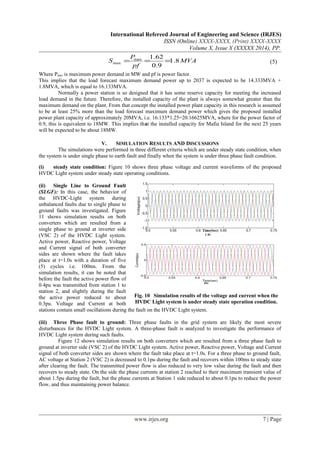
proper operation, the maximum demand of about 60% was assumed in this research i.e. 1.62MW and also a load
factor of 40% was assumed to be used.
Units generated from this independent power source is calculated using (4). Energy generated per
annum is given by
))()(( max HLFPEan = (4)
Where Pmax is maximum power demand, LF is Load Factor and H is number of hours per annum. Therefore
energy units generated per annum is given by
Ean= 1.62*0.4*8760=5676.48MWh 5.68GWh. This implies that the total energy to be transmitted to Mafia
Island is 56.312GWh + 5.68GWh, which is equal to 61.992GWh ≈ 62 GWh in year 2037. For the case of
maximum power demand in MVA, the power factor (pf) of 0.9 was assumed in this research. Therefore the
maximum apparent power demand, Smax, is calculated as given in (5).
www.irjes.org 6 | Page
Fig. 9.Load Forecast for Maximum Power Demand in MVA
at Mafia Island for the next 25 years.](https://image.slidesharecdn.com/310029-150408003856-conversion-gate01/85/On-the-Viability-Analysis-of-HVDC-Light-for-Electrification-of-Mafia-Island-by-National-Grid-6-320.jpg)
![International Refereed Journal of Engineering and Science (IRJES)
ISSN (Online) XXXX-XXXX, (Print) XXXX-XXXX
Volume X, Issue X (XXXXX 2014), PP.
VII. ACKNOWLEDGEMENT
The authors are grateful for financial support provided by Sida from Sweden. Mr. Sospeter Gabriel is
grateful to Mbeya University of Science and Technology, Tanzania, for the study leave granted to him during
his postgraduate studies at the University of Dar es Salaam.
REFERENCES
[1] Gunnar Asplund., “Application of HVDC Light to power system enhancement” ABB Power systems, ABB, IEEE
Winter Meeting, Singapore, 2000.
[2] R. Grünbaum, B. Halvarsson and A. Wilk-Wilczynski, “Facts and HVDC Light for power system interconnectins,”
ABB Power systems AB, Sweden. Presented at PowerDelivery Conference, Madrid, Spain, 1999.
[3] B. Jacobson, Y. Jiang-Häfner, P. Rey G. Asplund, M. Jeroense, A. Gustafsson, M. Bergkvist, “HVDC with Voltage
Source Converters and Extruded Cables for up to ±300 Kv and 1000 MW,” Proceedings of CIGRE 2006, Paris, paper No.
B4-105, 2006.
[4] Michael Bahman, “HVDC Transmission : An Economical Complement to AC Transmissio,” WECC transmission
Planning Seminar, February 2-3, 2009.
[5] Al-Alawi. S.M and Islam, S.M, “Principles of Electricity demand Forecasting I Methodologies,” Power Engineering
Journal, Vol 10, No 3, pp 139-143, 1996.
[6] CH Jeevan Kumar and M, Veerakumar, “Load Forecasting of Andhra Pradesh Grid using PSO, DE Algorithms,”
International Journal of Advanced Research in Computer Engineering and Technology, Vol 1, Issue 9, November, 2012.
[7] Mitigating Risk and strengthening capacity for Rural Electricity Investment in Africa (MIRREIA), “List of key
Investors and Potential Projects”, Kenya, Tanzania and Uganda, 2005.
APPENDICES
Table 1. Customer connection trend for Mafia island
S/No. Months
Years
2008 2009 2010 2011 2012
1 January 1 1 5 5 10
2 February 1 4 1 9 10
3 March 0 2 6 6 29
4 April 0 0 2 4 16
5 May 1 2 3 3 9
6 June 6 1 6 2 9
7 July 1 5 2 6 8
8 August 0 3 5 8 2
9 September 0 0 15 6 6
10 October 1 5 5 3 15
11 November 5 4 3 9 23
12 December 4 2 4 7 1
Total 20 29 57 68 138
www.irjes.org 9 | Page](https://image.slidesharecdn.com/310029-150408003856-conversion-gate01/85/On-the-Viability-Analysis-of-HVDC-Light-for-Electrification-of-Mafia-Island-by-National-Grid-9-320.jpg)

This paper analyzes the feasibility of using HVDC Light technology to electrify Mafia Island, Tanzania, by connecting it to the national grid using a proposed 45km HVDC link from Nyamisati village. The study forecasts a significant growth in electricity demand over the next 25 years, highlighting the advantages of HVDC Light, including reliable power supply and reduced environmental impact compared to diesel generators. The results indicate that HVDC Light can meet the increasing power needs of the island while supporting sustainable development.