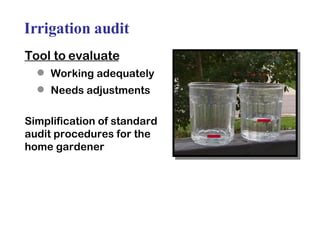
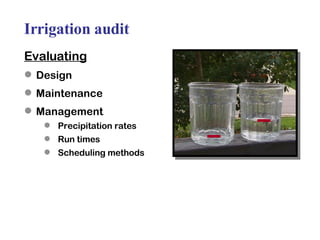
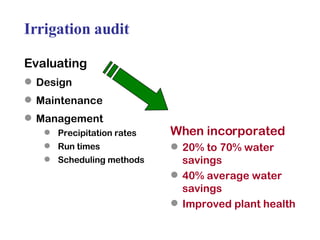
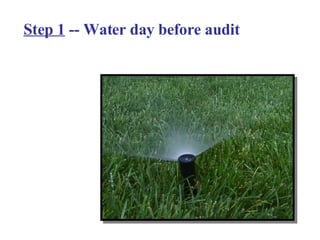
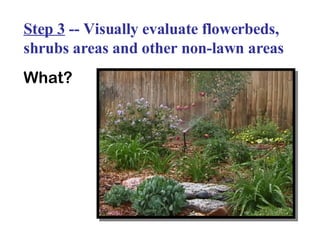
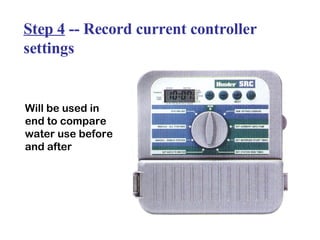
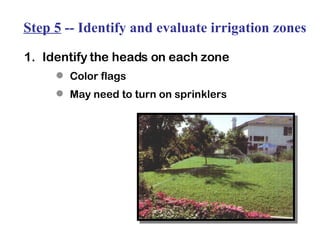
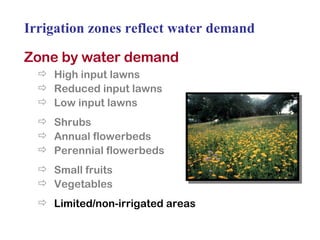
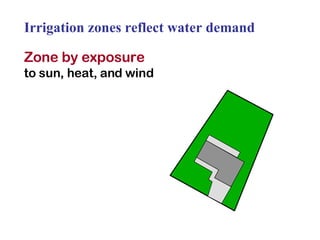
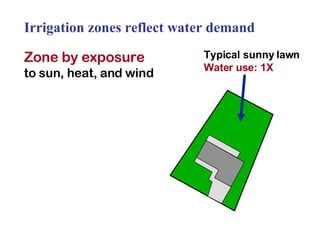
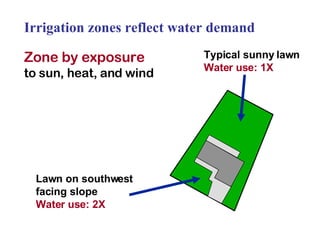
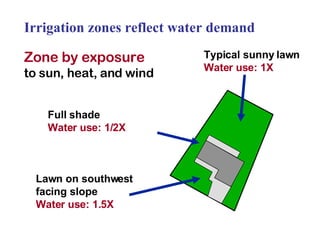
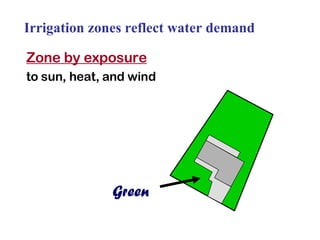
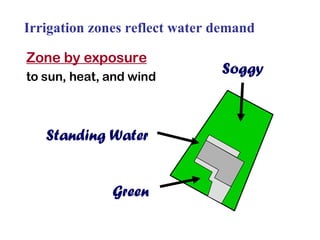
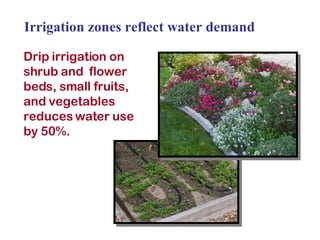
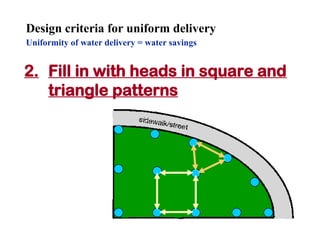
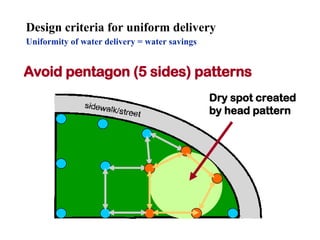
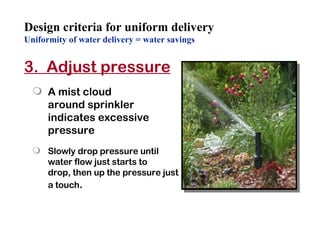
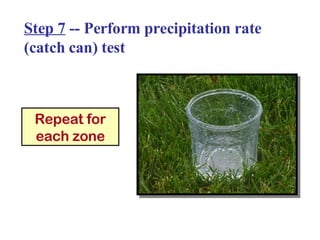
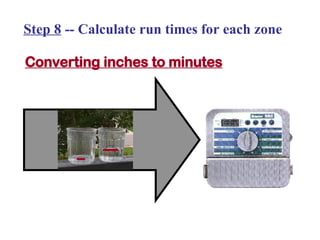
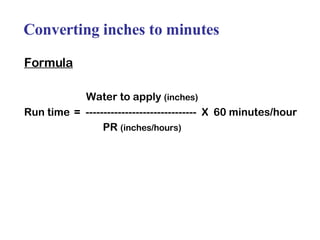
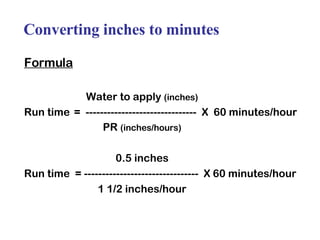
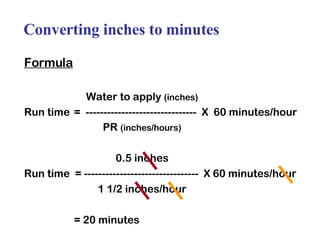
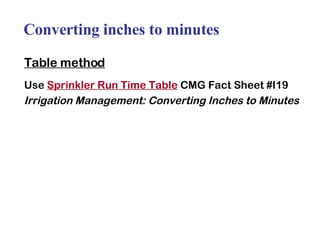
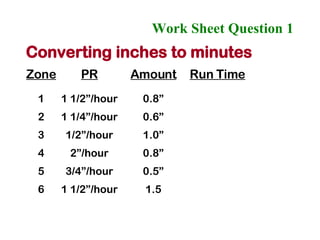
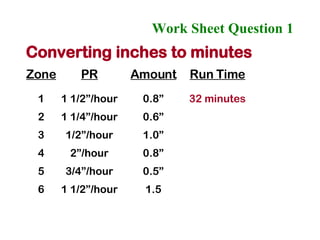
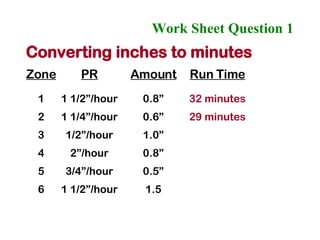
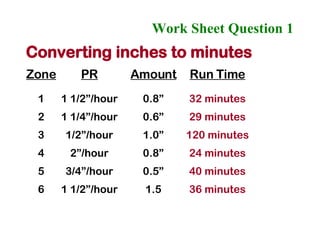
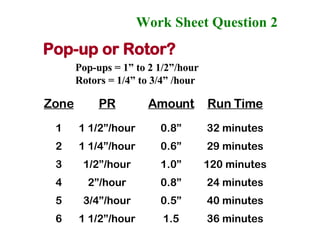
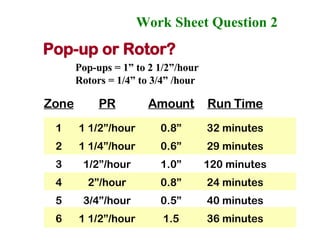
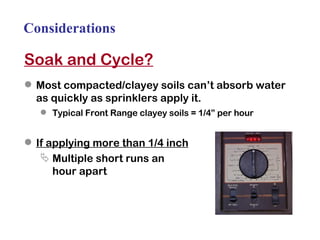
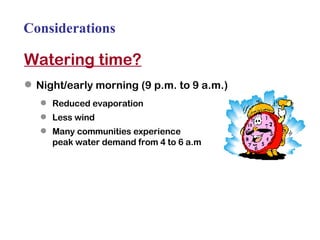
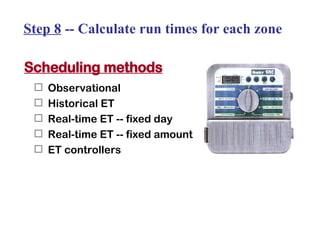
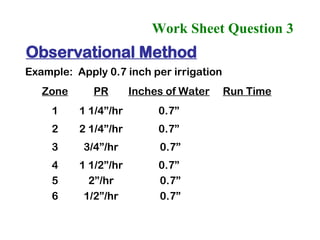
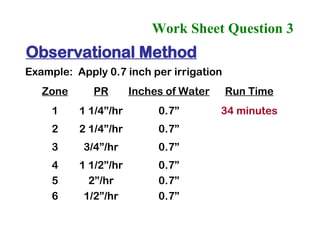
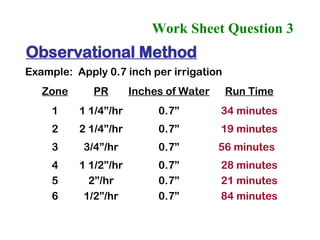
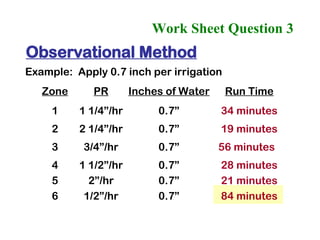
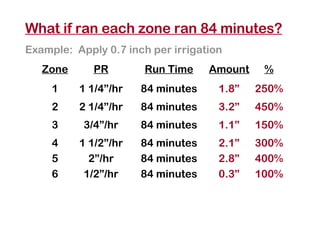
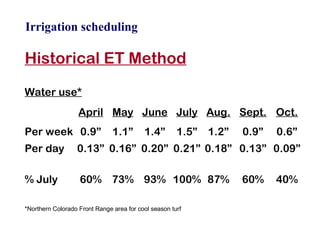
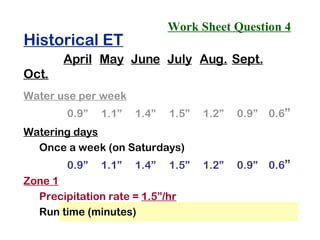
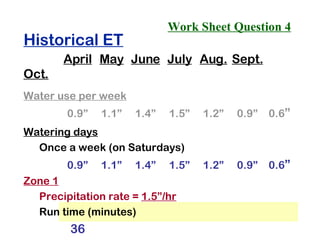
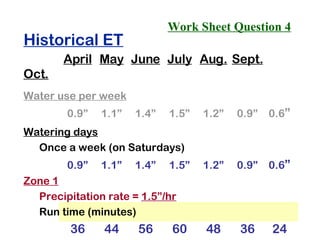
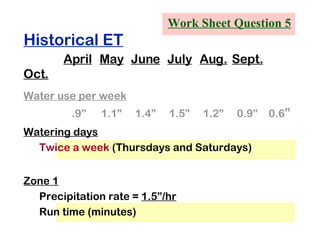
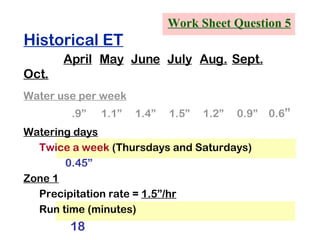
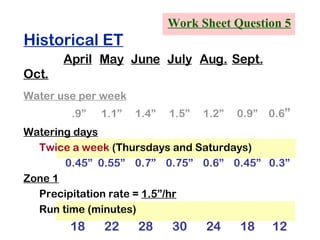
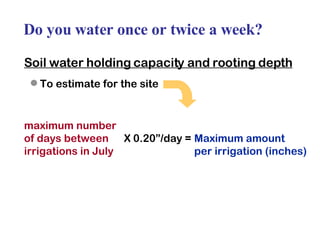
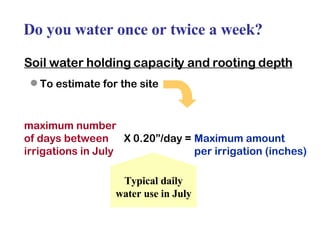
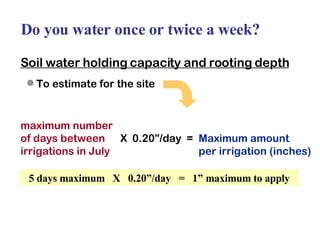
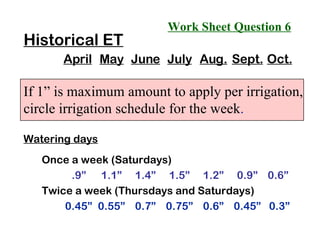
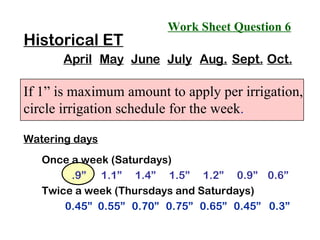
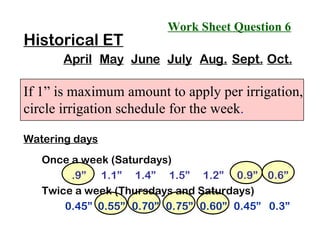
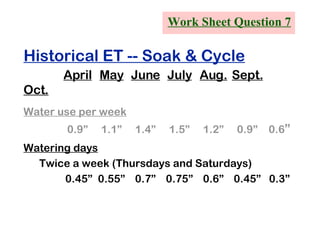
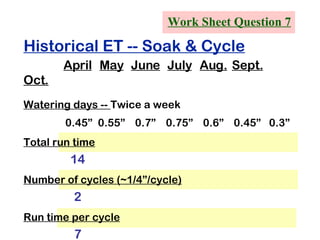
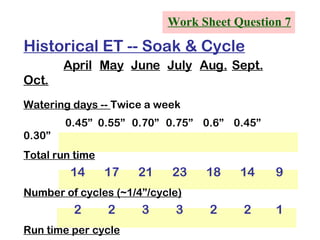
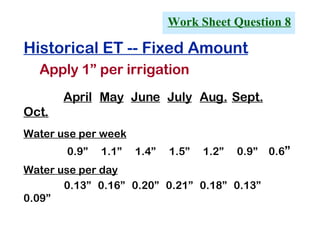
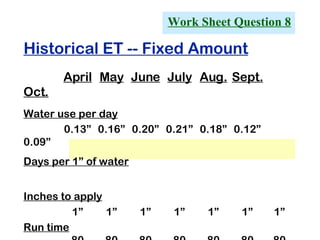
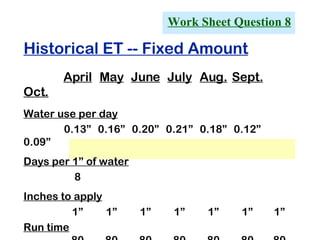
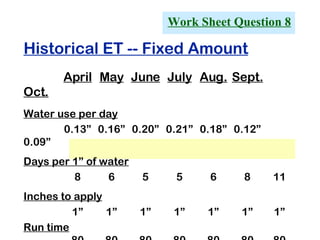
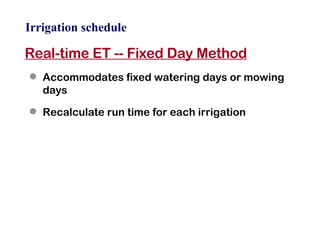
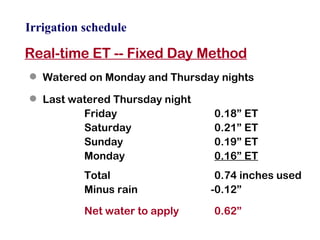
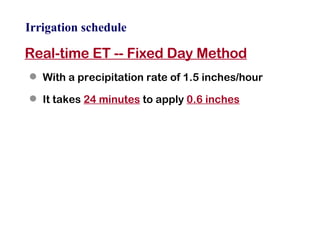
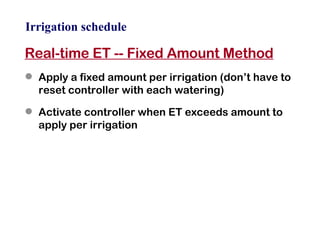
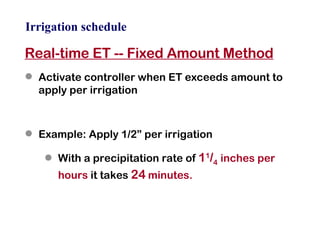
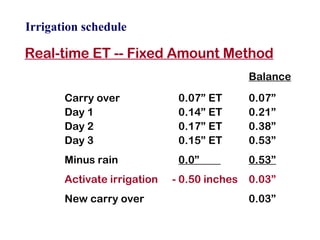
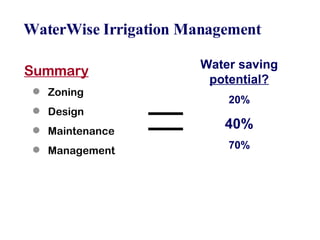
Watering efficiently  with appropriate irrigation methods
Watering efficiently Based on community  water use figures, 40% to 50% of the water used for landscape irrigation is wasted due to poor  design ,  maintenance , and  management . For many yards, the  irrigation system design  and management had little fore-thought for  water conservation.
Watering efficiently Irrigation efficiency has greatest water savings potential for most home gardeners.
Irrigation audit Tool to evaluate Working adequately Needs adjustments Simplification of standard audit procedures for the home gardener
Irrigation audit Evaluating Design Maintenance Management Precipitation rates Run times  Scheduling methods
Irrigation audit Evaluating Design Maintenance Management Precipitation rates Run times  Scheduling methods When incorporated 20% to 70% water savings 40% average water savings Improved plant health
Step 1  -- Water day before audit
Step 2  -- Visually evaluate the lawn Why ?
Step 2  -- Visually evaluate the lawn Why? What?
Small Group Discussion Make of list of “flags” to look for that will identify Management techniques that are successful Management problems
Step 3  -- Visually evaluate flowerbeds, shrubs areas and other non-lawn areas What?
Step 4  -- Record current controller settings Will be used in end to compare water use before and after
Step 5  -- Identify and evaluate irrigation zones 1. Identify the heads on each zone Color flags May need to turn on sprinklers
Step 5  -- Identify and evaluate irrigation zones 2. Evaluate Irrigation zone layout Design criteria for uniform delivery Maintenance criteria for water conservation
Irrigation zones reflect water demand Zone by water demand
Irrigation zones reflect water demand Zone by water demand High input lawns Reduced input lawns Low input lawns
Irrigation zones reflect water demand Zone by water demand High input lawns Reduced input lawns Low input lawns Shrubs Annual flowerbeds Perennial flowerbeds
Irrigation zones reflect water demand Zone by water demand High input lawns Reduced input lawns Low input lawns Shrubs Annual flowerbeds Perennial flowerbeds Small fruits Vegetables
Irrigation zones reflect water demand Zone by water demand High input lawns Reduced input lawns Low input lawns Shrubs Annual flowerbeds Perennial flowerbeds Small fruits Vegetables Limited/non-irrigated areas
Irrigation zones reflect water demand Zone by exposure   to sun, heat, and wind
Irrigation zones reflect water demand Zone by exposure   to sun, heat, and wind Typical sunny lawn Water use: 1X
Irrigation zones reflect water demand Zone by exposure   to sun, heat, and wind Lawn on southwest facing slope Water use: 2X Typical sunny lawn Water use: 1X
Irrigation zones reflect water demand Zone by exposure   to sun, heat, and wind Full shade  Water use: 1/2X Lawn on southwest facing slope Water use: 1.5X Typical sunny lawn Water use: 1X
Irrigation zones reflect water demand Zone by exposure to sun, heat, and wind Green
Irrigation zones reflect water demand Zone by exposure to sun, heat, and wind Standing Water Green Soggy
Irrigation zones reflect water demand Drip irrigation on  shrub and  flower beds, small fruits,  and vegetables  reduces water use  by 50%.
Design criteria for uniform delivery Uniformity of water delivery = water savings   Line-out  along  non-irrigated areas
Design criteria for uniform delivery Uniformity of water delivery = water savings   Line-out   along  non-irrigated areas Don’t water onto  non-irrigated areas
Water-wise irrigation maintenance Uniform type, brand and style of heads in a zone Pop-up heads apply water at 1 to 2 1/2 inches per hour Rotor heads apply water at 1/4 to 3/4 inches per hour
Avoid irrigating small irregular-shaped areas < 7-10’ wide Design criteria for uniform delivery Uniformity of water delivery = water savings
Water-wise irrigation management Turn off in rainy weather Rain shut-off sensor Required by law in  many parts of the  country.  Not yet in  Colorado. Manually
Step 6  -- While sprinklers are running, evaluate performance Repeat evaluation for each zone
Design criteria for uniform delivery Uniformity of water delivery = water savings
Design criteria for uniform delivery Uniformity of water delivery = water savings   1. Head to head coverage Spray from each head should reach neighboring heads 20% overlap gives better uniformity
Design criteria for uniform delivery Uniformity of water delivery = water savings   2. Fill in with heads in square and triangle patterns
Design criteria for uniform delivery Uniformity of water delivery = water savings   Avoid pentagon (5 sides) patterns Dry spot created by head pattern
Design criteria for uniform delivery Uniformity of water delivery = water savings 3.  Adjust pressure A mist cloud  around sprinkler  indicates excessive  pressure Slowly drop pressure until water flow just starts to  drop, then up the pressure just a touch .
Maintenance criteria for uniform water distribution
Deliver arc Is water delivery arc correct to avoid watering sidewalk and other non-irrigated areas? Maintenance criteria for uniform water distribution
Maintenance criteria for uniform water distribution Adjust heads to vertical
Adjust height Is nozzle releasing water above grass height? Maintenance criteria for uniform water distribution
Maintenance criteria for uniform water distribution Replace worn heads/nozzles New head/nozzle Worn head/nozzle
Maintenance criteria for uniform water distribution Replace leaky valves The rubber diaphragm in the value wears out over time
Water-wise irrigation management Evaluate dry spots
Water-wise irrigation management Evaluate dry spots Compare amount of  water received in can from the dry spot to can from the green area Significantly less  = water delivery  problems Fairly similar =  soil or plant  problem
Step 6  -- While sprinklers are running, evaluate performance Repeat evaluation for each zone
Step 7  -- Perform precipitation rate (catch can) test
Precipitation rate test (catch can test) Step 1  -- Place  6  identical, straight sided, flat bottom cans randomly between sprinklers in zone. Do not use short cans like tuna, water may splash out.
Precipitation rate test (catch can test) Step 2  -- Run sprinklers exactly  10  minutes
Precipitation rate test (catch can test) Step 3  -- Pour all the water into one can Step 4  -- Measure depth of water in can This is the  precipitation rate  in  inches per hours Step 5  -- Record in  Table: Step 8
Precipitation rate test (catch can test) Note:  If the amount of water in some containers is significantly more or less than others, it indicates that the system is poorly designed or heads are malfunctioning.
Step 7  -- Perform precipitation rate (catch can) test Repeat for each zone
Step 8  -- Calculate run times for each zone
Step 8  -- Calculate run times for each zone Converting inches to minutes
Converting inches to minutes Formula Water to apply  (inches) Run time =  -------------------------------  X  60 minutes/hour PR  (inches/hours)
Converting inches to minutes Formula Water to apply  (inches) Run time =  -------------------------------  X  60 minutes/hour PR  (inches/hours) 0.5 inches Run time  = --------------------------------  X 60 minutes/hour 1 1/2 inches/hour
Converting inches to minutes Formula Water to apply  (inches) Run time =  -------------------------------  X  60 minutes/hour PR  (inches/hours) 0.5 inches Run time  = --------------------------------  X 60 minutes/hour 1 1/2 inches/hour = 20 minutes
Converting inches to minutes Table method Use  Sprinkler Run Time Table  CMG Fact Sheet #I19 Irrigation Management: Converting Inches to Minutes
Work Sheet Question 1   Converting inches to minutes
Work Sheet Question 1   Zone PR Amount Run Time 1 1 1/2”/hour 0.8” 2 1 1/4”/hour 0.6” 3 1/2”/hour 1.0” 4 2”/hour 0.8” 5 3/4”/hour 0.5” 6 1 1/2”/hour 1.5 Converting inches to minutes
Work Sheet Question 1   Zone PR Amount Run Time 1 1 1/2”/hour 0.8” 32 minutes 2 1 1/4”/hour 0.6” 3 1/2”/hour 1.0” 4 2”/hour 0.8” 5 3/4”/hour 0.5” 6 1 1/2”/hour 1.5 Converting inches to minutes
Work Sheet Question 1   Zone PR Amount Run Time 1 1 1/2”/hour 0.8” 32 minutes 2 1 1/4”/hour 0.6” 29 minutes 3 1/2”/hour 1.0” 4 2”/hour 0.8” 5 3/4”/hour 0.5” 6 1 1/2”/hour 1.5 Converting inches to minutes
Work Sheet Question 1   Zone PR Amount Run Time 1 1 1/2”/hour 0.8” 32 minutes 2 1 1/4”/hour 0.6” 29 minutes 3 1/2”/hour 1.0” 120 minutes 4 2”/hour 0.8” 24 minutes 5 3/4”/hour 0.5” 40 minutes 6 1 1/2”/hour 1.5 36 minutes Converting inches to minutes
Water-wise irrigation maintenance Uniform type, brand and style of heads in a zone Pop-up heads apply water at 1 to 2 1/2 inches per hour Rotor heads apply water at 1/4 to 3/4 inches per hour
Work Sheet Question 2   Zone PR Amount Run Time 1 1 1/2”/hour 0.8” 32 minutes 2 1 1/4”/hour 0.6” 29 minutes 3 1/2”/hour 1.0” 120 minutes 4 2”/hour 0.8” 24 minutes 5 3/4”/hour 0.5” 40 minutes 6 1 1/2”/hour 1.5 36 minutes Pop-up or Rotor? Pop-ups = 1” to 2 1/2”/hour Rotors = 1/4” to 3/4” /hour
Step 8  -- Calculate run times for each zone
Considerations Soak and Cycle? Most compacted/clayey soils can’t absorb water as quickly as sprinklers apply it. Typical Front Range clayey soils = 1/4” per hour If applying more than 1/4 inch Multiple short runs an  hour apart
Considerations Watering time? Night/early morning (9 p.m. to 9 a.m.) Reduced evaporation Less wind Many communities experience  peak water demand from 4 to 6 a.m
Considerations Soil water holding capacity and rooting depth? In typical July weather Lawn goes ___ days on ____ inches  (Step 2) Maximum amount for soil water holding capacity and rooting depth is ___ inches Preferred amount? ______________  Irrigation days? _________________
Step 8  -- Calculate run times for each zone Scheduling methods Observational Historical ET Real-time ET -- fixed day  Real-time ET -- fixed amount ET controllers
Irrigation scheduling Observational method Recommended by many communities to reduce over-watering Manually activate the controller to run cycles
Irrigation scheduling Observational method Set controller for desired amount of water Manually turn on when lawn show symptoms of water shortage Footprints show in lawn for an hour or more Color change from  grassy green to bluish- gray Turn to “off” until next  irrigation cycle is  needed.
Work Sheet Question 3   Observational Method
Work Sheet Question 3   Example:  Apply 0.7 inch per irrigation Zone PR Inches of Water Run Time 1 1 1/4”/hr 0.7” 2 2 1/4”/hr 0.7” 3 3/4”/hr  0.7” 4 1 1/2”/hr  0.7”  5 2”/hr  0.7” 6 1/2”/hr  0.7” Observational Method
Work Sheet Question 3   Example:  Apply 0.7 inch per irrigation Zone PR Inches of Water Run Time 1 1 1/4”/hr 0.7” 34 minutes 2 2 1/4”/hr 0.7” 3 3/4”/hr 0.7” 4 1 1/2”/hr 0.7” 5 2”/hr 0.7” 6 1/2”/hr 0.7” Observational Method
Work Sheet Question 3   Example:  Apply 0.7 inch per irrigation Zone PR Inches of Water Run Time 1 1 1/4”/hr 0.7” 34 minutes 2 2 1/4”/hr 0.7” 19 minutes 3 3/4”/hr 0.7” 56 minutes  4 1 1/2”/hr 0.7” 28 minutes 5 2”/hr 0.7” 21 minutes 6 1/2”/hr 0.7” 84 minutes Observational Method
What if ran each zone ran 84 minutes? Example:  Apply 0.7 inch per irrigation Zone PR Run Time Amount % 1 1 1/4”/hr 84 minutes 1.8” 250% 2 2 1/4”/hr 84 minutes 3.2” 450% 3 3/4”/hr 84 minutes 1.1” 150% 4 1 1/2”/hr 84 minutes 2.1” 300% 5 2”/hr 84 minutes 2.8” 400% 6 1/2”/hr 84 minutes 0.3” 100%
Irrigation scheduling Historical ET Method Water use* April May June July Aug. Sept. Oct. Per week 0.9” 1.1” 1.4” 1.5” 1.2” 0.9” 0.6” Per day 0.13” 0.16” 0.20” 0.21” 0.18” 0.13” 0.09” % July 60% 73% 93% 100% 87% 60% 40% *Northern Colorado Front Range area for cool season turf
Work Sheet Question 4 Historical ET
Work sheet Question 4 Historical ET April May June July Aug. Sept. Oct. Water use per week 0.9” 1.1” 1.4” 1.5” 1.2” 0.9” 0.6 ”
Historical ET April May June July Aug. Sept. Oct. Water use per week 0.9” 1.1” 1.4” 1.5” 1.2” 0.9” 0.6 ” Watering days Once a week (on Saturdays) Work Sheet Question 4
Historical ET April May June July Aug. Sept. Oct. Water use per week 0.9” 1.1” 1.4” 1.5” 1.2” 0.9” 0.6 ” Watering days Once a week (on Saturdays) 0.9”   Work Sheet Question 4
Historical ET April May June July Aug. Sept. Oct. Water use per week 0.9” 1.1” 1.4” 1.5” 1.2” 0.9” 0.6 ” Watering days Once a week (on Saturdays) 0.9” 1.1” 1.4” 1.5” 1.2” 0.9” 0.6 ” Work Sheet Question 4
Work Sheet Question 4 Historical ET April May June July Aug. Sept. Oct. Water use per week 0.9” 1.1” 1.4” 1.5” 1.2” 0.9” 0.6 ” Watering days Once a week (on Saturdays) 0.9” 1.1” 1.4” 1.5” 1.2” 0.9” 0.6 ” Zone 1 Precipitation rate =  1.5”/hr Run time (minutes)
Work Sheet Question 4 Historical ET April May June July Aug. Sept. Oct. Water use per week 0.9” 1.1” 1.4” 1.5” 1.2” 0.9” 0.6 ” Watering days Once a week (on Saturdays) 0.9” 1.1” 1.4” 1.5” 1.2” 0.9” 0.6 ” Zone 1 Precipitation rate =  1.5”/hr Run time (minutes) 36
Work Sheet Question 4 Historical ET April May June July Aug. Sept. Oct. Water use per week 0.9” 1.1” 1.4” 1.5” 1.2” 0.9” 0.6 ” Watering days Once a week (on Saturdays) 0.9” 1.1” 1.4” 1.5” 1.2” 0.9” 0.6 ” Zone 1 Precipitation rate =  1.5”/hr Run time (minutes) 36 44 56 60 48 36 24
Historical ET April May June July Aug. Sept. Oct. Water use per week   .9” 1.1” 1.4” 1.5” 1.2” 0.9” 0.6 ” Watering days Twice a week  (Thursdays and Saturdays)   Zone 1 Precipitation rate =  1.5”/hr Run time (minutes)   Work Sheet Question 5
Work Sheet Question 5 Historical ET April May June July Aug. Sept. Oct. Water use per week   .9” 1.1” 1.4” 1.5” 1.2” 0.9” 0.6 ” Watering days Twice a week  (Thursdays and Saturdays)   0.45” Zone 1 Precipitation rate =  1.5”/hr Run time (minutes) 18
Historical ET April May June July Aug. Sept. Oct. Water use per week   .9” 1.1” 1.4” 1.5” 1.2” 0.9” 0.6 ” Watering days Twice a week  (Thursdays and Saturdays)   0.45” 0.55” 0.7” 0.75” 0.6” 0.45” 0.3” Zone 1 Precipitation rate =  1.5”/hr Run time (minutes) 18 22 28 30 24 18 12 Work Sheet Question 5
Do you water once or twice a week? Soil water holding capacity and rooting depth   To estimate for the site maximum number of days between X 0.20”/day = Maximum amount irrigations in July per irrigation (inches)
Do you water once or twice a week? Soil water holding capacity and rooting depth   To estimate for the site maximum number of days between X 0.20”/day = Maximum amount irrigations in July per irrigation (inches) Typical daily water use in July
Do you water once or twice a week? Soil water holding capacity and rooting depth   To estimate for the site maximum number of days between X  0.20”/day  = Maximum amount irrigations in July per irrigation (inches) 5 days maximum  X  0.20”/day  =  1” maximum to apply
Historical ET April May June July Aug. Sept. Oct. If 1” is maximum amount to apply per irrigation, circle irrigation schedule for the week . Watering days Once a week (Saturdays)   .9” 1.1” 1.4” 1.5” 1.2” 0.9” 0.6”   Twice a week (Thursdays and Saturdays)   0.45” 0.55” 0.7” 0.75” 0.6” 0.45” 0.3” Work Sheet Question 6
Work Sheet Question 6 Historical ET April May June July Aug. Sept. Oct. If 1” is maximum amount to apply per irrigation, circle irrigation schedule for the week . Watering days Once a week (Saturdays)   .9” 1.1” 1.4” 1.5” 1.2” 0.9” 0.6”   Twice a week (Thursdays and Saturdays)   0.45” 0.55” 0.70” 0.75” 0.65” 0.45” 0.3”
Work Sheet Question 6 Historical ET April May June July Aug. Sept. Oct. If 1” is maximum amount to apply per irrigation, circle irrigation schedule for the week . Watering days Once a week (Saturdays)   .9” 1.1” 1.4” 1.5” 1.2” 0.9” 0.6”   Twice a week (Thursdays and Saturdays)   0.45” 0.55” 0.70” 0.75” 0.60” 0.45” 0.3”
Work Sheet Question 7 Historical ET -- Soak & Cycle April May June July Aug. Sept. Oct. Water use per week 0.9” 1.1” 1.4” 1.5” 1.2” 0.9” 0.6 ” Watering days Twice a week (Thursdays and Saturdays)  0.45” 0.55” 0.7” 0.75” 0.6” 0.45” 0.3”
Work Sheet Question 7 Historical ET -- Soak & Cycle April May June July Aug. Sept. Oct. Watering days --  Twice a week   0.45” 0.55” 0.7” 0.75” 0.6” 0.45” 0.3” Total run time Number of cycles (~1/4”/cycle) Run time per cycle
Work Sheet Question 7 Historical ET -- Soak & Cycle April May June July Aug. Sept. Oct. Watering days --  Twice a week   0.45” 0.55” 0.7” 0.75” 0.6” 0.45” 0.3” Total run time 14 Number of cycles (~1/4”/cycle) 2 Run time per cycle 7
Work Sheet Question 7 Historical ET -- Soak & Cycle April May June July Aug. Sept. Oct. Watering days --  Twice a week   0.45” 0.55” 0.70” 0.75” 0.6” 0.45” 0.30” Total run time 14 17 21 23 18 14 9 Number of cycles (~1/4”/cycle) 2 2 3 3 2 2 1 Run time per cycle 7 9 7 8 9 7 9
Work Sheet Question 8 Historical ET -- Fixed Amount Apply 1” per irrigation April May June July Aug. Sept. Oct. Water use per week 0.9” 1.1” 1.4” 1.5” 1.2” 0.9” 0.6 ” Water use per day 0.13” 0.16” 0.20” 0.21” 0.18” 0.13” 0.09”
Historical ET -- Fixed Amount April May June July Aug. Sept. Oct. Water use per day 0.13” 0.16” 0.20” 0.21” 0.18” 0.12” 0.09” Days per 1” of water Inches to apply 1” 1” 1” 1” 1” 1” 1” Run time 80 80 80 80 80 80 80 Work Sheet Question 8
Historical ET -- Fixed Amount April May June July Aug. Sept. Oct. Water use per day 0.13” 0.16” 0.20” 0.21” 0.18” 0.12” 0.09” Days per 1” of water 8 Inches to apply 1” 1” 1” 1” 1” 1” 1” Run time 80 80 80 80 80 80 80 Work Sheet Question 8
Historical ET -- Fixed Amount April May June July Aug. Sept. Oct. Water use per day 0.13” 0.16” 0.20” 0.21” 0.18” 0.12” 0.09” Days per 1” of water 8 6 5 5 6 8 11 Inches to apply 1” 1” 1” 1” 1” 1” 1” Run time 80 80 80 80 80 80 80 Work Sheet Question 8
Step 8  -- Calculate run times for each zone Scheduling methods Observational Historical ET Real-time ET -- fixed day  Real-time ET -- fixed amount ET controllers
Irrigation schedule Real-time ET -- Fixed Day Method Accommodates fixed watering days or mowing days Recalculate run time for each irrigation
Irrigation schedule Real-time ET -- Fixed Day Method Watered on Monday and Thursday nights Last watered Thursday night Friday 0.18” ET Saturday 0.21” ET Sunday 0.19” ET Monday 0.16” ET Total 0.74 inches used Minus rain -0.12” Net water to apply 0.62”
Irrigation schedule Real-time ET -- Fixed Day Method With a precipitation rate of 1.5 inches/hour It takes  24 minutes  to apply  0.6 inches
Irrigation schedule Real-time ET -- Fixed Amount Method Apply a fixed amount per irrigation (don’t have to reset controller with each watering) Activate controller when ET exceeds amount to apply per irrigation
Irrigation schedule Real-time ET -- Fixed Amount Method Activate controller when ET exceeds amount to apply per irrigation Example: Apply 1/2” per irrigation With a precipitation rate of  1 1 / 4   inches per hours  it takes  24  minutes.
Irrigation schedule Real-time ET -- Fixed Amount Method Balance Carry over 0.07” ET 0.07” Day 1 0.14” ET 0.21” Day 2 0.17” ET 0.38” Day 3 0.15” ET 0.53” Minus rain 0.0”  0.53” Activate irrigation   - 0.50 inches  0.03” New carry over 0.03”
WaterWise Irrigation Management ET Controllers Coming to home garden trade in few years Some work on historical ET Some work on real-time ET, connecting via phone or satellite to a local weather station data bank (for a small monthly fee).
 
Design criteria for uniform delivery Uniformity of water delivery = water savings   3. Fill in with heads in square and triangle patterns. 1.  Head- to-head coverage 2.  “Line-out”
If your sprinkler system doesn’t meet this criteria, consider upgrading the design. Water saving  20% to  over 40% Recover costs  in 3-15 years Design criteria for uniform delivery Uniformity of water delivery = water savings
WaterWise Irrigation Management Summary Zoning Design Maintenance Management Water saving  potential? 20% 40% 70%
 

3 Wwg Audit[1]

  • 1.
  • 2.
    Watering efficiently with appropriate irrigation methods
  • 3.
    Watering efficiently Basedon community water use figures, 40% to 50% of the water used for landscape irrigation is wasted due to poor design , maintenance , and management . For many yards, the irrigation system design and management had little fore-thought for water conservation.
  • 4.
    Watering efficiently Irrigationefficiency has greatest water savings potential for most home gardeners.
  • 5.
    Irrigation audit Toolto evaluate Working adequately Needs adjustments Simplification of standard audit procedures for the home gardener
  • 6.
    Irrigation audit EvaluatingDesign Maintenance Management Precipitation rates Run times Scheduling methods
  • 7.
    Irrigation audit EvaluatingDesign Maintenance Management Precipitation rates Run times Scheduling methods When incorporated 20% to 70% water savings 40% average water savings Improved plant health
  • 8.
    Step 1 -- Water day before audit
  • 9.
    Step 2 -- Visually evaluate the lawn Why ?
  • 10.
    Step 2 -- Visually evaluate the lawn Why? What?
  • 11.
    Small Group DiscussionMake of list of “flags” to look for that will identify Management techniques that are successful Management problems
  • 12.
    Step 3 -- Visually evaluate flowerbeds, shrubs areas and other non-lawn areas What?
  • 13.
    Step 4 -- Record current controller settings Will be used in end to compare water use before and after
  • 14.
    Step 5 -- Identify and evaluate irrigation zones 1. Identify the heads on each zone Color flags May need to turn on sprinklers
  • 15.
    Step 5 -- Identify and evaluate irrigation zones 2. Evaluate Irrigation zone layout Design criteria for uniform delivery Maintenance criteria for water conservation
  • 16.
    Irrigation zones reflectwater demand Zone by water demand
  • 17.
    Irrigation zones reflectwater demand Zone by water demand High input lawns Reduced input lawns Low input lawns
  • 18.
    Irrigation zones reflectwater demand Zone by water demand High input lawns Reduced input lawns Low input lawns Shrubs Annual flowerbeds Perennial flowerbeds
  • 19.
    Irrigation zones reflectwater demand Zone by water demand High input lawns Reduced input lawns Low input lawns Shrubs Annual flowerbeds Perennial flowerbeds Small fruits Vegetables
  • 20.
    Irrigation zones reflectwater demand Zone by water demand High input lawns Reduced input lawns Low input lawns Shrubs Annual flowerbeds Perennial flowerbeds Small fruits Vegetables Limited/non-irrigated areas
  • 21.
    Irrigation zones reflectwater demand Zone by exposure to sun, heat, and wind
  • 22.
    Irrigation zones reflectwater demand Zone by exposure to sun, heat, and wind Typical sunny lawn Water use: 1X
  • 23.
    Irrigation zones reflectwater demand Zone by exposure to sun, heat, and wind Lawn on southwest facing slope Water use: 2X Typical sunny lawn Water use: 1X
  • 24.
    Irrigation zones reflectwater demand Zone by exposure to sun, heat, and wind Full shade Water use: 1/2X Lawn on southwest facing slope Water use: 1.5X Typical sunny lawn Water use: 1X
  • 25.
    Irrigation zones reflectwater demand Zone by exposure to sun, heat, and wind Green
  • 26.
    Irrigation zones reflectwater demand Zone by exposure to sun, heat, and wind Standing Water Green Soggy
  • 27.
    Irrigation zones reflectwater demand Drip irrigation on shrub and flower beds, small fruits, and vegetables reduces water use by 50%.
  • 28.
    Design criteria foruniform delivery Uniformity of water delivery = water savings Line-out along non-irrigated areas
  • 29.
    Design criteria foruniform delivery Uniformity of water delivery = water savings Line-out along non-irrigated areas Don’t water onto non-irrigated areas
  • 30.
    Water-wise irrigation maintenanceUniform type, brand and style of heads in a zone Pop-up heads apply water at 1 to 2 1/2 inches per hour Rotor heads apply water at 1/4 to 3/4 inches per hour
  • 31.
    Avoid irrigating smallirregular-shaped areas < 7-10’ wide Design criteria for uniform delivery Uniformity of water delivery = water savings
  • 32.
    Water-wise irrigation managementTurn off in rainy weather Rain shut-off sensor Required by law in many parts of the country. Not yet in Colorado. Manually
  • 33.
    Step 6 -- While sprinklers are running, evaluate performance Repeat evaluation for each zone
  • 34.
    Design criteria foruniform delivery Uniformity of water delivery = water savings
  • 35.
    Design criteria foruniform delivery Uniformity of water delivery = water savings 1. Head to head coverage Spray from each head should reach neighboring heads 20% overlap gives better uniformity
  • 36.
    Design criteria foruniform delivery Uniformity of water delivery = water savings 2. Fill in with heads in square and triangle patterns
  • 37.
    Design criteria foruniform delivery Uniformity of water delivery = water savings Avoid pentagon (5 sides) patterns Dry spot created by head pattern
  • 38.
    Design criteria foruniform delivery Uniformity of water delivery = water savings 3. Adjust pressure A mist cloud around sprinkler indicates excessive pressure Slowly drop pressure until water flow just starts to drop, then up the pressure just a touch .
  • 39.
    Maintenance criteria foruniform water distribution
  • 40.
    Deliver arc Iswater delivery arc correct to avoid watering sidewalk and other non-irrigated areas? Maintenance criteria for uniform water distribution
  • 41.
    Maintenance criteria foruniform water distribution Adjust heads to vertical
  • 42.
    Adjust height Isnozzle releasing water above grass height? Maintenance criteria for uniform water distribution
  • 43.
    Maintenance criteria foruniform water distribution Replace worn heads/nozzles New head/nozzle Worn head/nozzle
  • 44.
    Maintenance criteria foruniform water distribution Replace leaky valves The rubber diaphragm in the value wears out over time
  • 45.
  • 46.
    Water-wise irrigation managementEvaluate dry spots Compare amount of water received in can from the dry spot to can from the green area Significantly less = water delivery problems Fairly similar = soil or plant problem
  • 47.
    Step 6 -- While sprinklers are running, evaluate performance Repeat evaluation for each zone
  • 48.
    Step 7 -- Perform precipitation rate (catch can) test
  • 49.
    Precipitation rate test(catch can test) Step 1 -- Place 6 identical, straight sided, flat bottom cans randomly between sprinklers in zone. Do not use short cans like tuna, water may splash out.
  • 50.
    Precipitation rate test(catch can test) Step 2 -- Run sprinklers exactly 10 minutes
  • 51.
    Precipitation rate test(catch can test) Step 3 -- Pour all the water into one can Step 4 -- Measure depth of water in can This is the precipitation rate in inches per hours Step 5 -- Record in Table: Step 8
  • 52.
    Precipitation rate test(catch can test) Note: If the amount of water in some containers is significantly more or less than others, it indicates that the system is poorly designed or heads are malfunctioning.
  • 53.
    Step 7 -- Perform precipitation rate (catch can) test Repeat for each zone
  • 54.
    Step 8 -- Calculate run times for each zone
  • 55.
    Step 8 -- Calculate run times for each zone Converting inches to minutes
  • 56.
    Converting inches tominutes Formula Water to apply (inches) Run time = ------------------------------- X 60 minutes/hour PR (inches/hours)
  • 57.
    Converting inches tominutes Formula Water to apply (inches) Run time = ------------------------------- X 60 minutes/hour PR (inches/hours) 0.5 inches Run time = -------------------------------- X 60 minutes/hour 1 1/2 inches/hour
  • 58.
    Converting inches tominutes Formula Water to apply (inches) Run time = ------------------------------- X 60 minutes/hour PR (inches/hours) 0.5 inches Run time = -------------------------------- X 60 minutes/hour 1 1/2 inches/hour = 20 minutes
  • 59.
    Converting inches tominutes Table method Use Sprinkler Run Time Table CMG Fact Sheet #I19 Irrigation Management: Converting Inches to Minutes
  • 60.
    Work Sheet Question1 Converting inches to minutes
  • 61.
    Work Sheet Question1 Zone PR Amount Run Time 1 1 1/2”/hour 0.8” 2 1 1/4”/hour 0.6” 3 1/2”/hour 1.0” 4 2”/hour 0.8” 5 3/4”/hour 0.5” 6 1 1/2”/hour 1.5 Converting inches to minutes
  • 62.
    Work Sheet Question1 Zone PR Amount Run Time 1 1 1/2”/hour 0.8” 32 minutes 2 1 1/4”/hour 0.6” 3 1/2”/hour 1.0” 4 2”/hour 0.8” 5 3/4”/hour 0.5” 6 1 1/2”/hour 1.5 Converting inches to minutes
  • 63.
    Work Sheet Question1 Zone PR Amount Run Time 1 1 1/2”/hour 0.8” 32 minutes 2 1 1/4”/hour 0.6” 29 minutes 3 1/2”/hour 1.0” 4 2”/hour 0.8” 5 3/4”/hour 0.5” 6 1 1/2”/hour 1.5 Converting inches to minutes
  • 64.
    Work Sheet Question1 Zone PR Amount Run Time 1 1 1/2”/hour 0.8” 32 minutes 2 1 1/4”/hour 0.6” 29 minutes 3 1/2”/hour 1.0” 120 minutes 4 2”/hour 0.8” 24 minutes 5 3/4”/hour 0.5” 40 minutes 6 1 1/2”/hour 1.5 36 minutes Converting inches to minutes
  • 65.
    Water-wise irrigation maintenanceUniform type, brand and style of heads in a zone Pop-up heads apply water at 1 to 2 1/2 inches per hour Rotor heads apply water at 1/4 to 3/4 inches per hour
  • 66.
    Work Sheet Question2 Zone PR Amount Run Time 1 1 1/2”/hour 0.8” 32 minutes 2 1 1/4”/hour 0.6” 29 minutes 3 1/2”/hour 1.0” 120 minutes 4 2”/hour 0.8” 24 minutes 5 3/4”/hour 0.5” 40 minutes 6 1 1/2”/hour 1.5 36 minutes Pop-up or Rotor? Pop-ups = 1” to 2 1/2”/hour Rotors = 1/4” to 3/4” /hour
  • 67.
    Work Sheet Question2 Zone PR Amount Run Time 1 1 1/2”/hour 0.8” 32 minutes 2 1 1/4”/hour 0.6” 29 minutes 3 1/2”/hour 1.0” 120 minutes 4 2”/hour 0.8” 24 minutes 5 3/4”/hour 0.5” 40 minutes 6 1 1/2”/hour 1.5 36 minutes Pop-up or Rotor? Pop-ups = 1” to 2 1/2”/hour Rotors = 1/4” to 3/4” /hour
  • 68.
    Step 8 -- Calculate run times for each zone
  • 69.
    Considerations Soak andCycle? Most compacted/clayey soils can’t absorb water as quickly as sprinklers apply it. Typical Front Range clayey soils = 1/4” per hour If applying more than 1/4 inch Multiple short runs an hour apart
  • 70.
    Considerations Watering time?Night/early morning (9 p.m. to 9 a.m.) Reduced evaporation Less wind Many communities experience peak water demand from 4 to 6 a.m
  • 71.
    Considerations Soil waterholding capacity and rooting depth? In typical July weather Lawn goes ___ days on ____ inches (Step 2) Maximum amount for soil water holding capacity and rooting depth is ___ inches Preferred amount? ______________ Irrigation days? _________________
  • 72.
    Step 8 -- Calculate run times for each zone Scheduling methods Observational Historical ET Real-time ET -- fixed day Real-time ET -- fixed amount ET controllers
  • 73.
    Irrigation scheduling Observationalmethod Recommended by many communities to reduce over-watering Manually activate the controller to run cycles
  • 74.
    Irrigation scheduling Observationalmethod Set controller for desired amount of water Manually turn on when lawn show symptoms of water shortage Footprints show in lawn for an hour or more Color change from grassy green to bluish- gray Turn to “off” until next irrigation cycle is needed.
  • 75.
    Work Sheet Question3 Observational Method
  • 76.
    Work Sheet Question3 Example: Apply 0.7 inch per irrigation Zone PR Inches of Water Run Time 1 1 1/4”/hr 0.7” 2 2 1/4”/hr 0.7” 3 3/4”/hr 0.7” 4 1 1/2”/hr 0.7” 5 2”/hr 0.7” 6 1/2”/hr 0.7” Observational Method
  • 77.
    Work Sheet Question3 Example: Apply 0.7 inch per irrigation Zone PR Inches of Water Run Time 1 1 1/4”/hr 0.7” 34 minutes 2 2 1/4”/hr 0.7” 3 3/4”/hr 0.7” 4 1 1/2”/hr 0.7” 5 2”/hr 0.7” 6 1/2”/hr 0.7” Observational Method
  • 78.
    Work Sheet Question3 Example: Apply 0.7 inch per irrigation Zone PR Inches of Water Run Time 1 1 1/4”/hr 0.7” 34 minutes 2 2 1/4”/hr 0.7” 19 minutes 3 3/4”/hr 0.7” 56 minutes 4 1 1/2”/hr 0.7” 28 minutes 5 2”/hr 0.7” 21 minutes 6 1/2”/hr 0.7” 84 minutes Observational Method
  • 79.
    Work Sheet Question3 Example: Apply 0.7 inch per irrigation Zone PR Inches of Water Run Time 1 1 1/4”/hr 0.7” 34 minutes 2 2 1/4”/hr 0.7” 19 minutes 3 3/4”/hr 0.7” 56 minutes 4 1 1/2”/hr 0.7” 28 minutes 5 2”/hr 0.7” 21 minutes 6 1/2”/hr 0.7” 84 minutes Observational Method
  • 80.
    What if raneach zone ran 84 minutes? Example: Apply 0.7 inch per irrigation Zone PR Run Time Amount % 1 1 1/4”/hr 84 minutes 1.8” 250% 2 2 1/4”/hr 84 minutes 3.2” 450% 3 3/4”/hr 84 minutes 1.1” 150% 4 1 1/2”/hr 84 minutes 2.1” 300% 5 2”/hr 84 minutes 2.8” 400% 6 1/2”/hr 84 minutes 0.3” 100%
  • 81.
    Irrigation scheduling HistoricalET Method Water use* April May June July Aug. Sept. Oct. Per week 0.9” 1.1” 1.4” 1.5” 1.2” 0.9” 0.6” Per day 0.13” 0.16” 0.20” 0.21” 0.18” 0.13” 0.09” % July 60% 73% 93% 100% 87% 60% 40% *Northern Colorado Front Range area for cool season turf
  • 82.
    Work Sheet Question4 Historical ET
  • 83.
    Work sheet Question4 Historical ET April May June July Aug. Sept. Oct. Water use per week 0.9” 1.1” 1.4” 1.5” 1.2” 0.9” 0.6 ”
  • 84.
    Historical ET AprilMay June July Aug. Sept. Oct. Water use per week 0.9” 1.1” 1.4” 1.5” 1.2” 0.9” 0.6 ” Watering days Once a week (on Saturdays) Work Sheet Question 4
  • 85.
    Historical ET AprilMay June July Aug. Sept. Oct. Water use per week 0.9” 1.1” 1.4” 1.5” 1.2” 0.9” 0.6 ” Watering days Once a week (on Saturdays) 0.9” Work Sheet Question 4
  • 86.
    Historical ET AprilMay June July Aug. Sept. Oct. Water use per week 0.9” 1.1” 1.4” 1.5” 1.2” 0.9” 0.6 ” Watering days Once a week (on Saturdays) 0.9” 1.1” 1.4” 1.5” 1.2” 0.9” 0.6 ” Work Sheet Question 4
  • 87.
    Work Sheet Question4 Historical ET April May June July Aug. Sept. Oct. Water use per week 0.9” 1.1” 1.4” 1.5” 1.2” 0.9” 0.6 ” Watering days Once a week (on Saturdays) 0.9” 1.1” 1.4” 1.5” 1.2” 0.9” 0.6 ” Zone 1 Precipitation rate = 1.5”/hr Run time (minutes)
  • 88.
    Work Sheet Question4 Historical ET April May June July Aug. Sept. Oct. Water use per week 0.9” 1.1” 1.4” 1.5” 1.2” 0.9” 0.6 ” Watering days Once a week (on Saturdays) 0.9” 1.1” 1.4” 1.5” 1.2” 0.9” 0.6 ” Zone 1 Precipitation rate = 1.5”/hr Run time (minutes) 36
  • 89.
    Work Sheet Question4 Historical ET April May June July Aug. Sept. Oct. Water use per week 0.9” 1.1” 1.4” 1.5” 1.2” 0.9” 0.6 ” Watering days Once a week (on Saturdays) 0.9” 1.1” 1.4” 1.5” 1.2” 0.9” 0.6 ” Zone 1 Precipitation rate = 1.5”/hr Run time (minutes) 36 44 56 60 48 36 24
  • 90.
    Historical ET AprilMay June July Aug. Sept. Oct. Water use per week .9” 1.1” 1.4” 1.5” 1.2” 0.9” 0.6 ” Watering days Twice a week (Thursdays and Saturdays) Zone 1 Precipitation rate = 1.5”/hr Run time (minutes) Work Sheet Question 5
  • 91.
    Work Sheet Question5 Historical ET April May June July Aug. Sept. Oct. Water use per week .9” 1.1” 1.4” 1.5” 1.2” 0.9” 0.6 ” Watering days Twice a week (Thursdays and Saturdays) 0.45” Zone 1 Precipitation rate = 1.5”/hr Run time (minutes) 18
  • 92.
    Historical ET AprilMay June July Aug. Sept. Oct. Water use per week .9” 1.1” 1.4” 1.5” 1.2” 0.9” 0.6 ” Watering days Twice a week (Thursdays and Saturdays) 0.45” 0.55” 0.7” 0.75” 0.6” 0.45” 0.3” Zone 1 Precipitation rate = 1.5”/hr Run time (minutes) 18 22 28 30 24 18 12 Work Sheet Question 5
  • 93.
    Do you wateronce or twice a week? Soil water holding capacity and rooting depth To estimate for the site maximum number of days between X 0.20”/day = Maximum amount irrigations in July per irrigation (inches)
  • 94.
    Do you wateronce or twice a week? Soil water holding capacity and rooting depth To estimate for the site maximum number of days between X 0.20”/day = Maximum amount irrigations in July per irrigation (inches) Typical daily water use in July
  • 95.
    Do you wateronce or twice a week? Soil water holding capacity and rooting depth To estimate for the site maximum number of days between X 0.20”/day = Maximum amount irrigations in July per irrigation (inches) 5 days maximum X 0.20”/day = 1” maximum to apply
  • 96.
    Historical ET AprilMay June July Aug. Sept. Oct. If 1” is maximum amount to apply per irrigation, circle irrigation schedule for the week . Watering days Once a week (Saturdays) .9” 1.1” 1.4” 1.5” 1.2” 0.9” 0.6” Twice a week (Thursdays and Saturdays) 0.45” 0.55” 0.7” 0.75” 0.6” 0.45” 0.3” Work Sheet Question 6
  • 97.
    Work Sheet Question6 Historical ET April May June July Aug. Sept. Oct. If 1” is maximum amount to apply per irrigation, circle irrigation schedule for the week . Watering days Once a week (Saturdays) .9” 1.1” 1.4” 1.5” 1.2” 0.9” 0.6” Twice a week (Thursdays and Saturdays) 0.45” 0.55” 0.70” 0.75” 0.65” 0.45” 0.3”
  • 98.
    Work Sheet Question6 Historical ET April May June July Aug. Sept. Oct. If 1” is maximum amount to apply per irrigation, circle irrigation schedule for the week . Watering days Once a week (Saturdays) .9” 1.1” 1.4” 1.5” 1.2” 0.9” 0.6” Twice a week (Thursdays and Saturdays) 0.45” 0.55” 0.70” 0.75” 0.60” 0.45” 0.3”
  • 99.
    Work Sheet Question7 Historical ET -- Soak & Cycle April May June July Aug. Sept. Oct. Water use per week 0.9” 1.1” 1.4” 1.5” 1.2” 0.9” 0.6 ” Watering days Twice a week (Thursdays and Saturdays) 0.45” 0.55” 0.7” 0.75” 0.6” 0.45” 0.3”
  • 100.
    Work Sheet Question7 Historical ET -- Soak & Cycle April May June July Aug. Sept. Oct. Watering days -- Twice a week 0.45” 0.55” 0.7” 0.75” 0.6” 0.45” 0.3” Total run time Number of cycles (~1/4”/cycle) Run time per cycle
  • 101.
    Work Sheet Question7 Historical ET -- Soak & Cycle April May June July Aug. Sept. Oct. Watering days -- Twice a week 0.45” 0.55” 0.7” 0.75” 0.6” 0.45” 0.3” Total run time 14 Number of cycles (~1/4”/cycle) 2 Run time per cycle 7
  • 102.
    Work Sheet Question7 Historical ET -- Soak & Cycle April May June July Aug. Sept. Oct. Watering days -- Twice a week 0.45” 0.55” 0.70” 0.75” 0.6” 0.45” 0.30” Total run time 14 17 21 23 18 14 9 Number of cycles (~1/4”/cycle) 2 2 3 3 2 2 1 Run time per cycle 7 9 7 8 9 7 9
  • 103.
    Work Sheet Question8 Historical ET -- Fixed Amount Apply 1” per irrigation April May June July Aug. Sept. Oct. Water use per week 0.9” 1.1” 1.4” 1.5” 1.2” 0.9” 0.6 ” Water use per day 0.13” 0.16” 0.20” 0.21” 0.18” 0.13” 0.09”
  • 104.
    Historical ET --Fixed Amount April May June July Aug. Sept. Oct. Water use per day 0.13” 0.16” 0.20” 0.21” 0.18” 0.12” 0.09” Days per 1” of water Inches to apply 1” 1” 1” 1” 1” 1” 1” Run time 80 80 80 80 80 80 80 Work Sheet Question 8
  • 105.
    Historical ET --Fixed Amount April May June July Aug. Sept. Oct. Water use per day 0.13” 0.16” 0.20” 0.21” 0.18” 0.12” 0.09” Days per 1” of water 8 Inches to apply 1” 1” 1” 1” 1” 1” 1” Run time 80 80 80 80 80 80 80 Work Sheet Question 8
  • 106.
    Historical ET --Fixed Amount April May June July Aug. Sept. Oct. Water use per day 0.13” 0.16” 0.20” 0.21” 0.18” 0.12” 0.09” Days per 1” of water 8 6 5 5 6 8 11 Inches to apply 1” 1” 1” 1” 1” 1” 1” Run time 80 80 80 80 80 80 80 Work Sheet Question 8
  • 107.
    Step 8 -- Calculate run times for each zone Scheduling methods Observational Historical ET Real-time ET -- fixed day Real-time ET -- fixed amount ET controllers
  • 108.
    Irrigation schedule Real-timeET -- Fixed Day Method Accommodates fixed watering days or mowing days Recalculate run time for each irrigation
  • 109.
    Irrigation schedule Real-timeET -- Fixed Day Method Watered on Monday and Thursday nights Last watered Thursday night Friday 0.18” ET Saturday 0.21” ET Sunday 0.19” ET Monday 0.16” ET Total 0.74 inches used Minus rain -0.12” Net water to apply 0.62”
  • 110.
    Irrigation schedule Real-timeET -- Fixed Day Method With a precipitation rate of 1.5 inches/hour It takes 24 minutes to apply 0.6 inches
  • 111.
    Irrigation schedule Real-timeET -- Fixed Amount Method Apply a fixed amount per irrigation (don’t have to reset controller with each watering) Activate controller when ET exceeds amount to apply per irrigation
  • 112.
    Irrigation schedule Real-timeET -- Fixed Amount Method Activate controller when ET exceeds amount to apply per irrigation Example: Apply 1/2” per irrigation With a precipitation rate of 1 1 / 4 inches per hours it takes 24 minutes.
  • 113.
    Irrigation schedule Real-timeET -- Fixed Amount Method Balance Carry over 0.07” ET 0.07” Day 1 0.14” ET 0.21” Day 2 0.17” ET 0.38” Day 3 0.15” ET 0.53” Minus rain 0.0” 0.53” Activate irrigation - 0.50 inches 0.03” New carry over 0.03”
  • 114.
    WaterWise Irrigation ManagementET Controllers Coming to home garden trade in few years Some work on historical ET Some work on real-time ET, connecting via phone or satellite to a local weather station data bank (for a small monthly fee).
  • 115.
  • 116.
    Design criteria foruniform delivery Uniformity of water delivery = water savings 3. Fill in with heads in square and triangle patterns. 1. Head- to-head coverage 2. “Line-out”
  • 117.
    If your sprinklersystem doesn’t meet this criteria, consider upgrading the design. Water saving 20% to over 40% Recover costs in 3-15 years Design criteria for uniform delivery Uniformity of water delivery = water savings
  • 118.
    WaterWise Irrigation ManagementSummary Zoning Design Maintenance Management Water saving potential? 20% 40% 70%
  • 119.