Download as PDF, PPTX


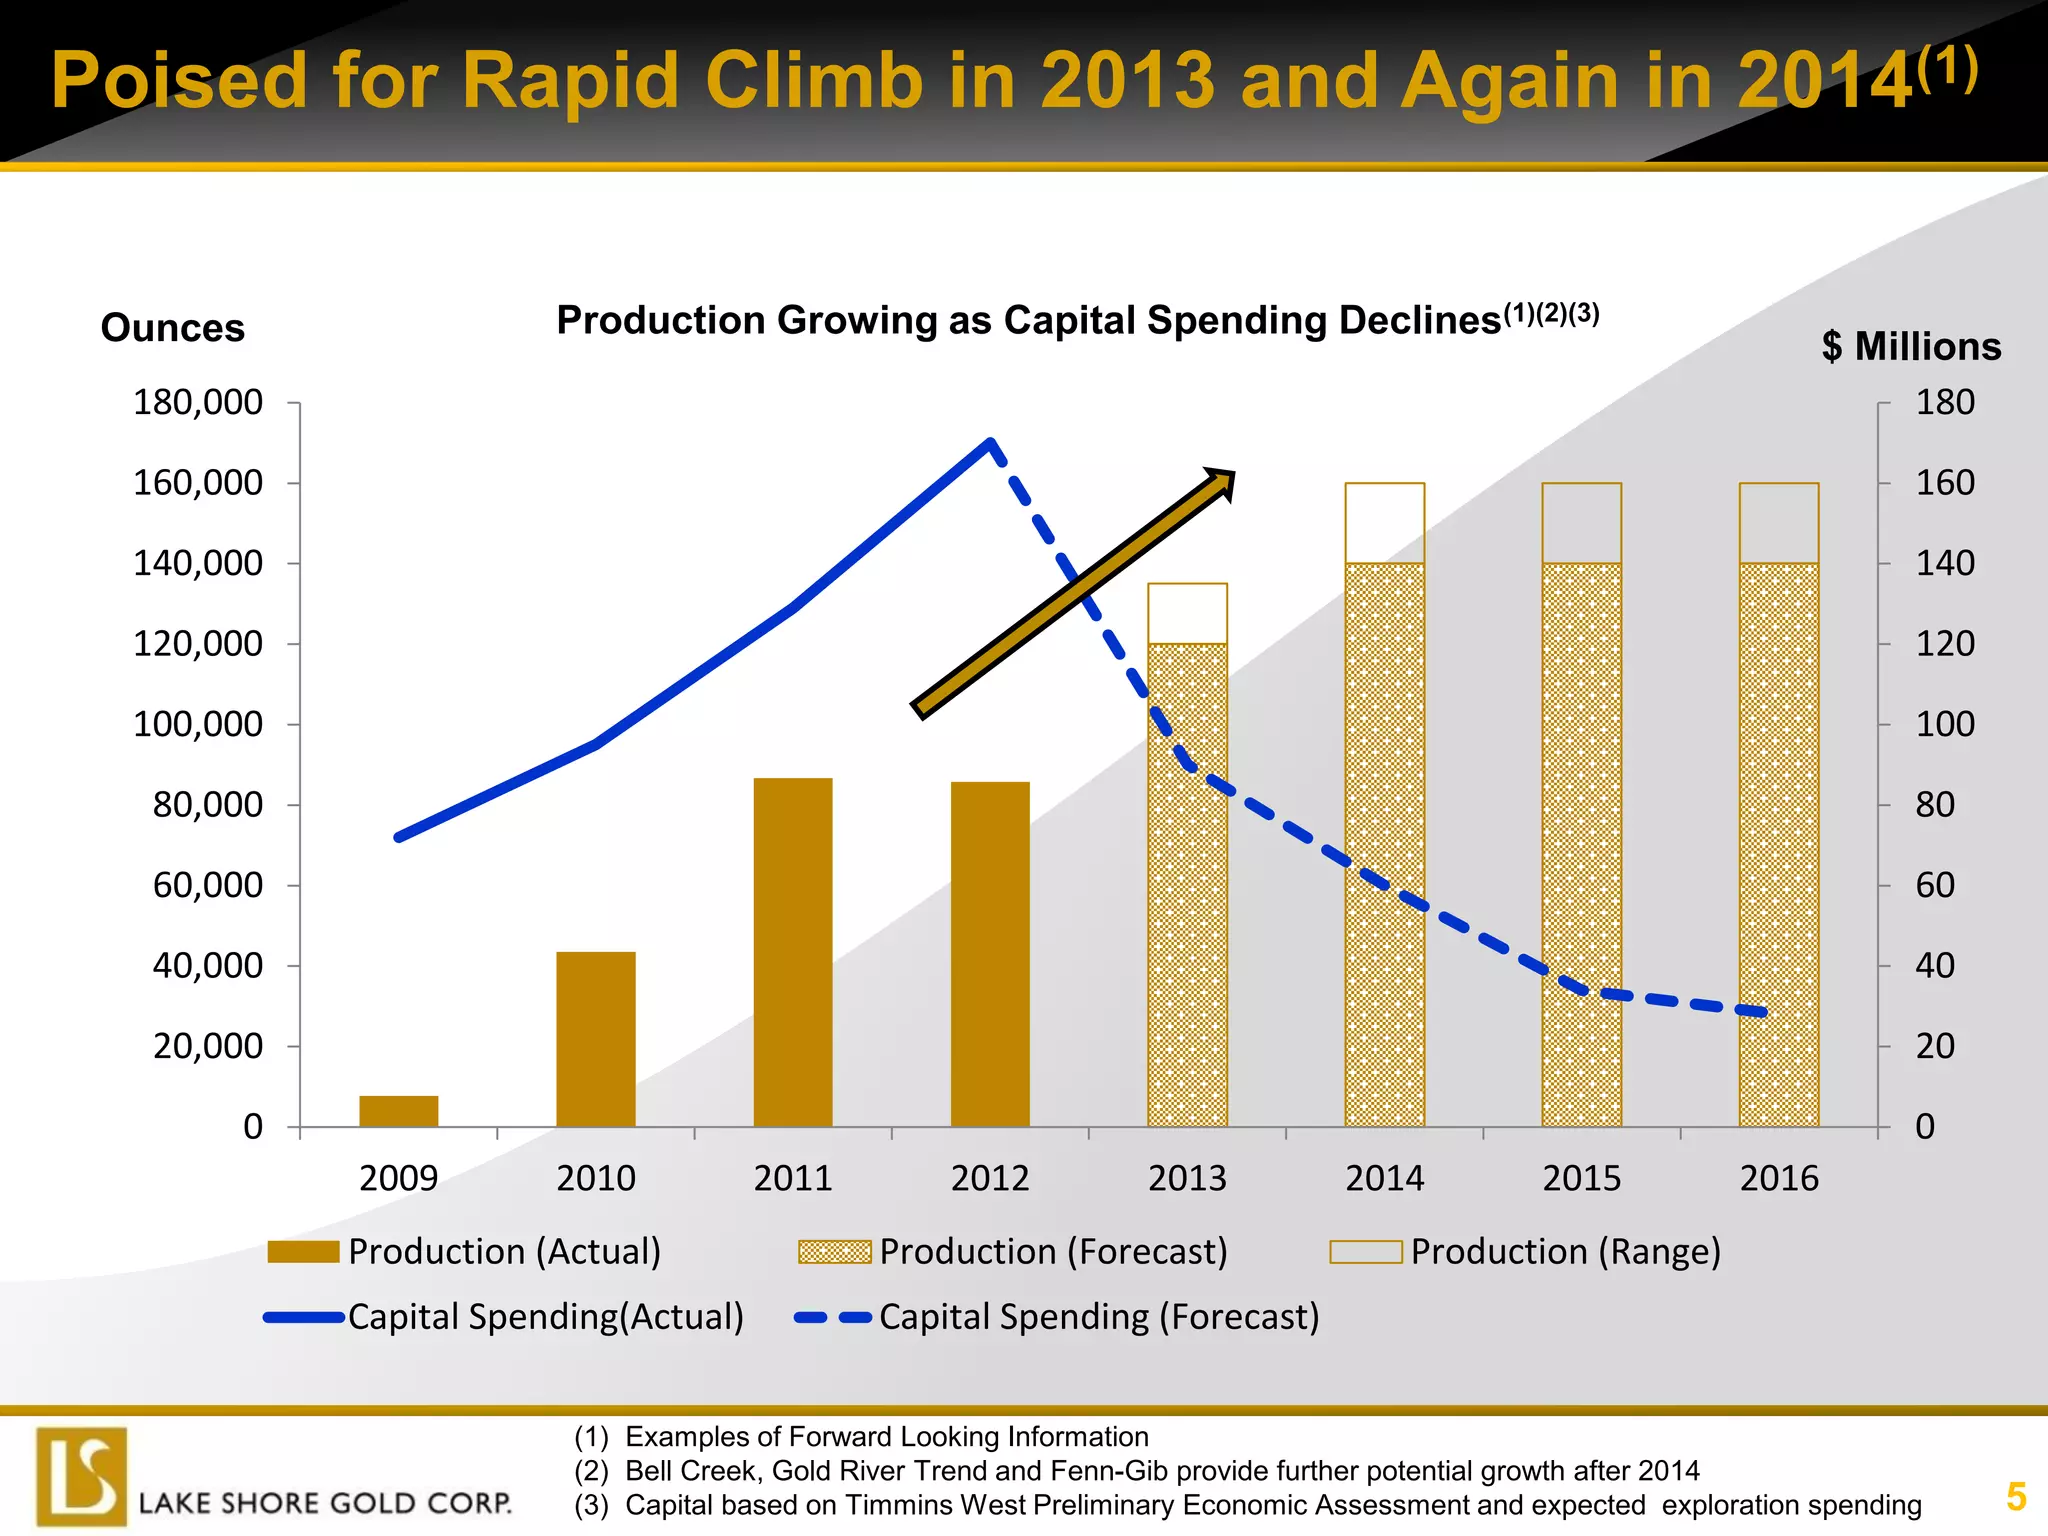
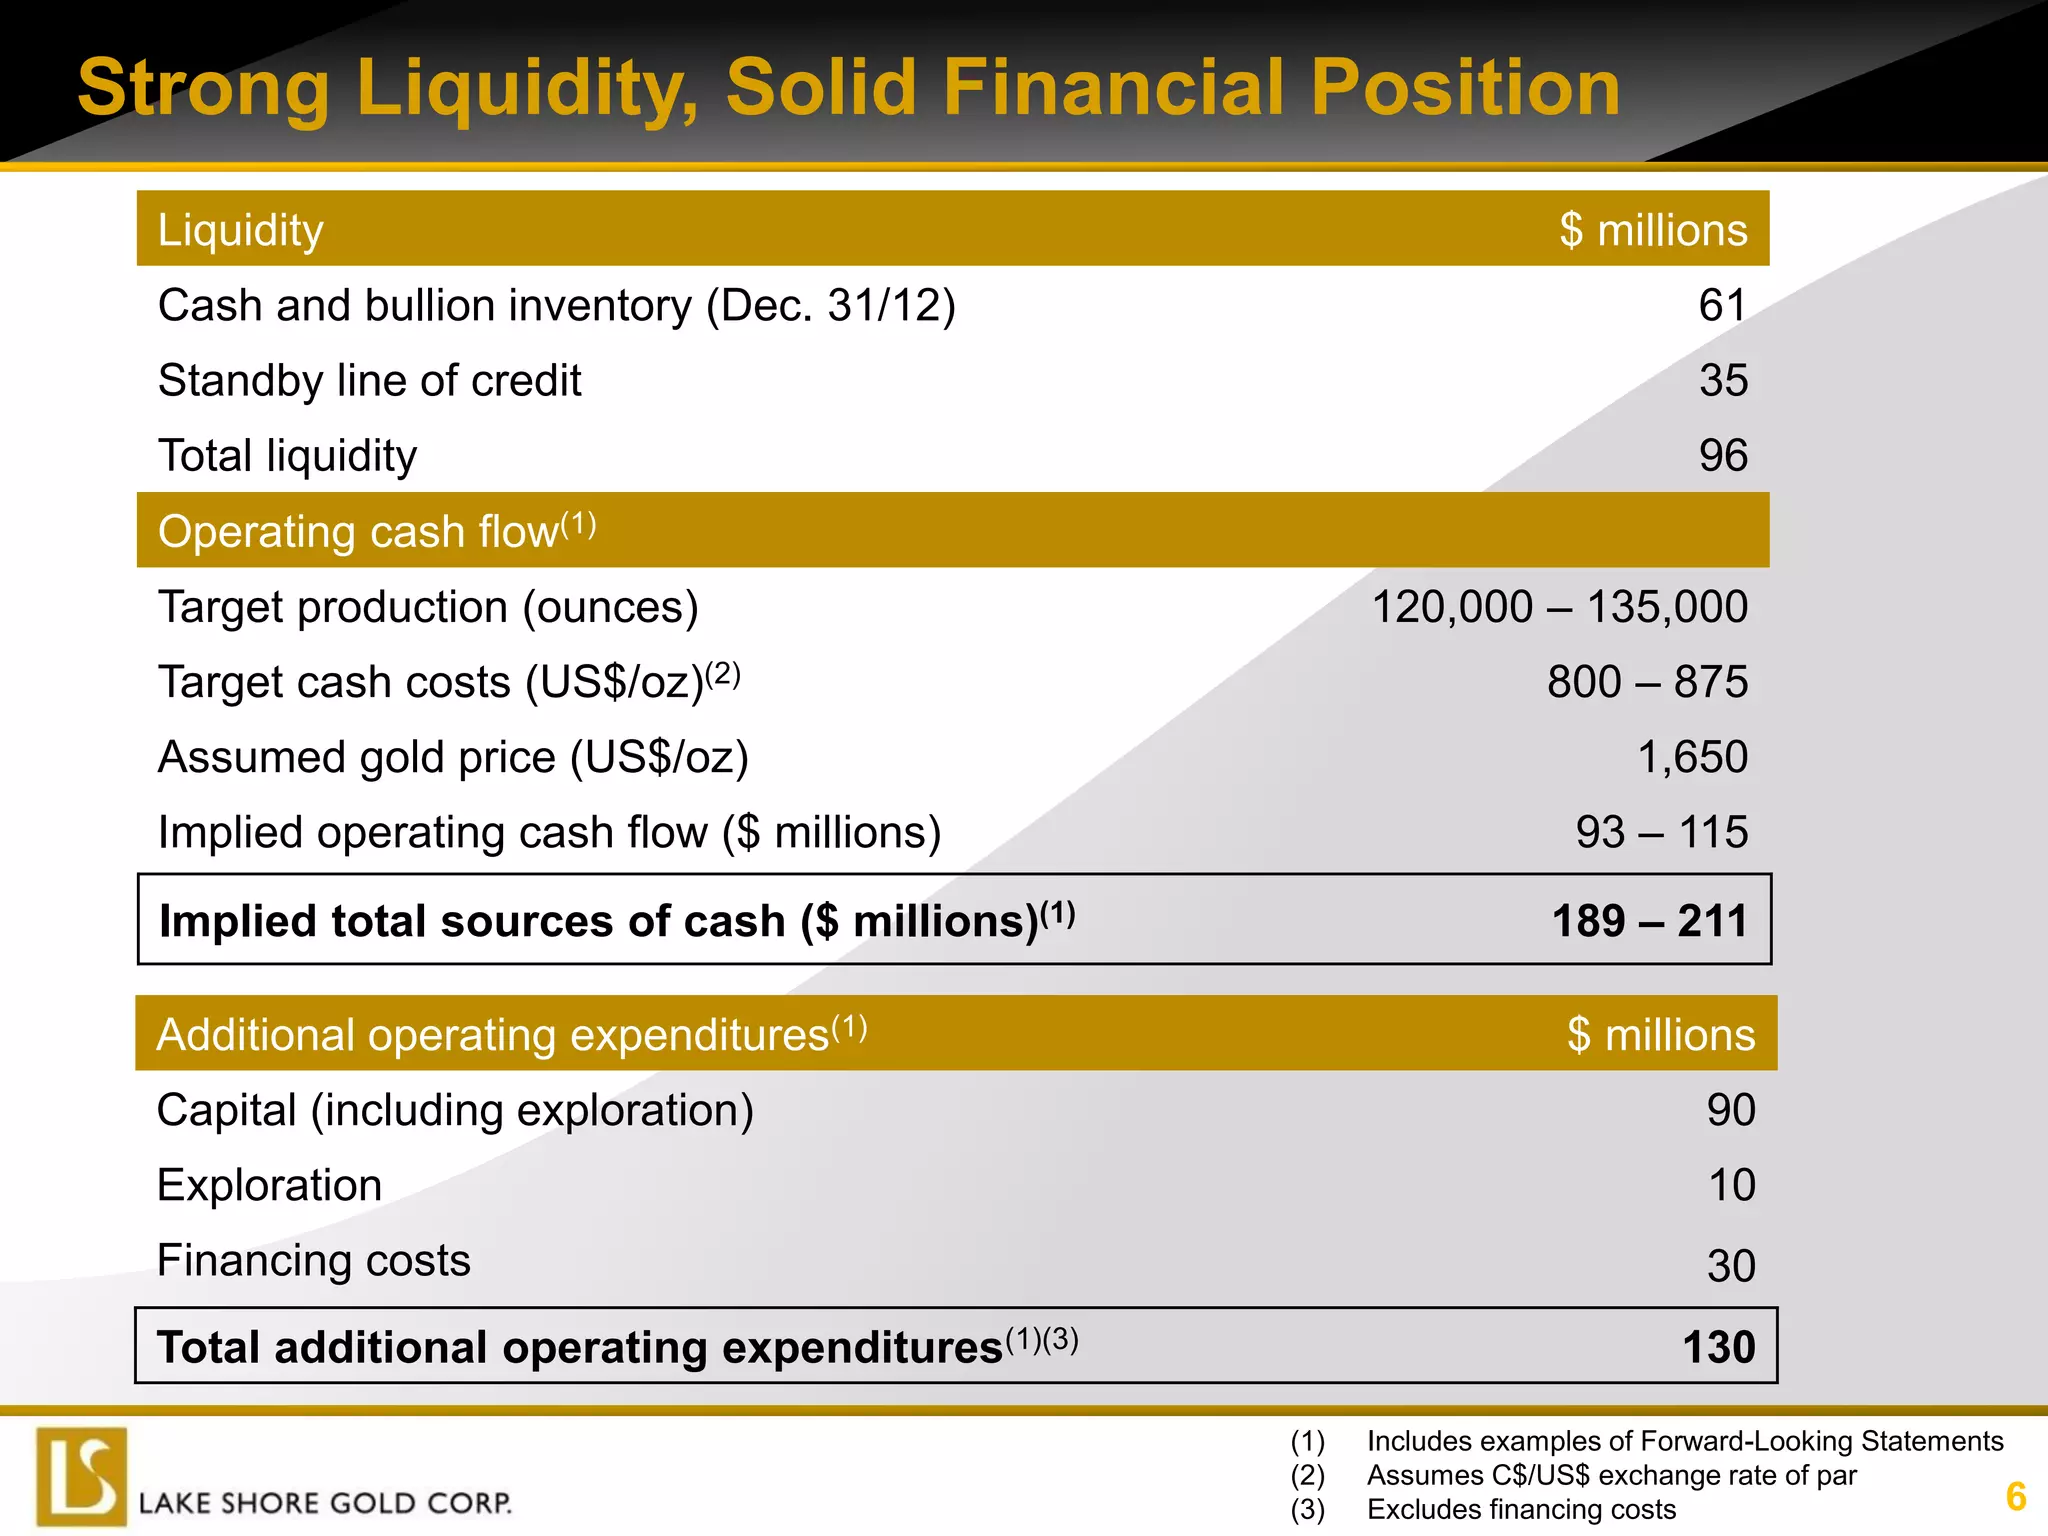
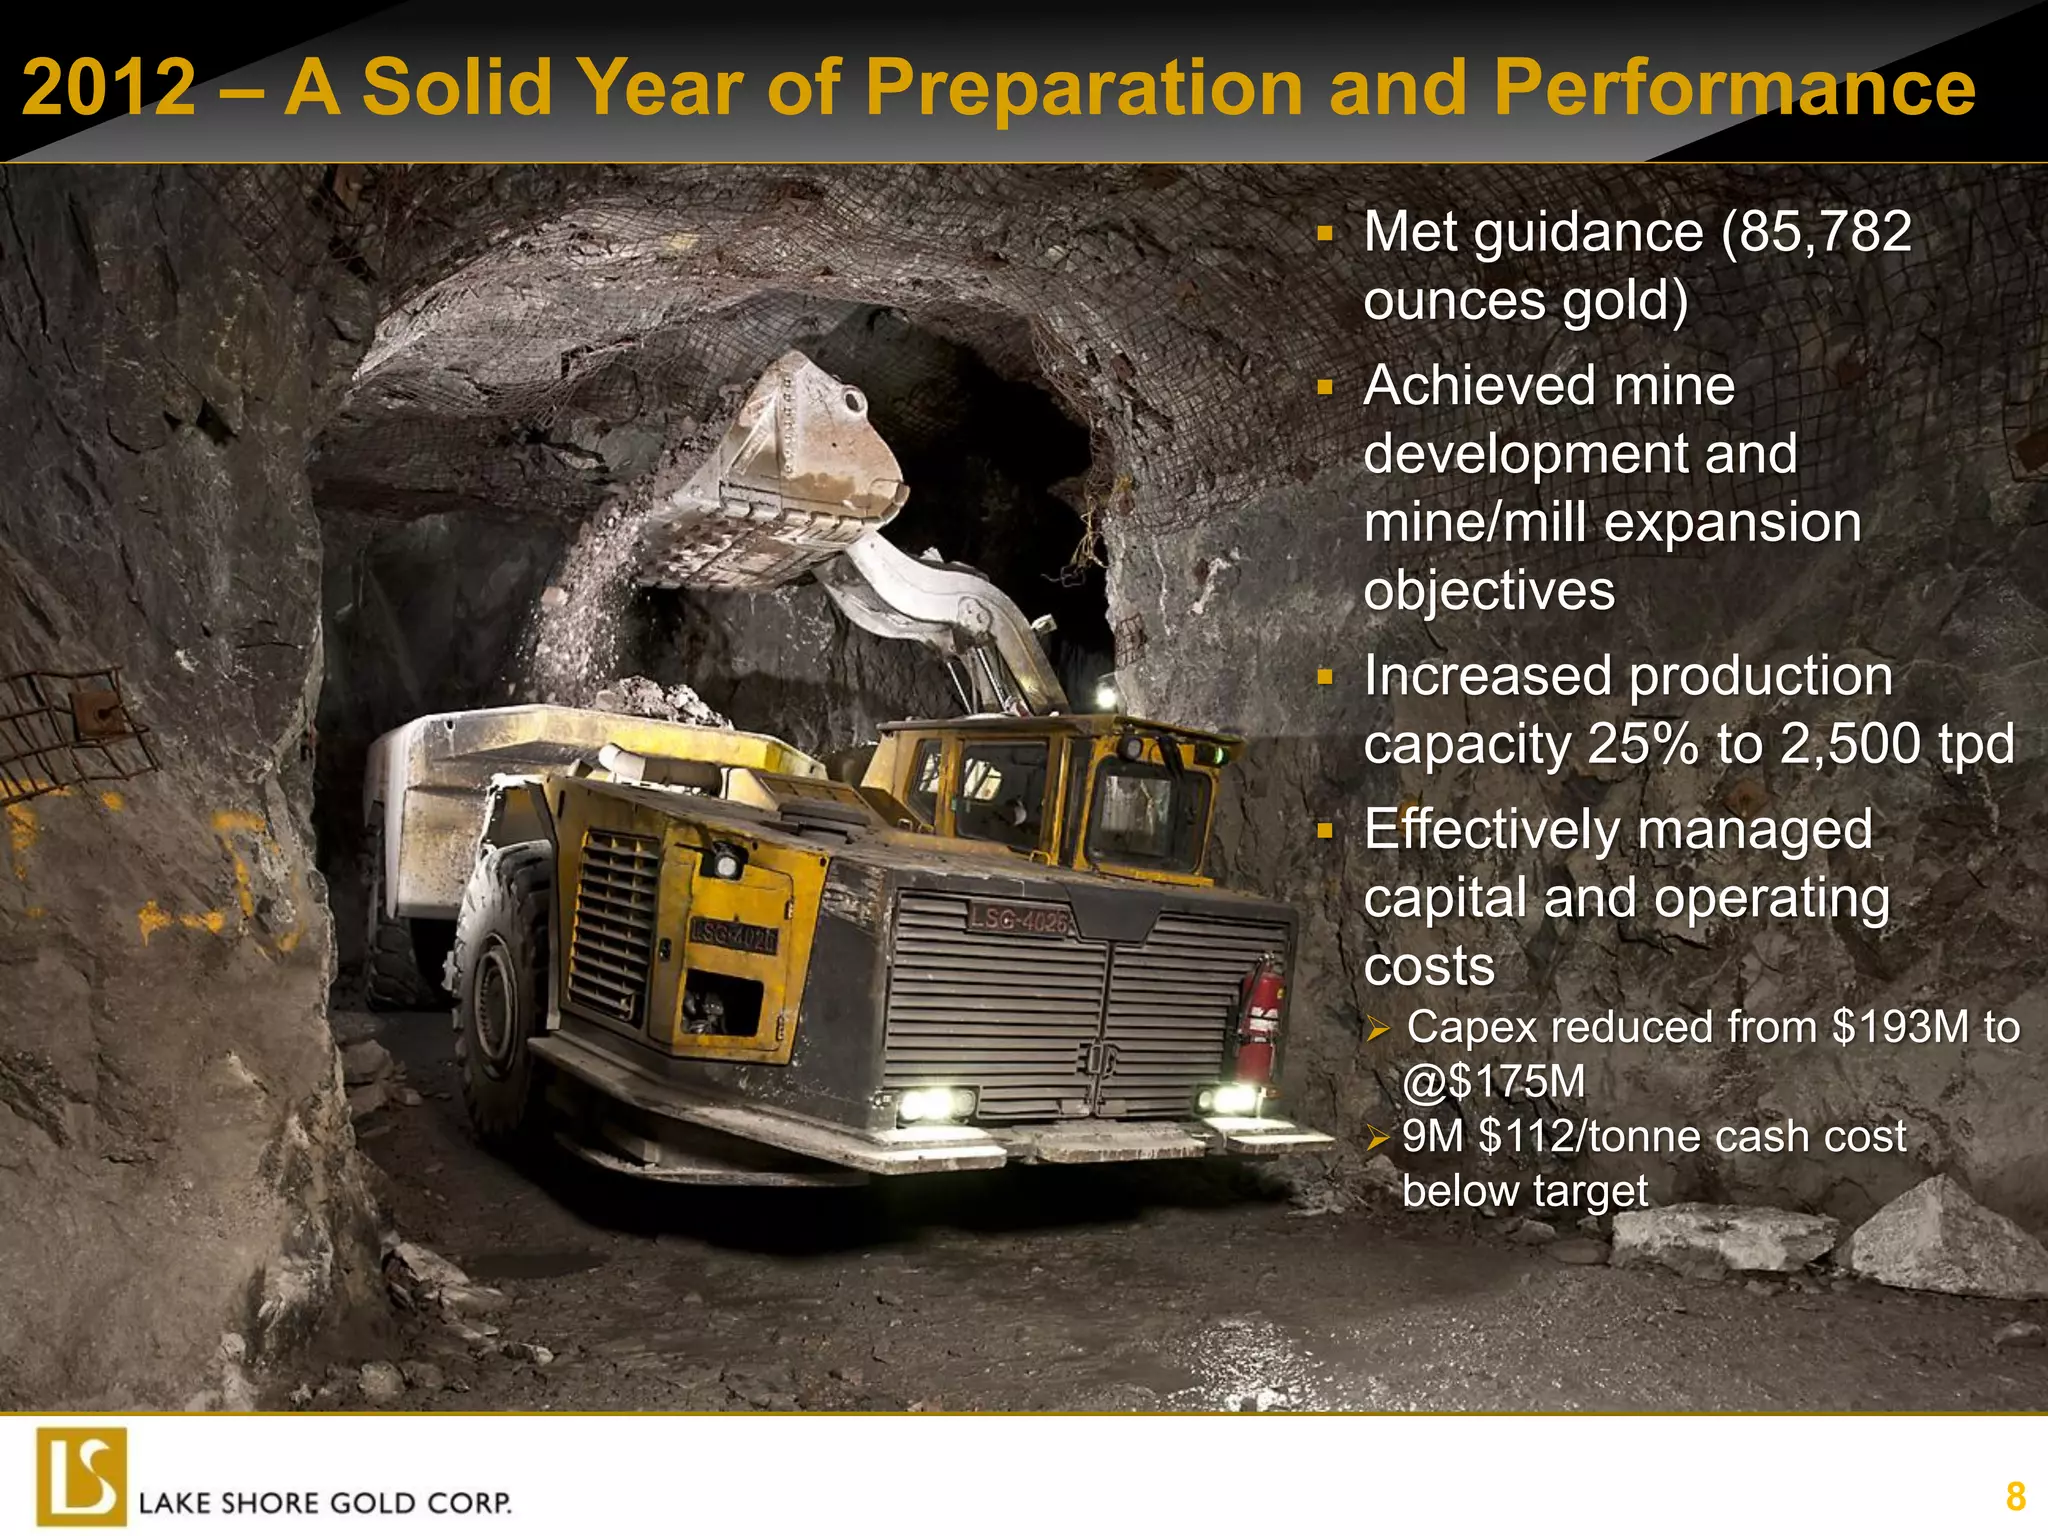
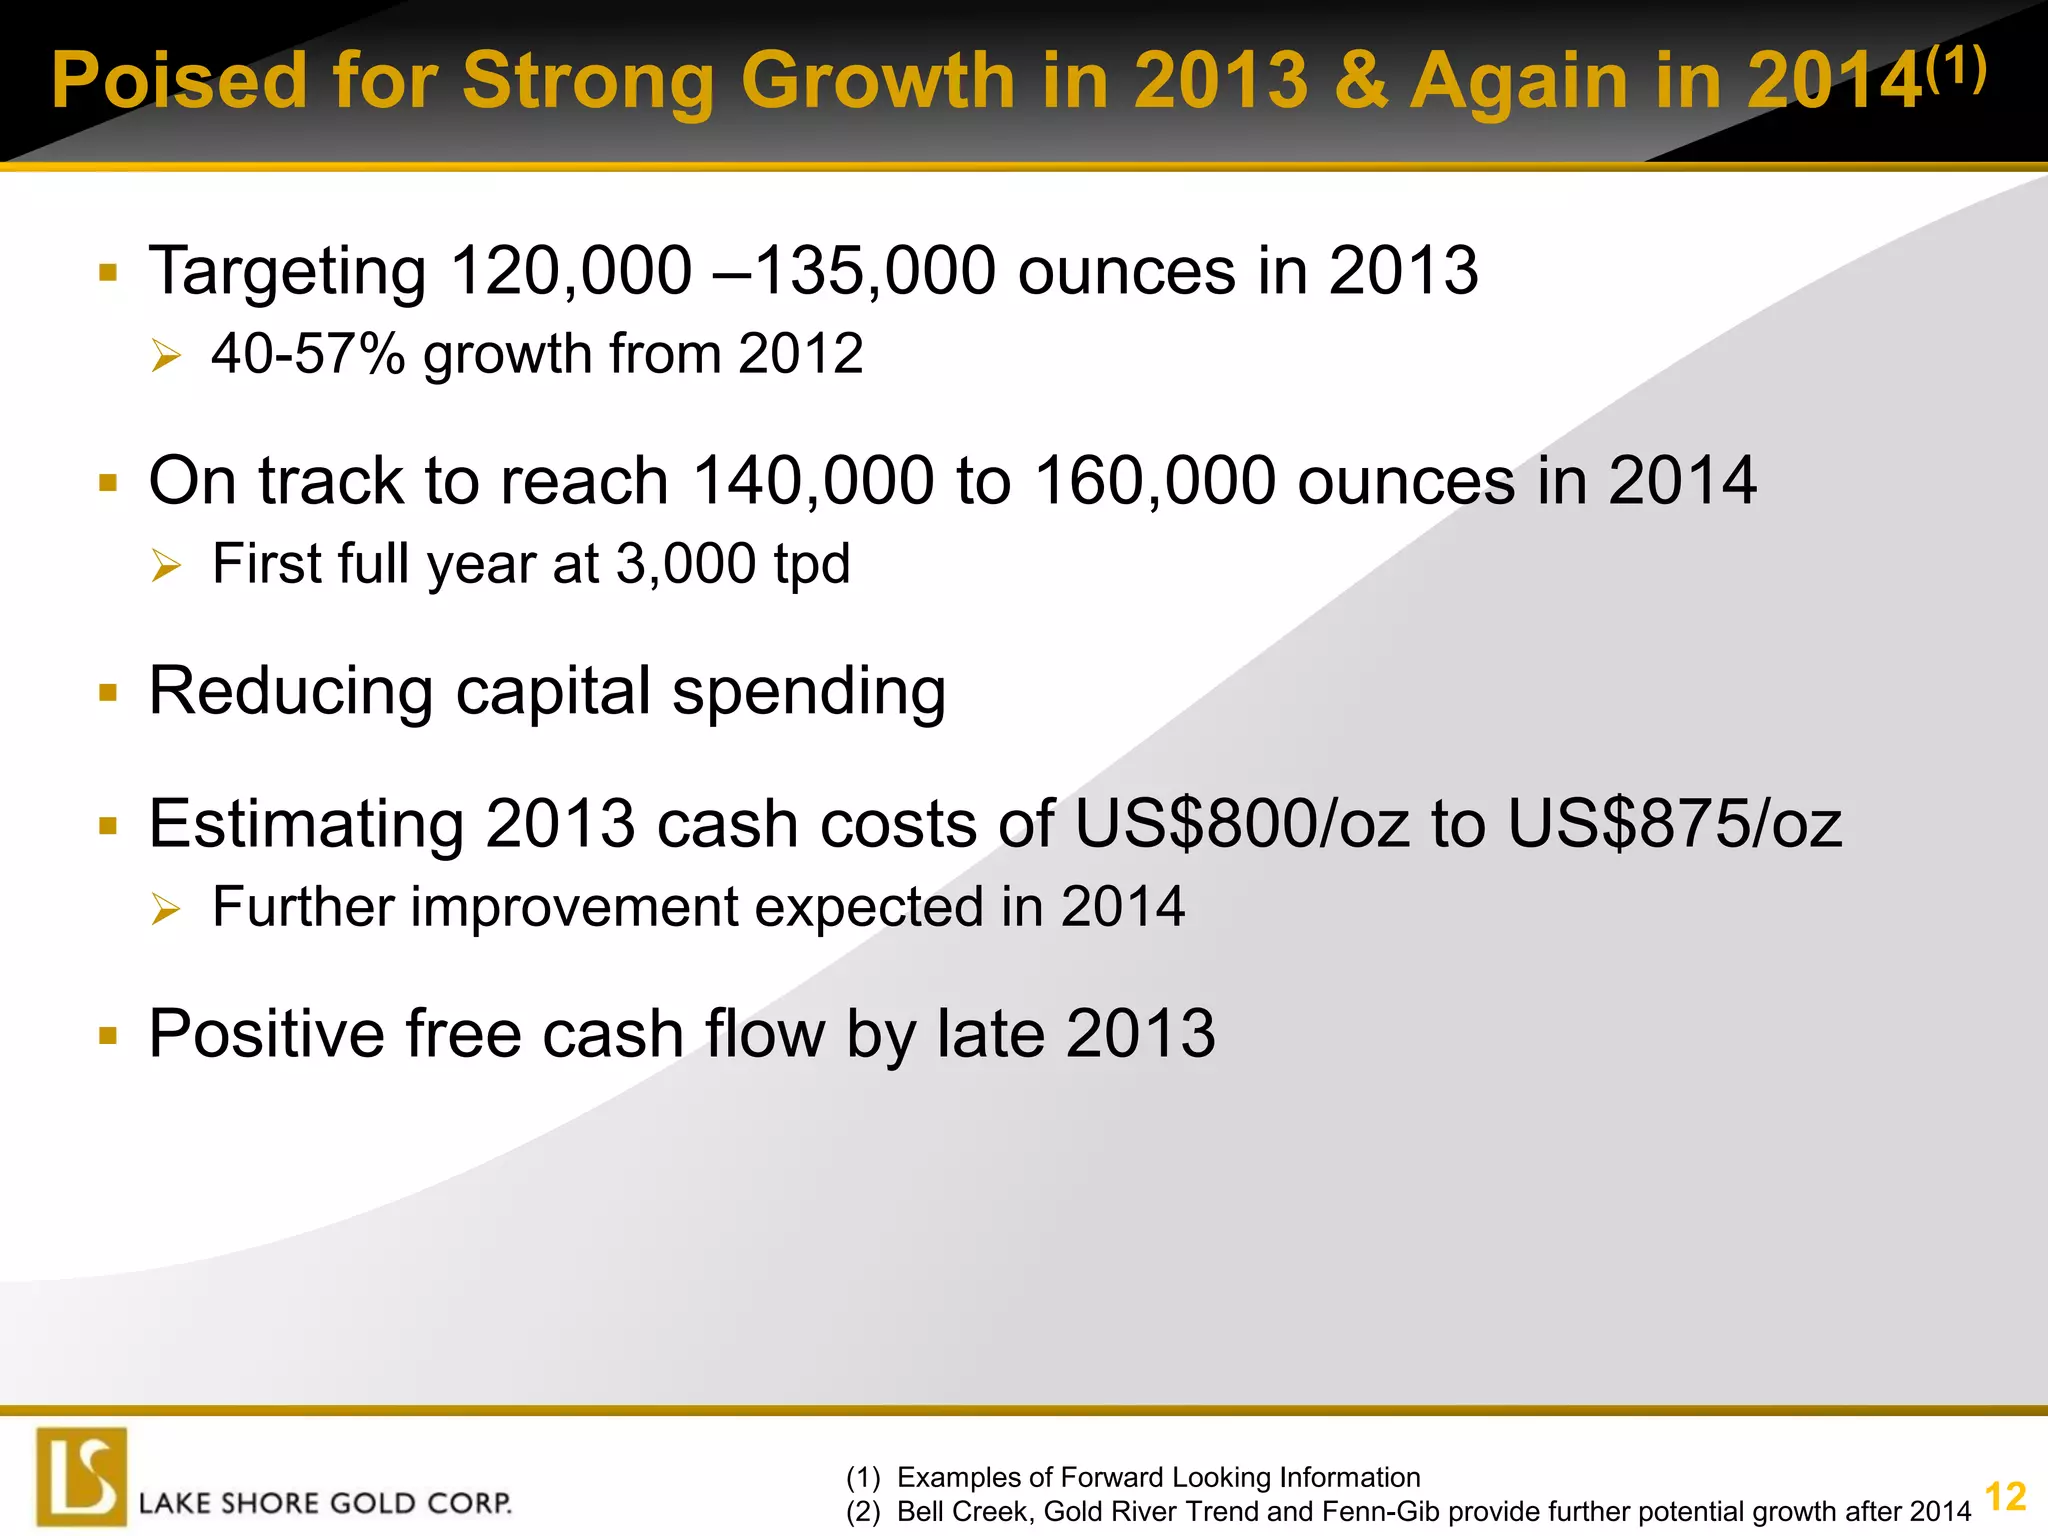
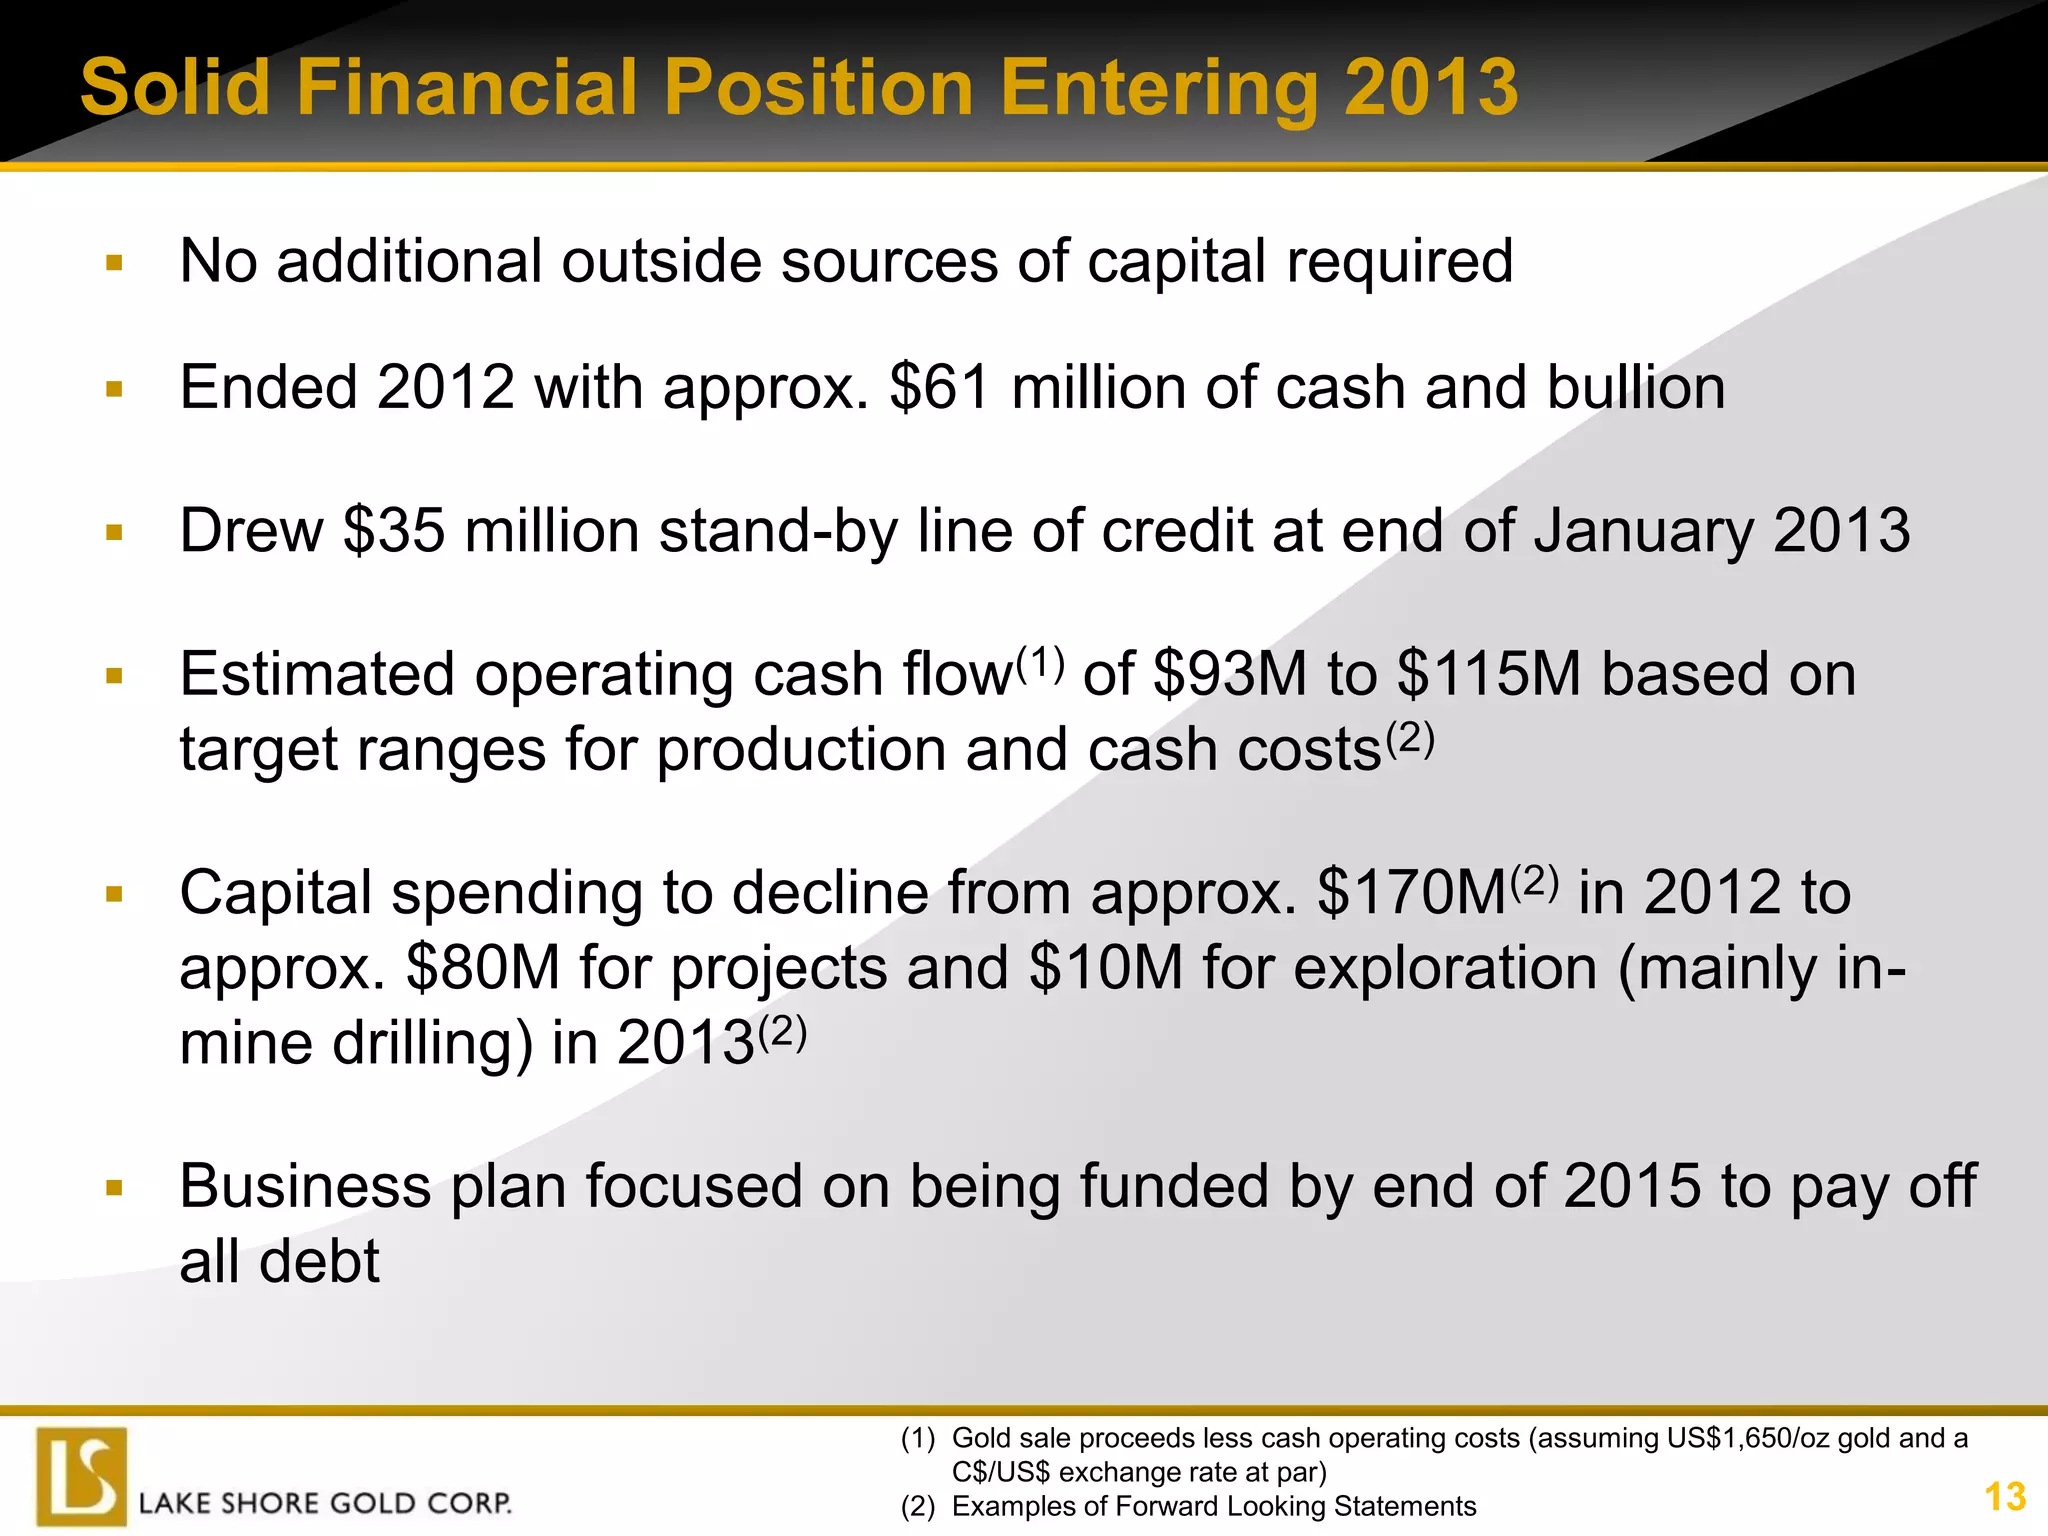
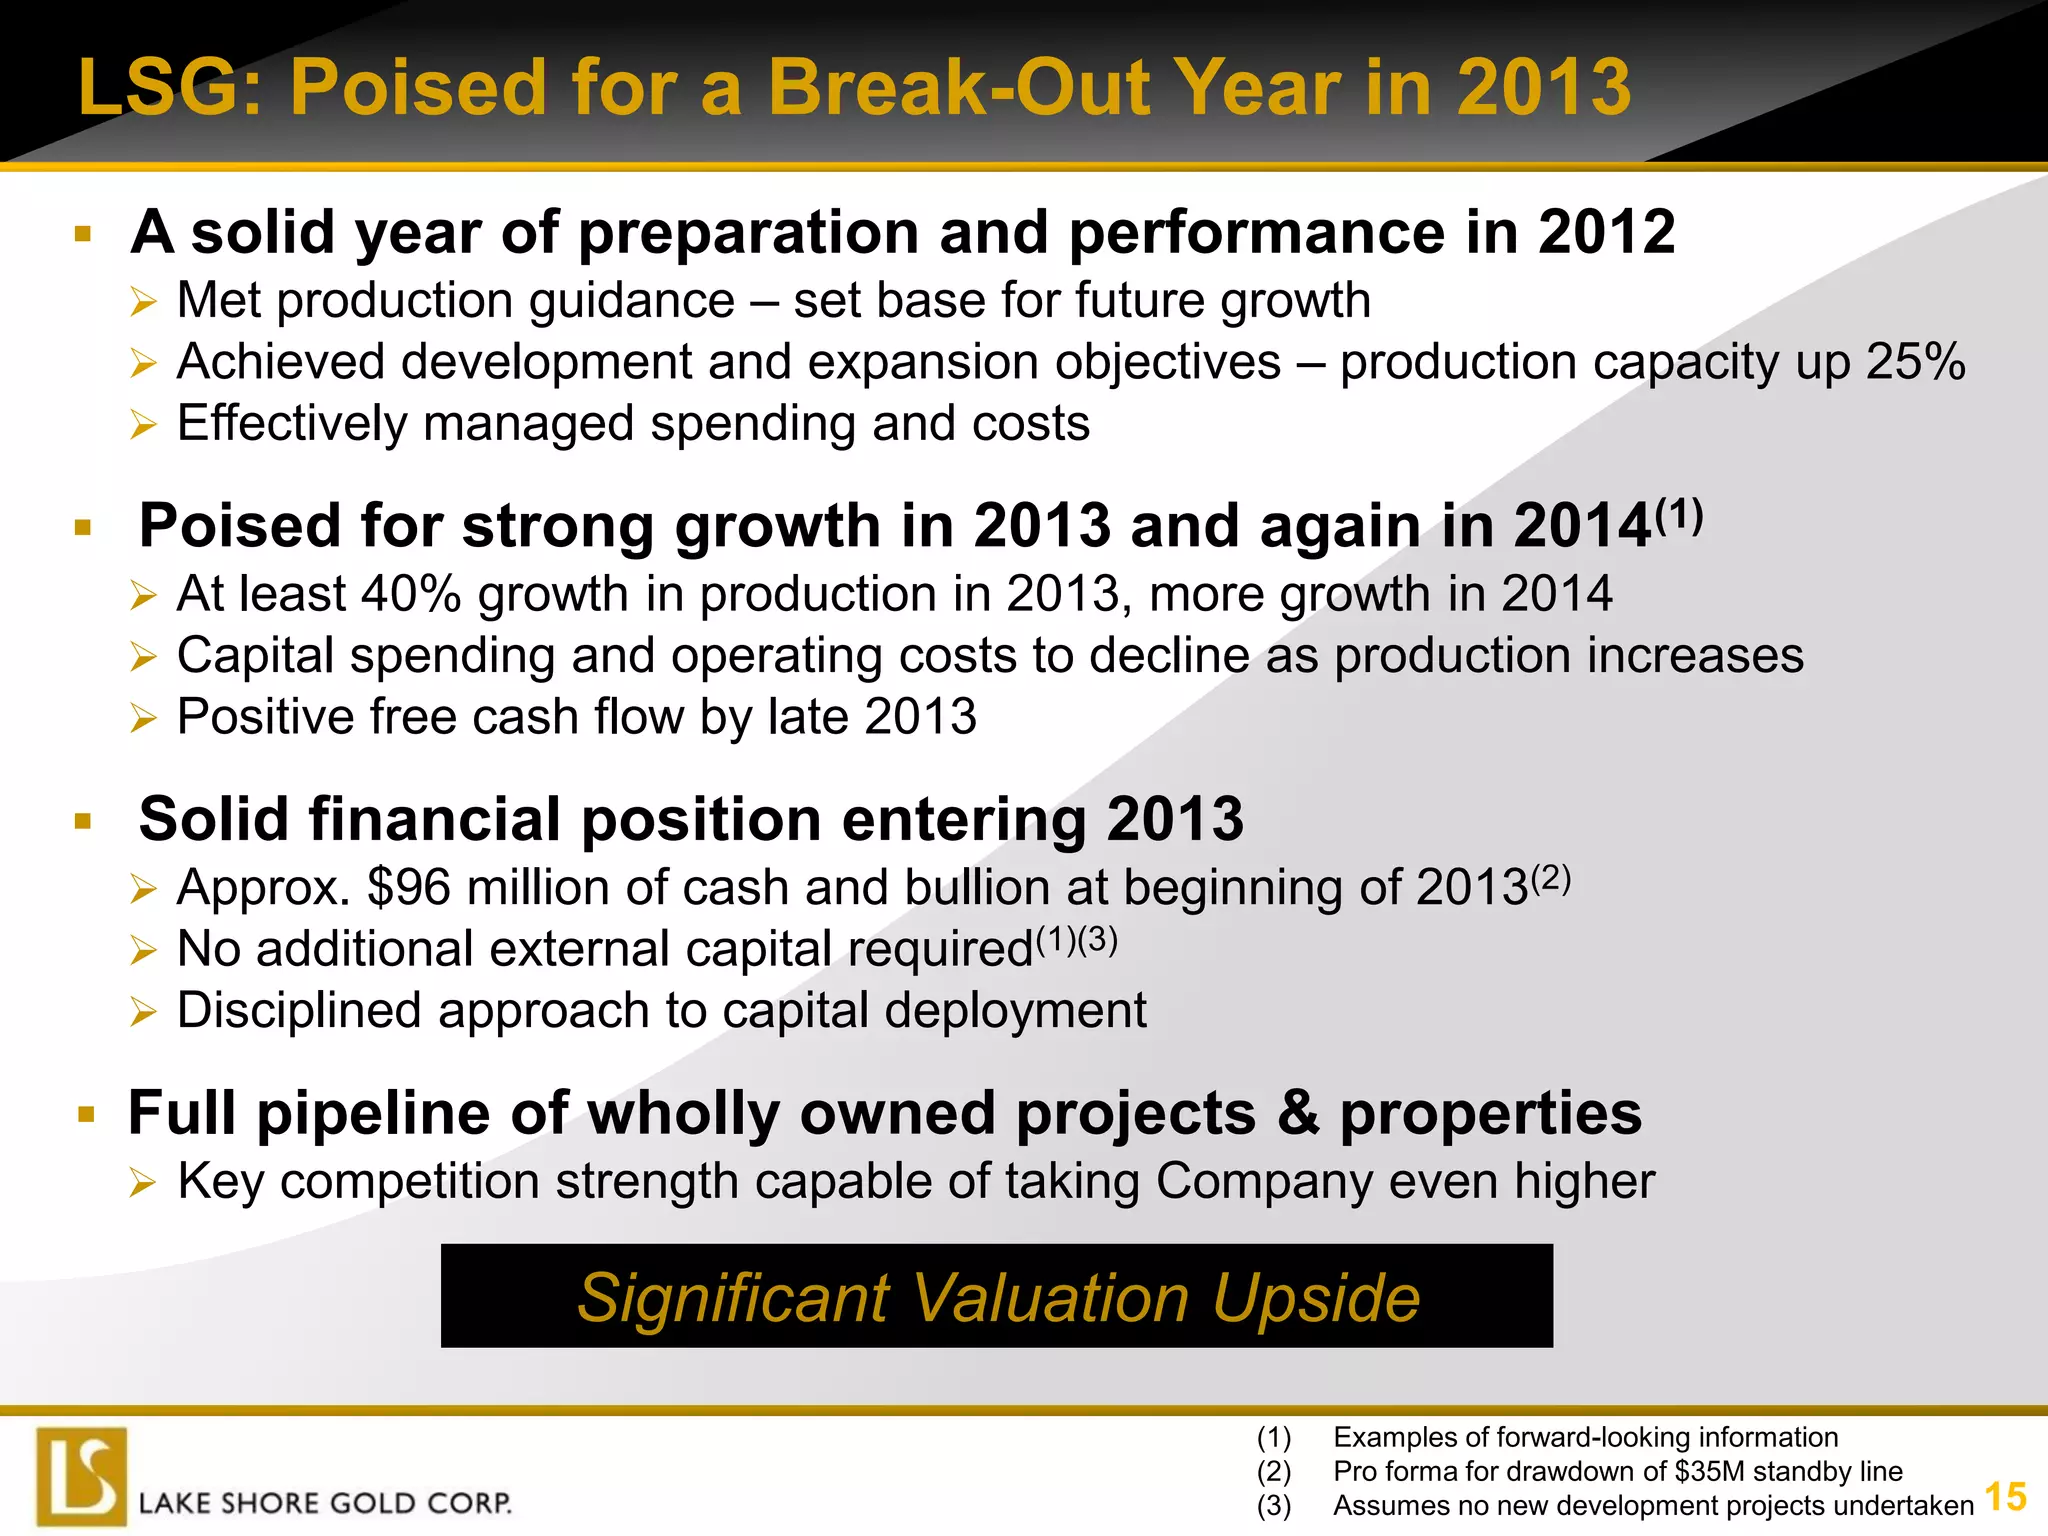


Lake Shore Gold Corp. is poised for strong growth in 2013 and 2014. In 2012, the company met production guidance of 85,782 ounces of gold and achieved development objectives that increased production capacity by 25%. For 2013, Lake Shore Gold expects at least 40% production growth over 2012, with production costs declining as output increases. It also anticipates generating positive free cash flow by late 2013. With nearly $96 million in cash and bullion to start 2013, no additional external capital is required. Lake Shore Gold's portfolio of gold projects provides potential for further expansion beyond 2014.


