Downloaded 1,141 times


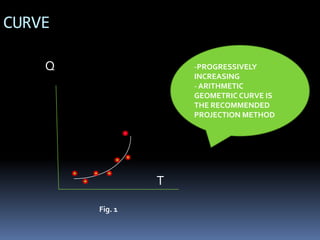
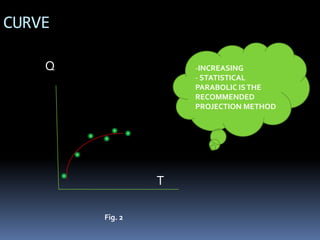
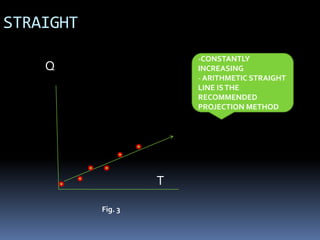
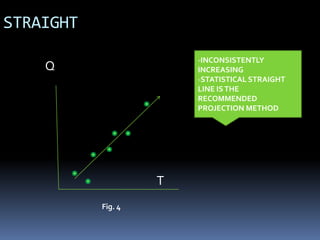
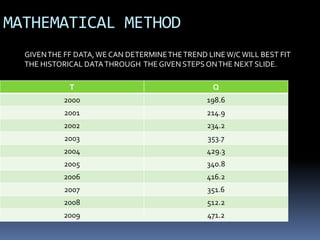
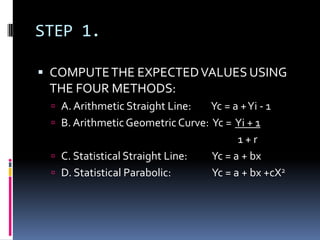
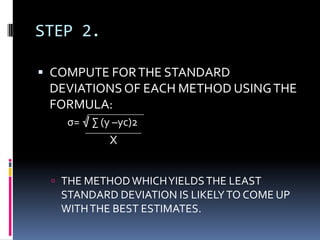

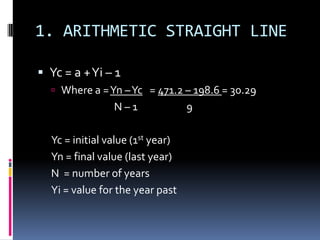
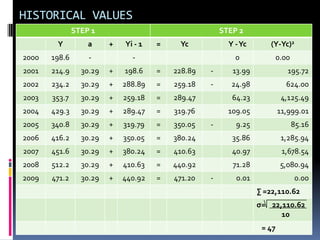
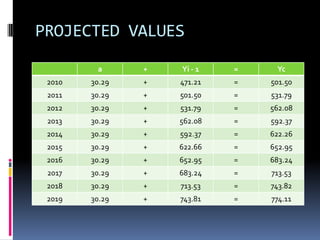
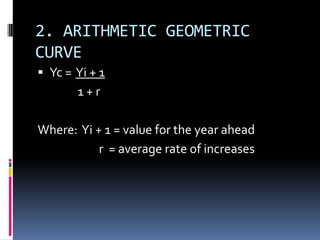

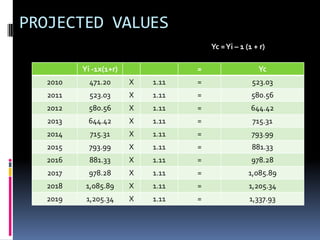
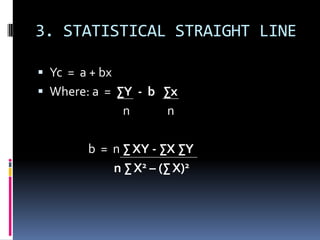
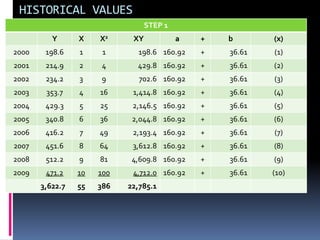
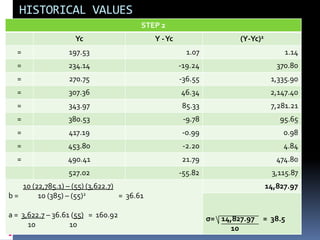
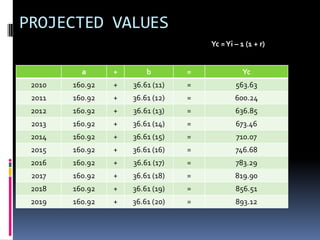
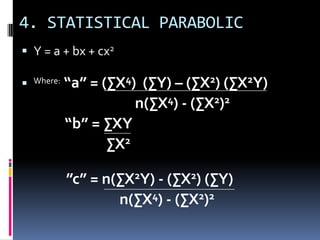
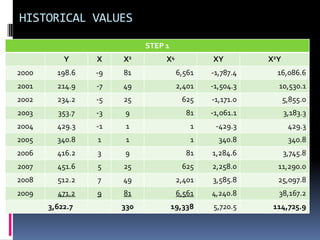
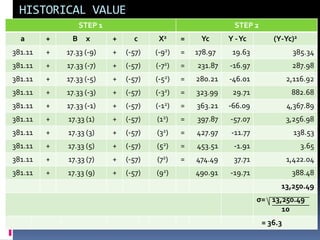
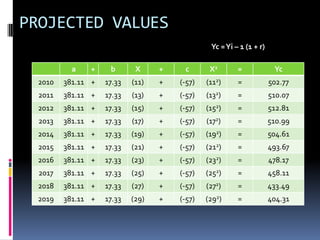
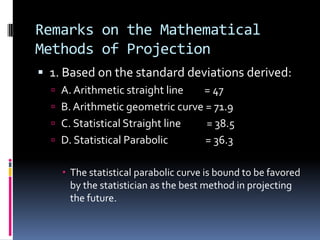


The document discusses four common methods used to project market values: the arithmetic straight line method, arithmetic geometric curve, statistical straight line, and statistical parabolic curve. It explains that each method yields different projected figures and trends when using the same historical data. The best method is determined by either visually plotting the historical data to see the trend line shape, or through mathematical computations to find the method with the smallest standard deviation between actual and projected values. Examples of applying each method to a sample data set are provided.