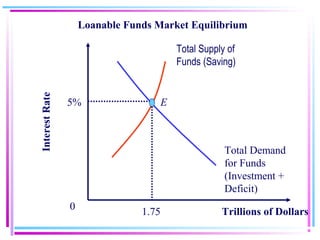
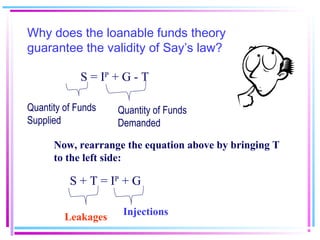
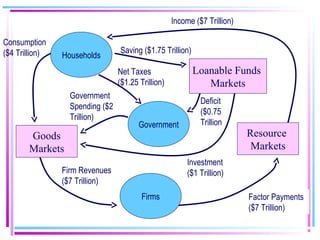
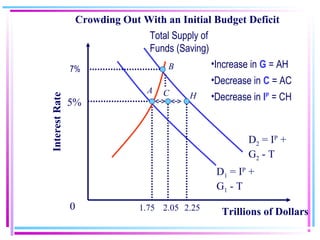
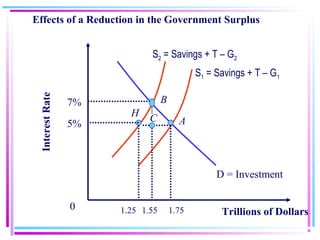
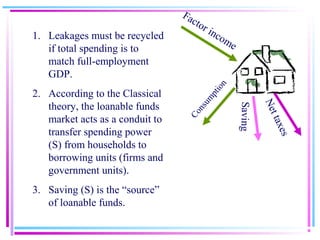
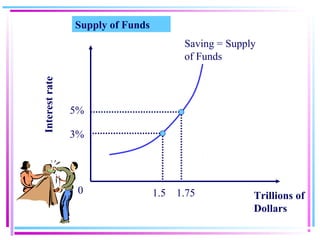
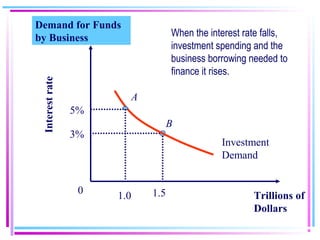
The document summarizes the Loanable Funds theory, which describes how household savings are made available to borrowers through financial institutions and markets. According to the theory, savings are the source of loanable funds that are supplied to the loanable funds market. Demand for loanable funds comes from borrowing by firms, individuals, and the government. When the supply and demand for loanable funds is in equilibrium, it guarantees that total spending in the economy will match total income, according to Say's Law. The interest rate adjusts to clear the loanable funds market.


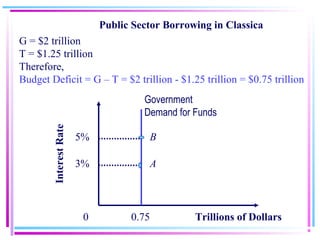
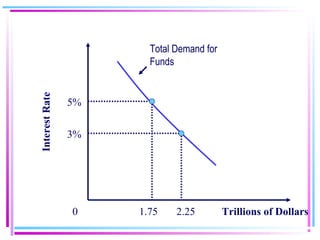
![[1] [2] [3]= [1]+ [2]
InterestRate Business Demand GovernmentDemand Total Demand
5% 1.0 0.75 1.75
3% 1.5 0.75 2.25
Demand for Loanable Funds (in Trillions)](https://image.slidesharecdn.com/2313f05no12-130810233613-phpapp01/85/2313f05no12-11-320.jpg)