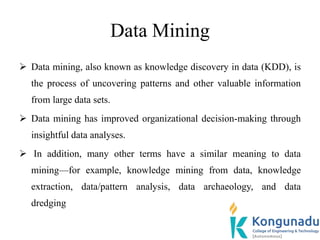
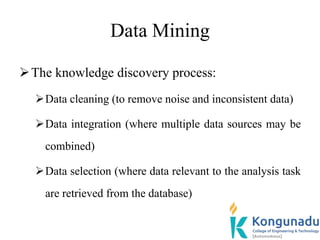
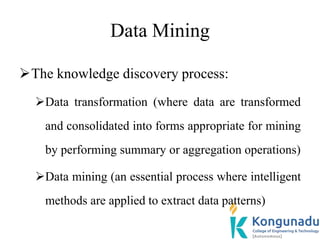
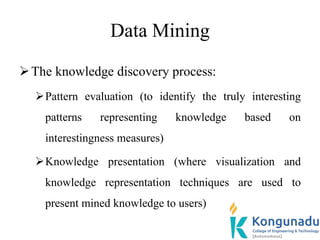
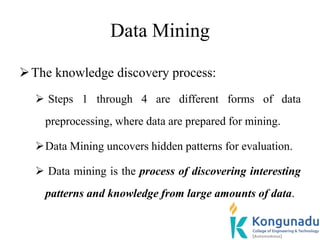
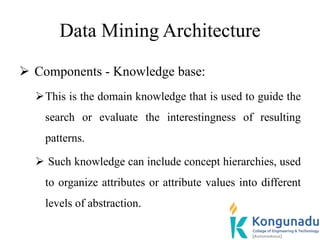
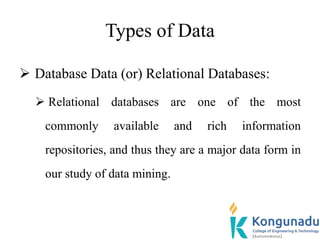
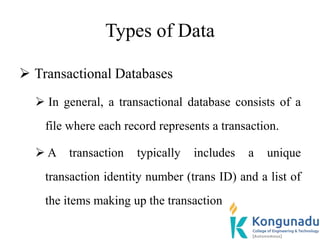
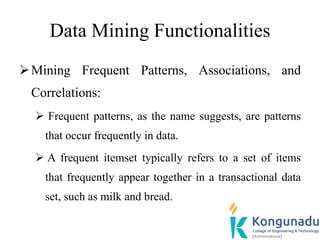
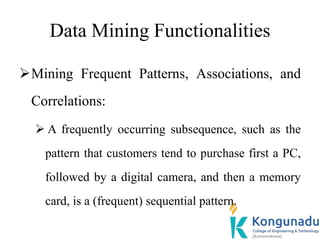
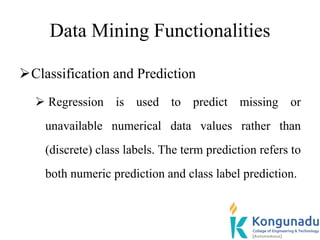
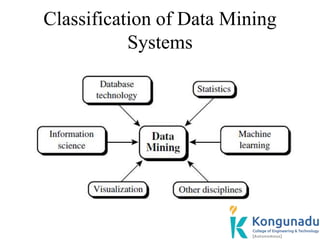
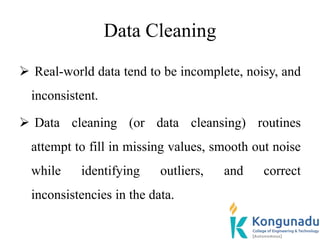
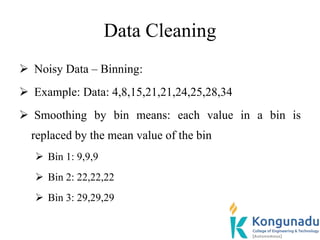
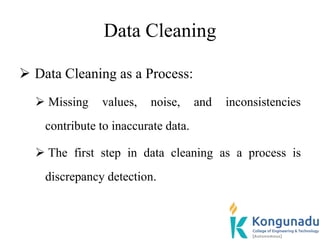
The document discusses data mining functionalities including descriptive and predictive tasks. Descriptive tasks characterize data properties, while predictive tasks perform induction to make predictions on data. Specifically, it describes concept/class description which involves characterizing and discriminating classes/concepts by summarizing target classes, comparing them to contrasting classes, and presenting outputs in forms like charts and data cubes.
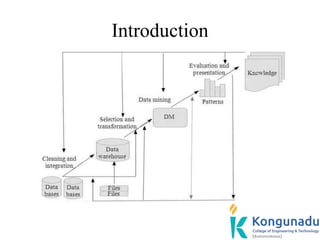
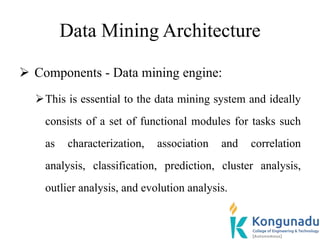
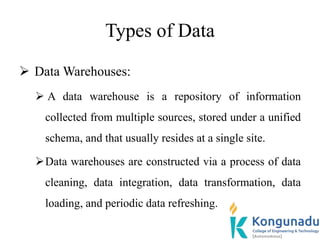
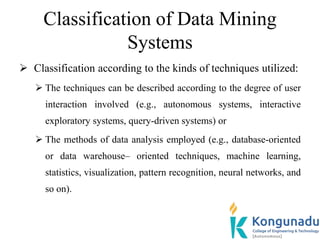

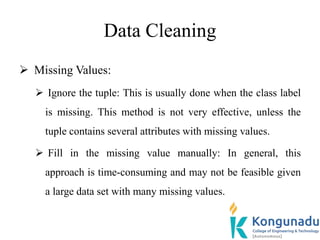
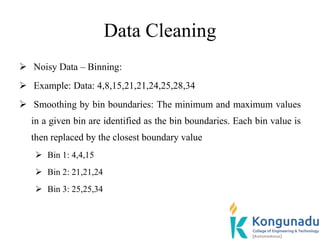
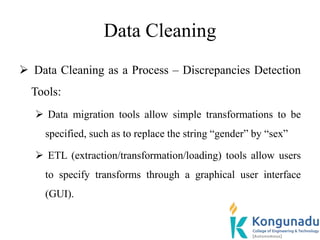
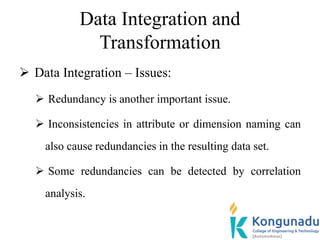
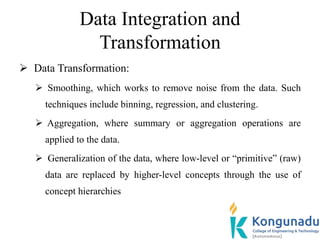
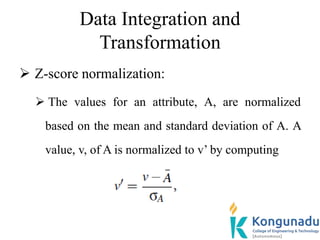
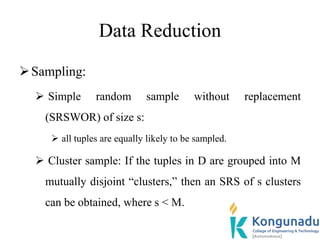
![Data Integration and
Transformation
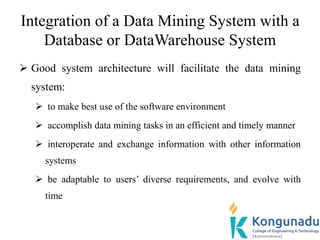
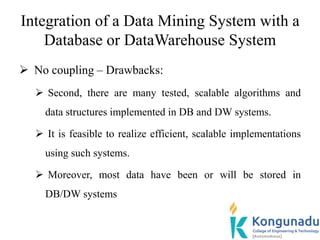
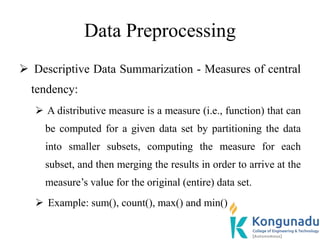
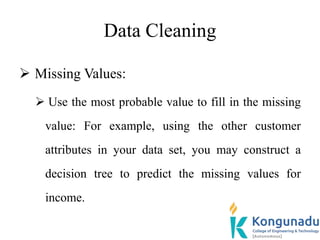
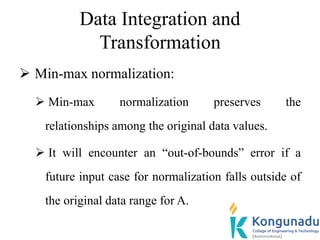
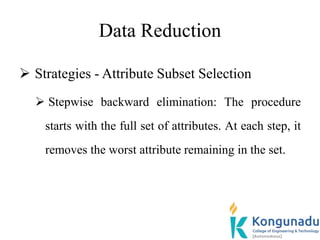
Min-max normalization:
Suppose that the minimum and maximum values for
the attribute income are 12,000 and 98,000,
respectively, to map income to the range [0:0;1:0].
By min-max normalization, a value of $73,600 for
income is transformed to – 0.76](https://image.slidesharecdn.com/20it501dwdmpptunitii-230125084353-94f21a0c/85/20IT501_DWDM_PPT_Unit_II-ppt-126-320.jpg)


![[DSC Europe 25] Slobodan Dolinic - Smart and Intelligent Green Region.pptx](https://cdn.slidesharecdn.com/ss_thumbnails/0bribinjsp6ghwtvsvor-2-sigre-slobodan-dolinic-260115093812-c9c10e90-thumbnail.jpg?width=640&height=640&fit=bounds)


![[DSC Europe 25] Andrzej Kowalczyk - AI - how to start small and grow in the f...](https://cdn.slidesharecdn.com/ss_thumbnails/oy1zmo94qv6vpcqjvno2-andrzej-kowalczyk-ai-how-to-start-small-and-grow-in-the-future-1-260119121559-cf093b23-thumbnail.jpg?width=640&height=640&fit=bounds)


![[DSC Europe 25] Elena Menshikova - AI-Powered Operational Excellence: Revolut...](https://cdn.slidesharecdn.com/ss_thumbnails/es6nholbqy3zaao2c2yd-2-elena-menshikova-data-ai-in-decision-making-260115093812-4fba8b38-thumbnail.jpg?width=640&height=640&fit=bounds)


