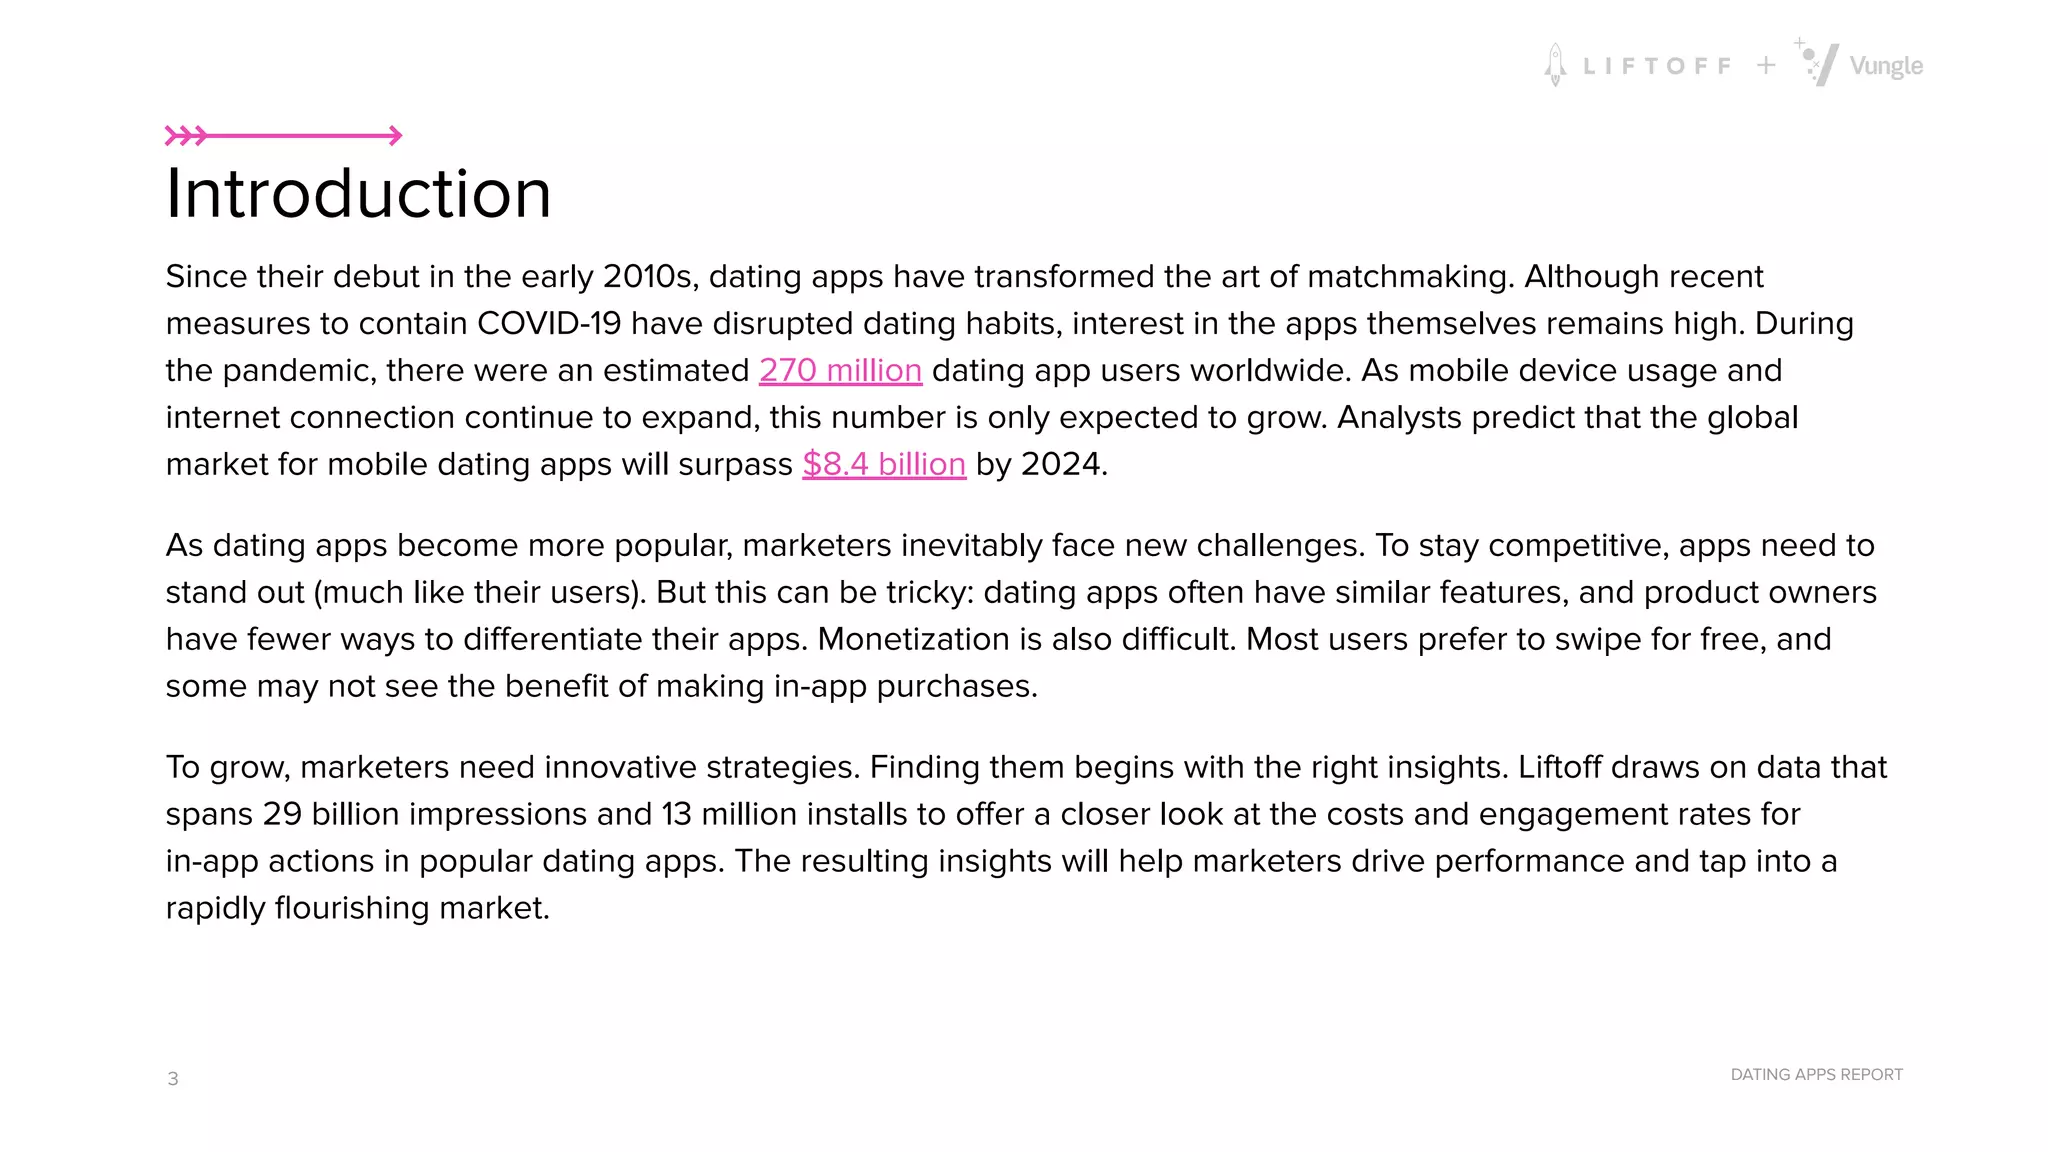
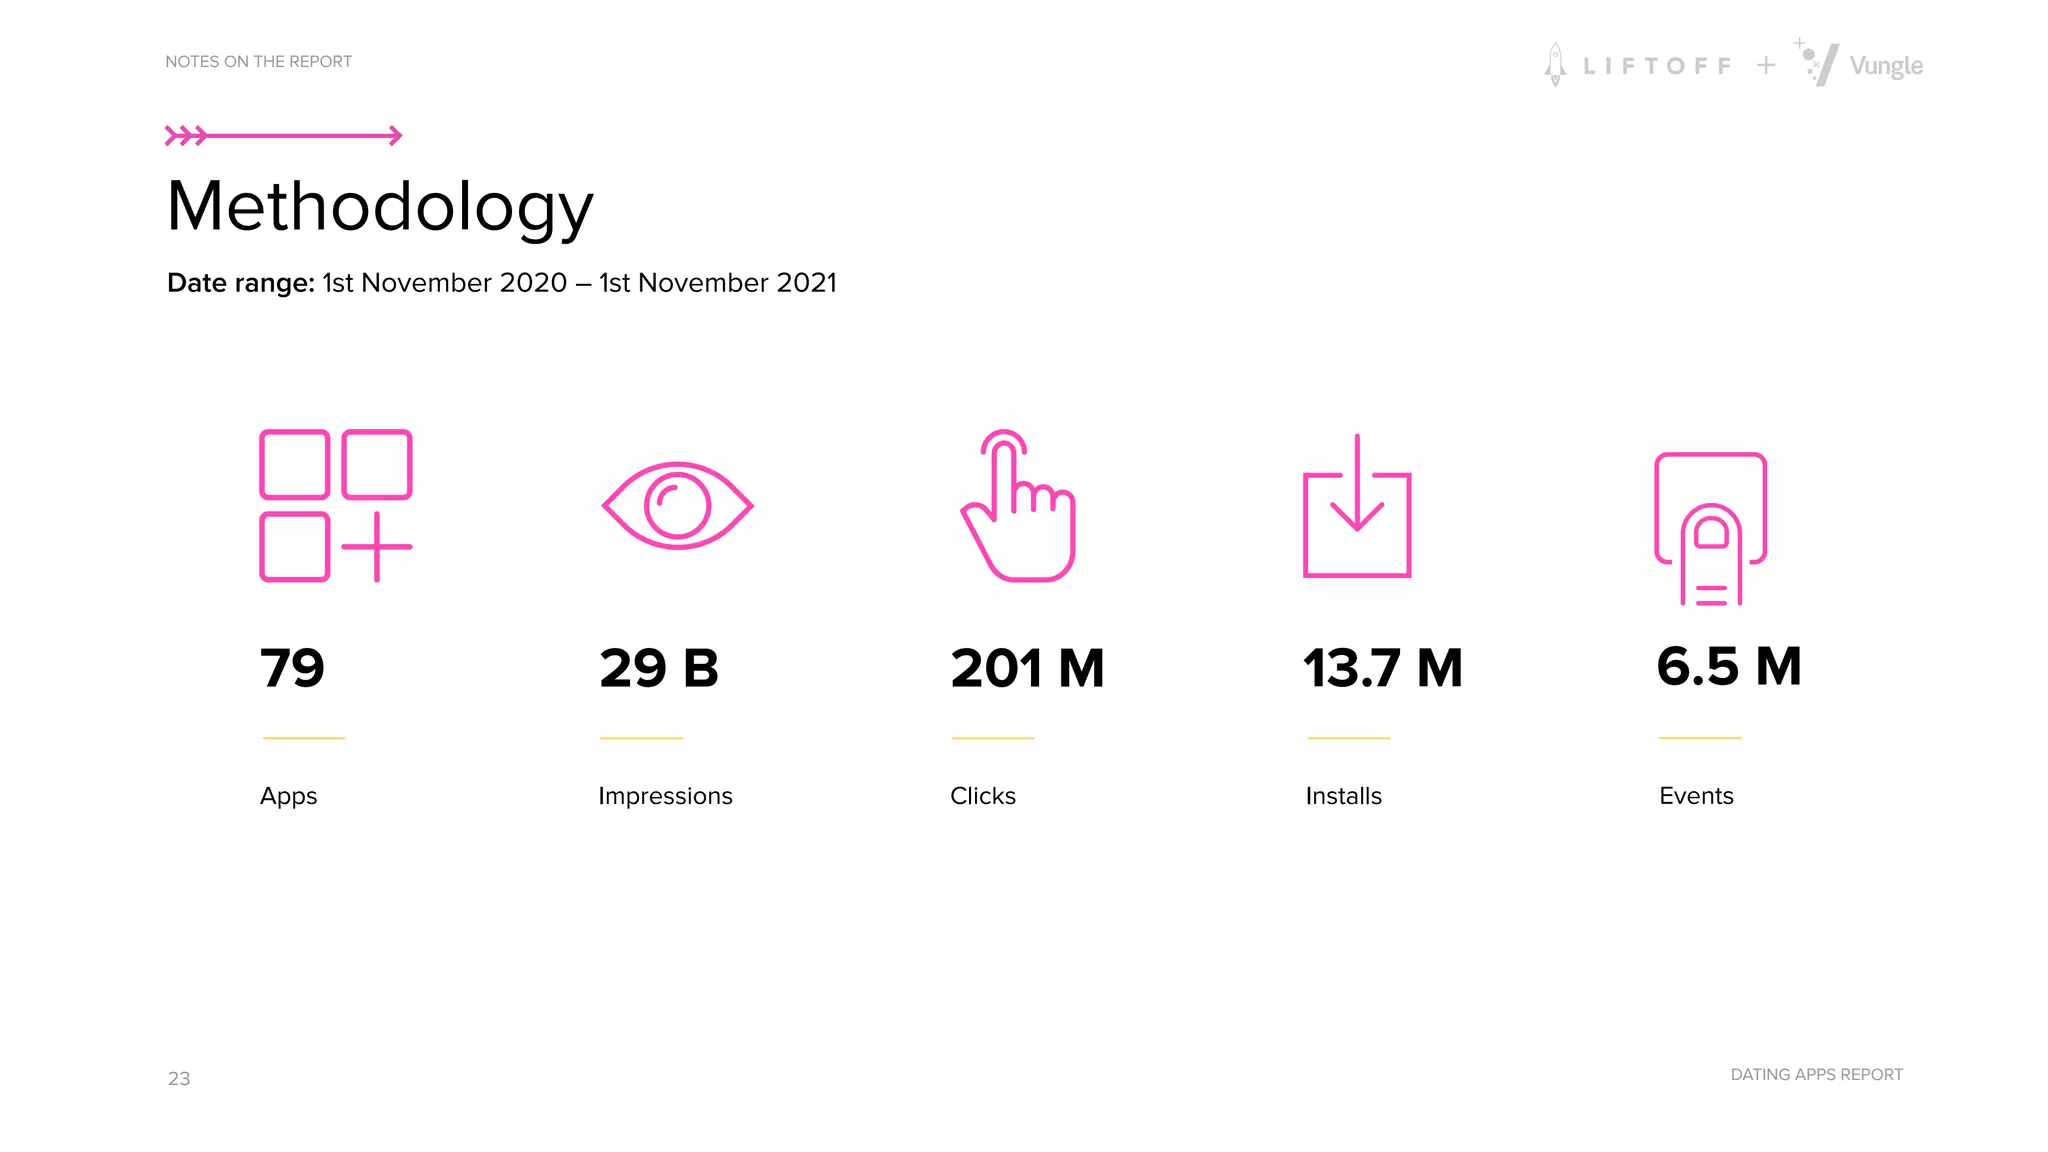
This document provides a summary of key trends in the global dating app market based on data from Liftoff spanning 29 billion impressions and 13 million installs. Some of the main highlights include:
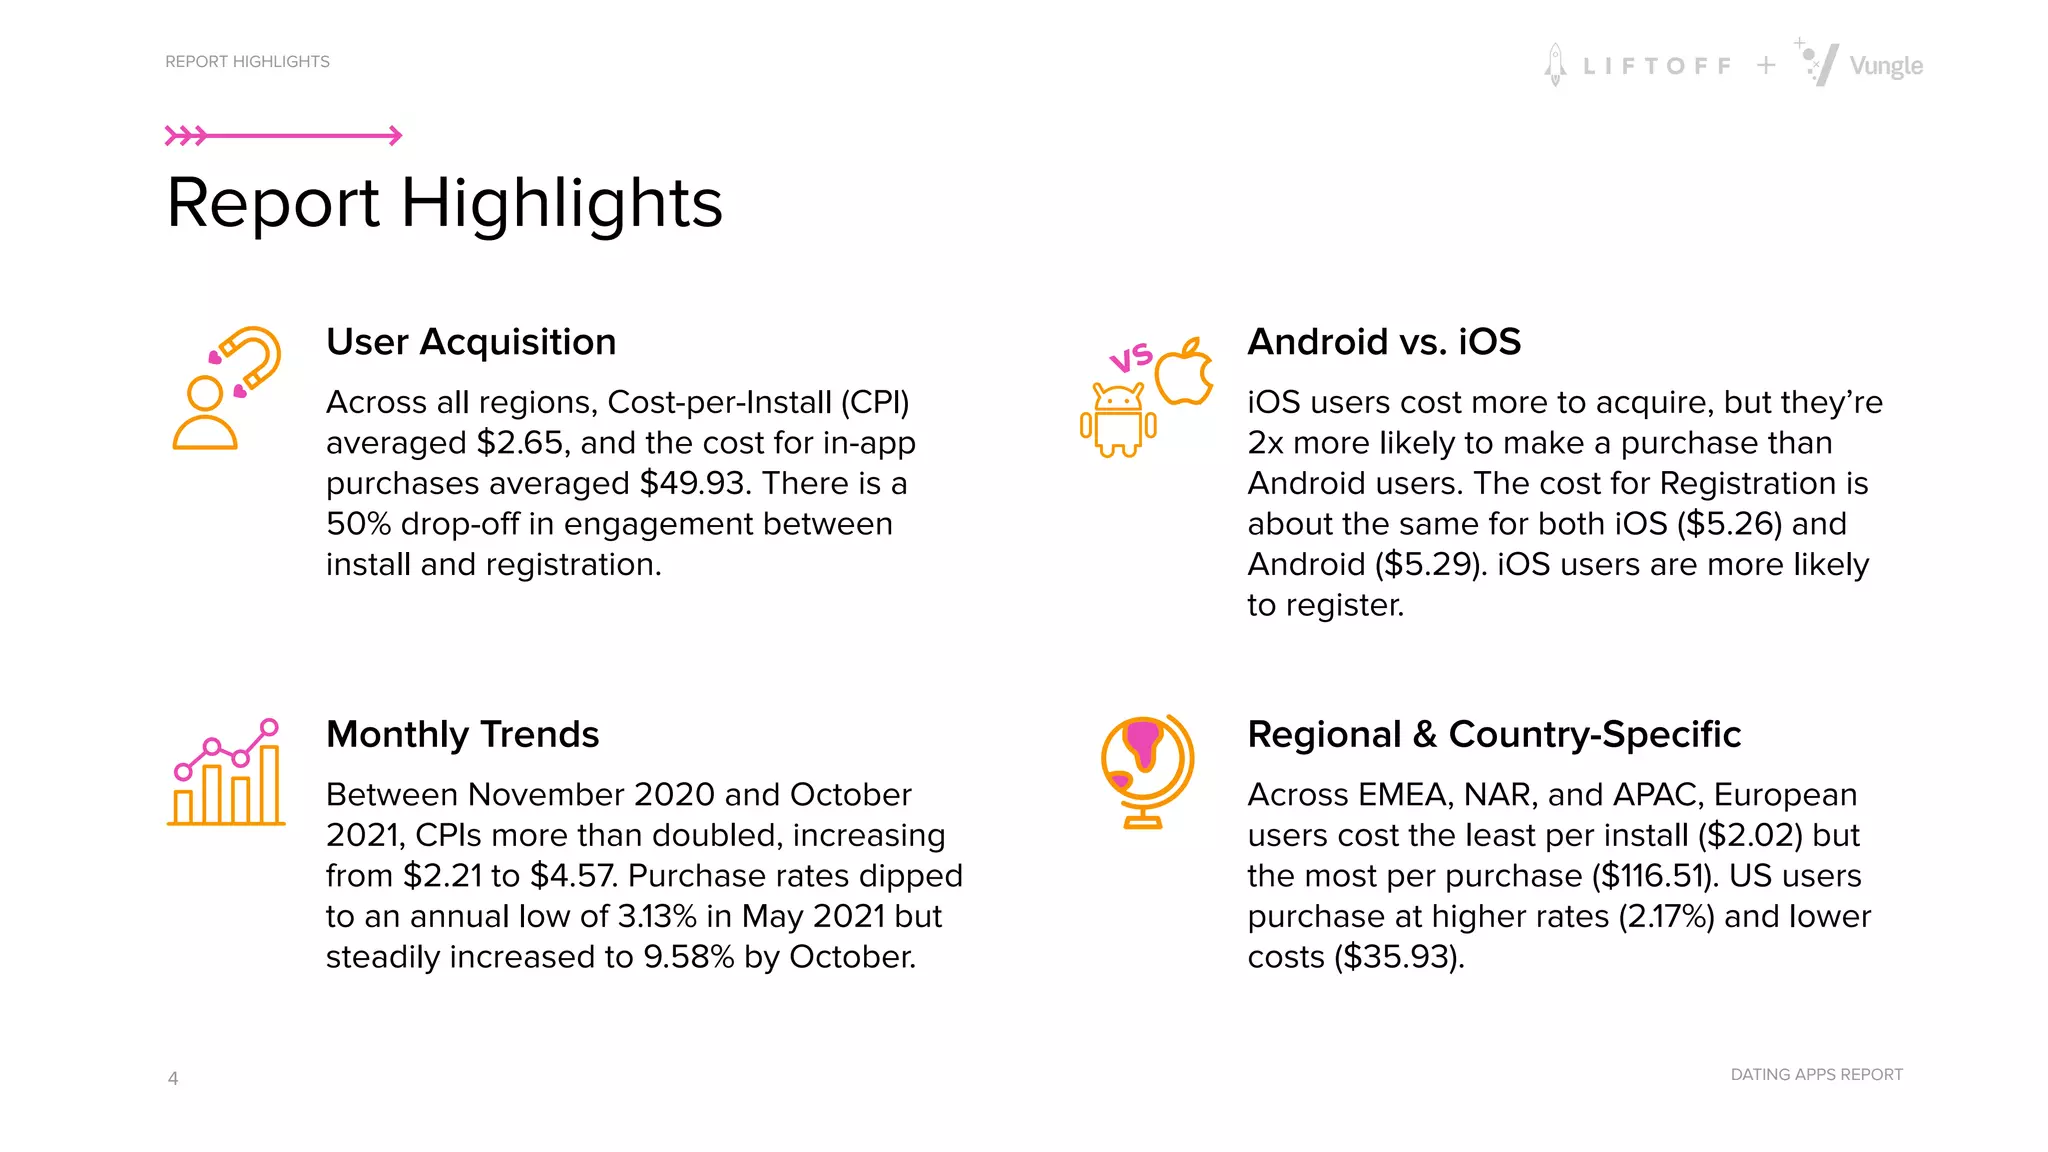
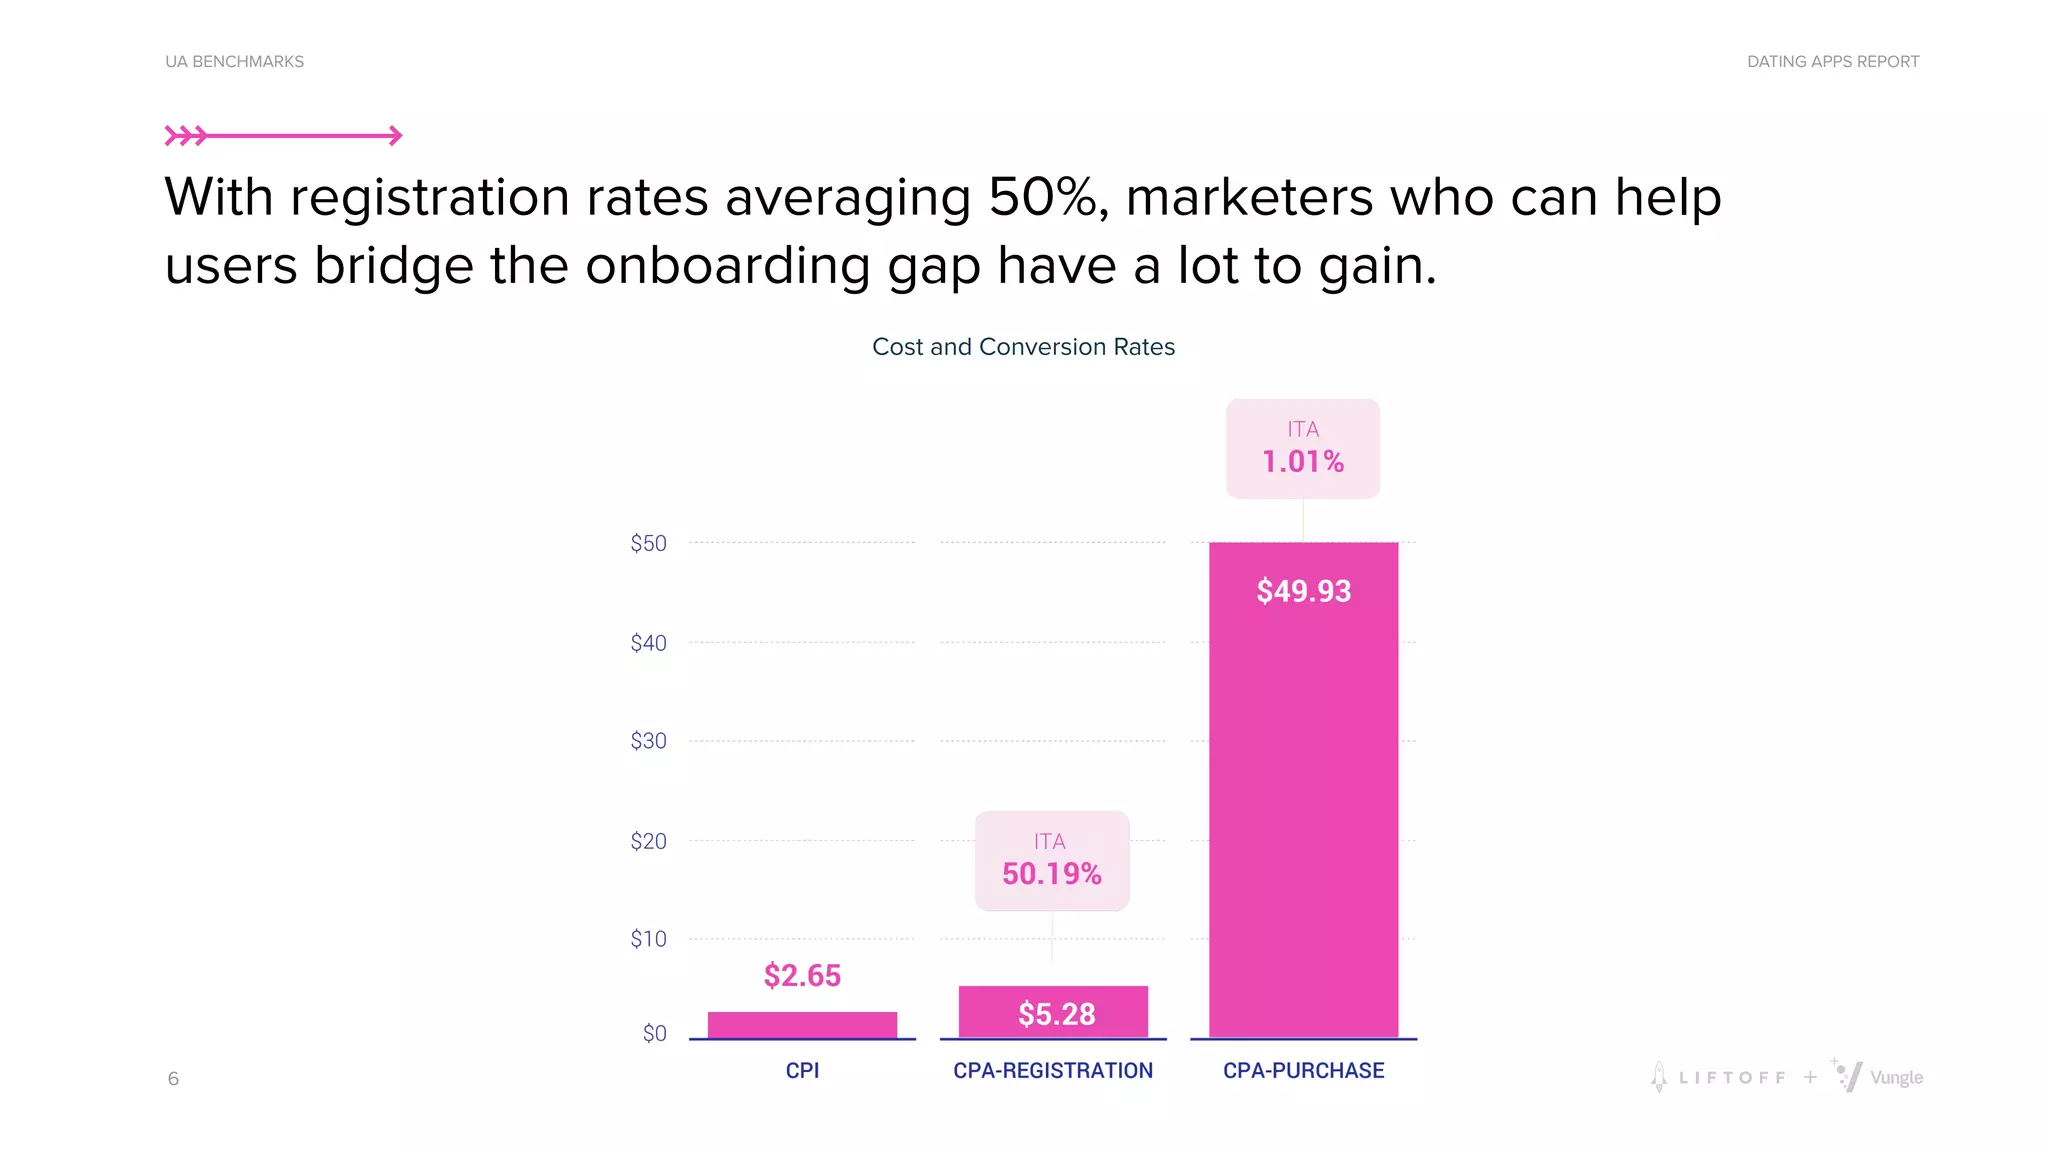
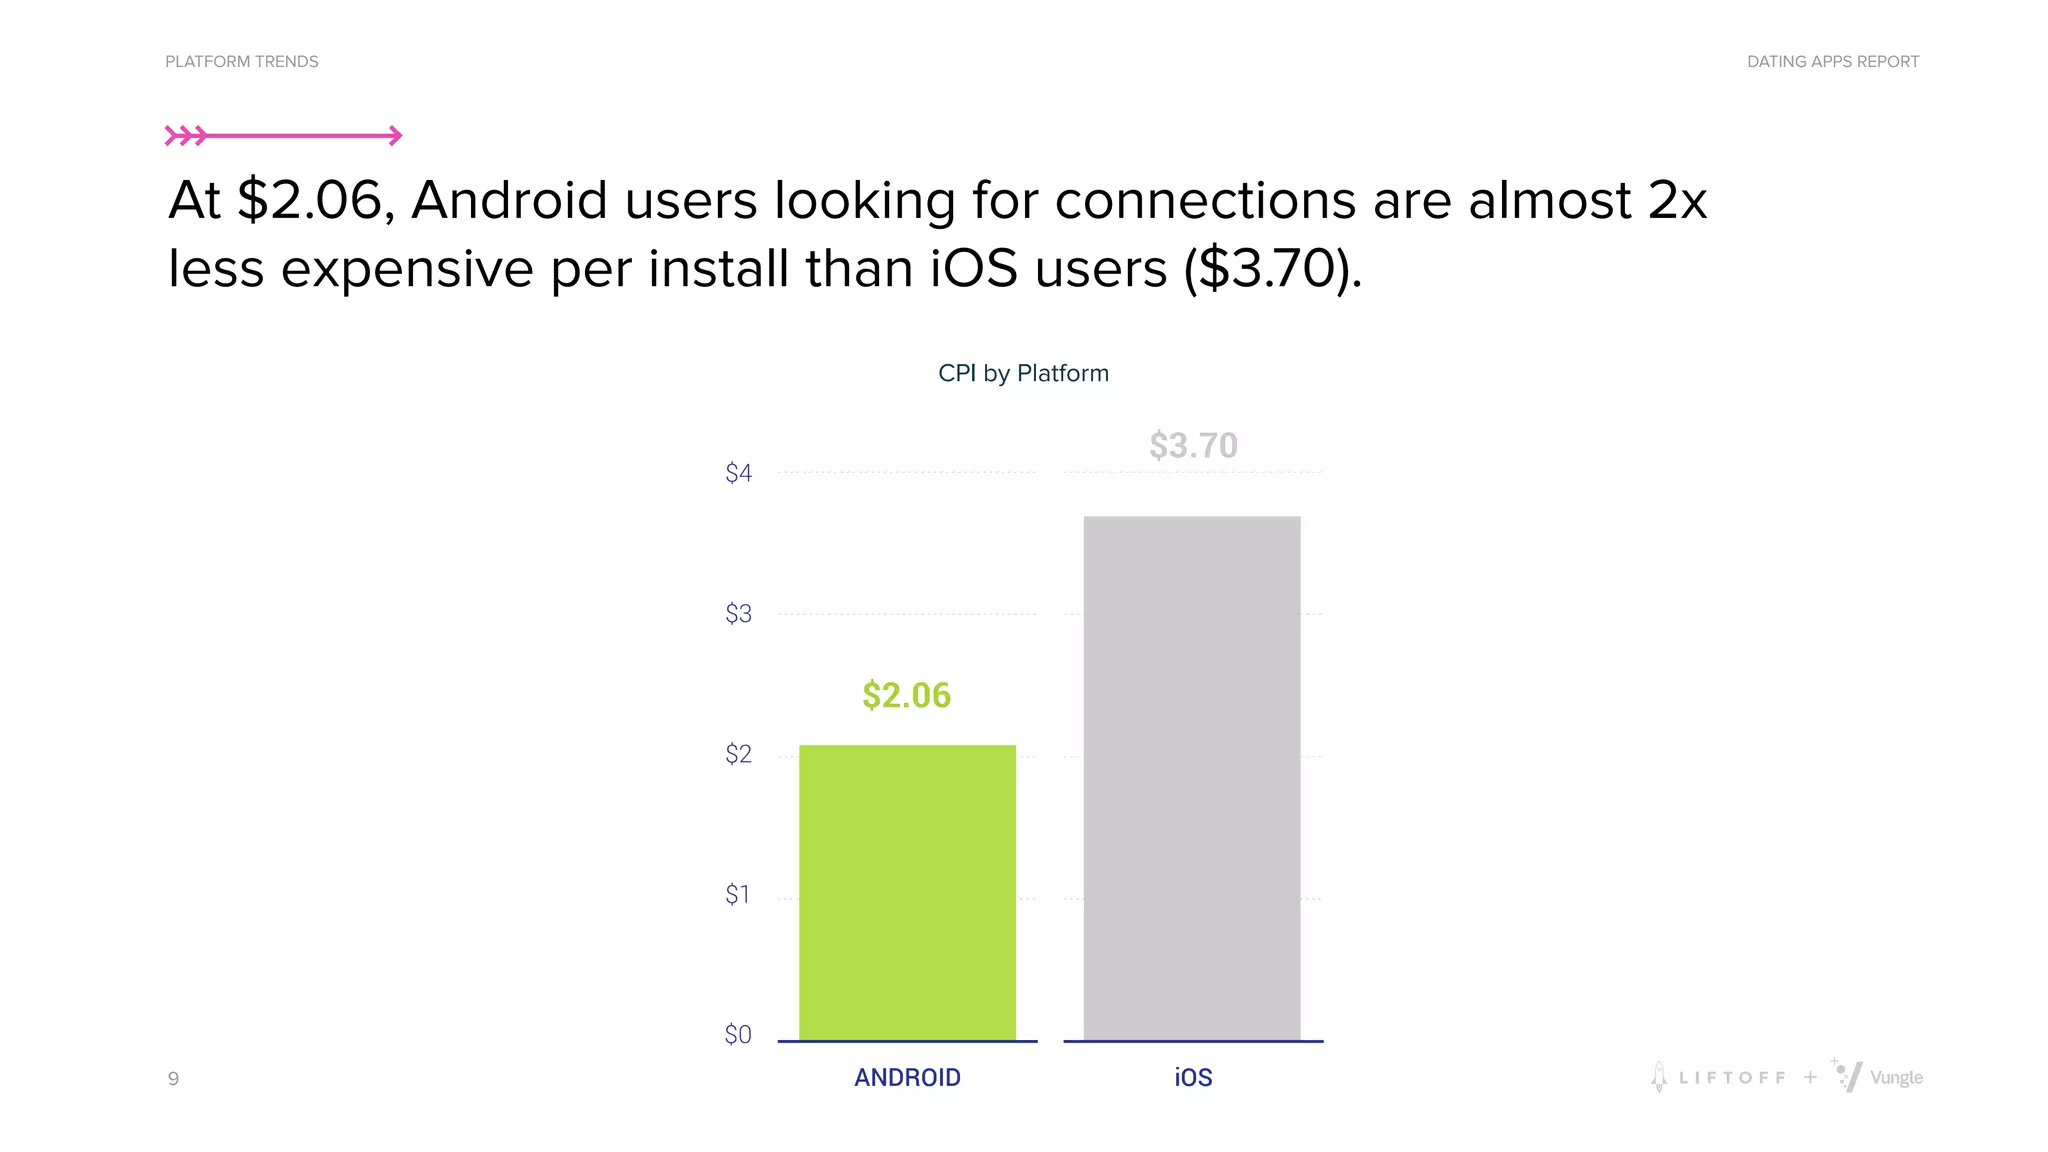
- The average global cost-per-install for dating apps was $2.65, while the average cost for in-app purchases was $49.93.
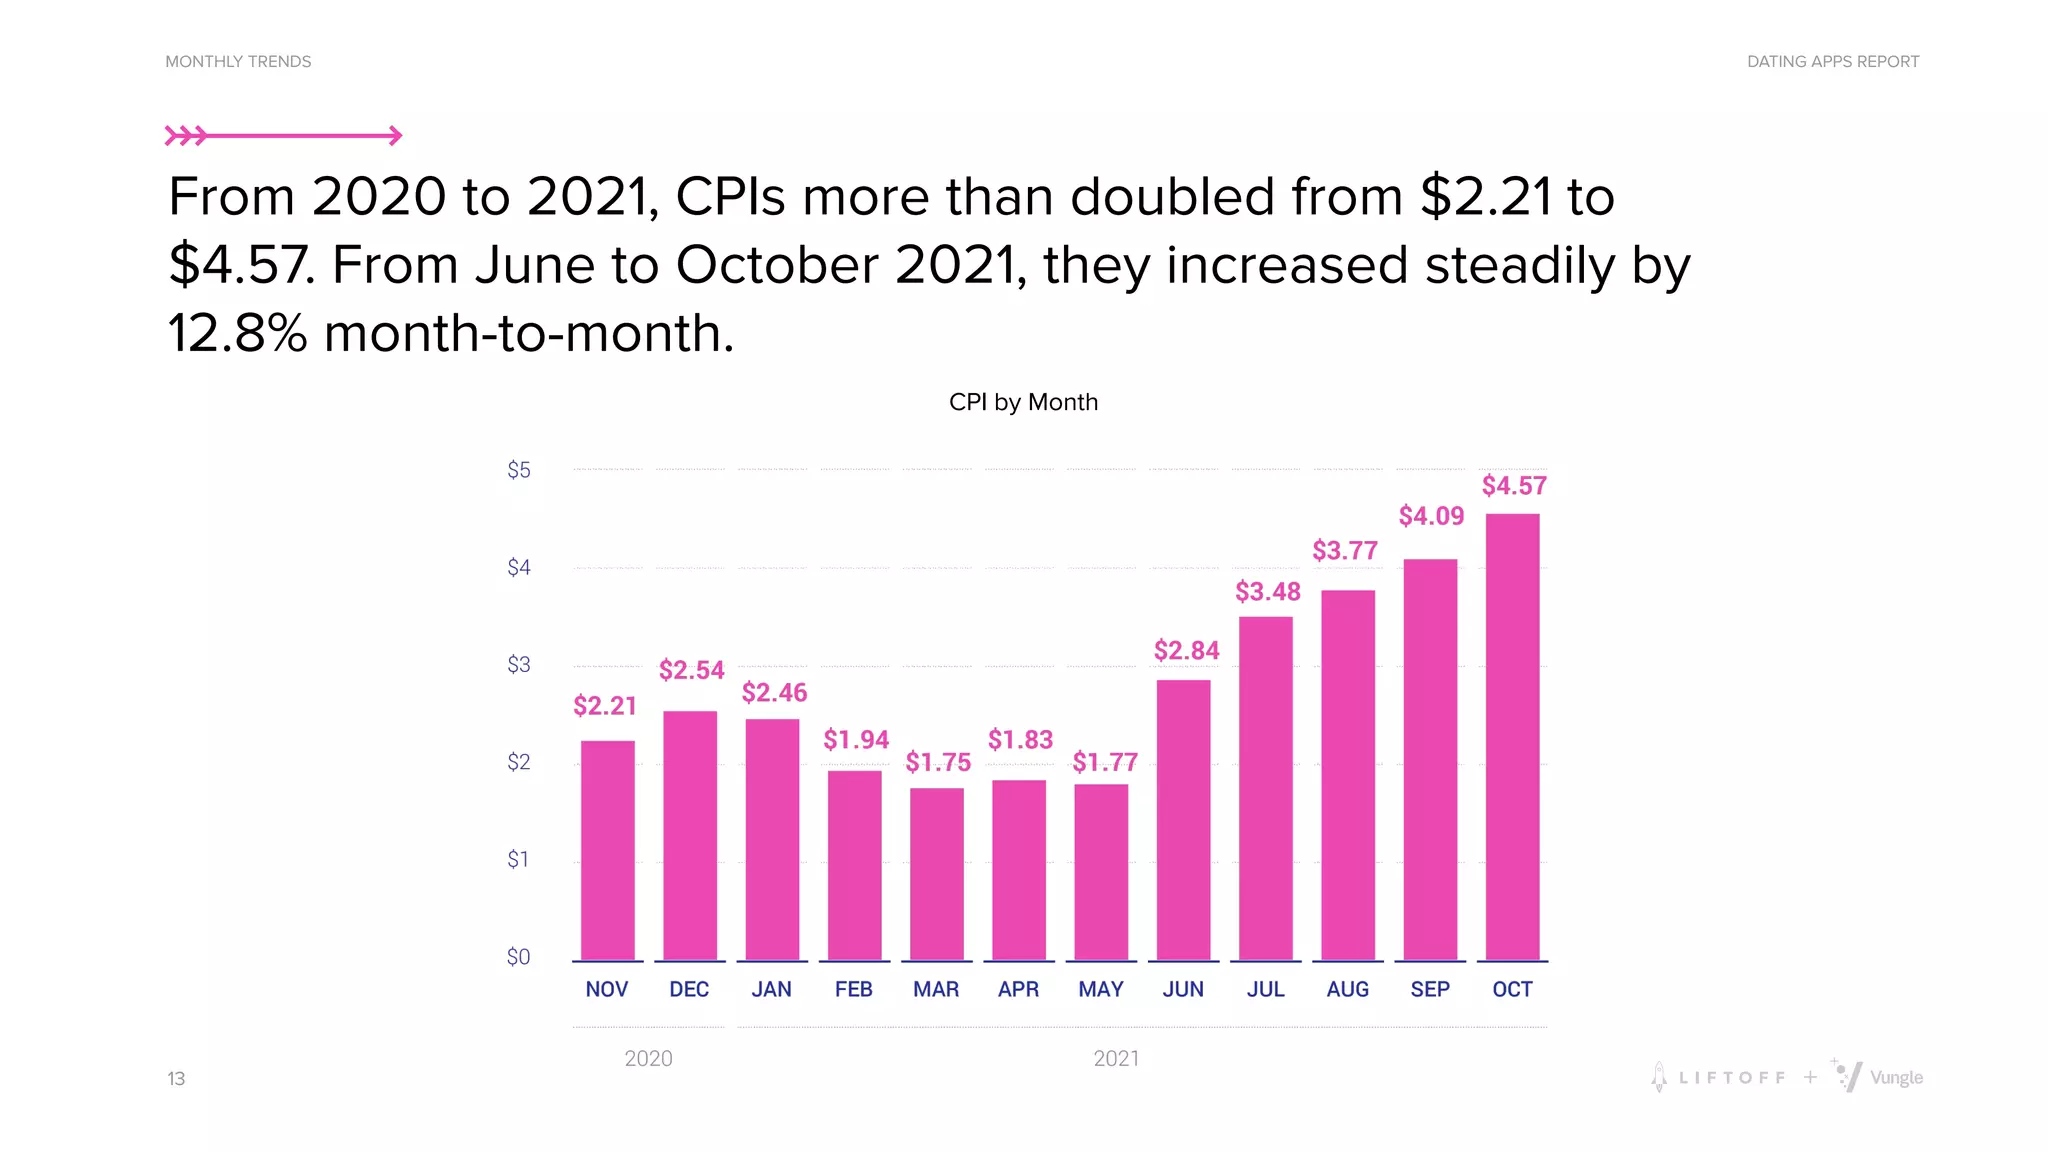
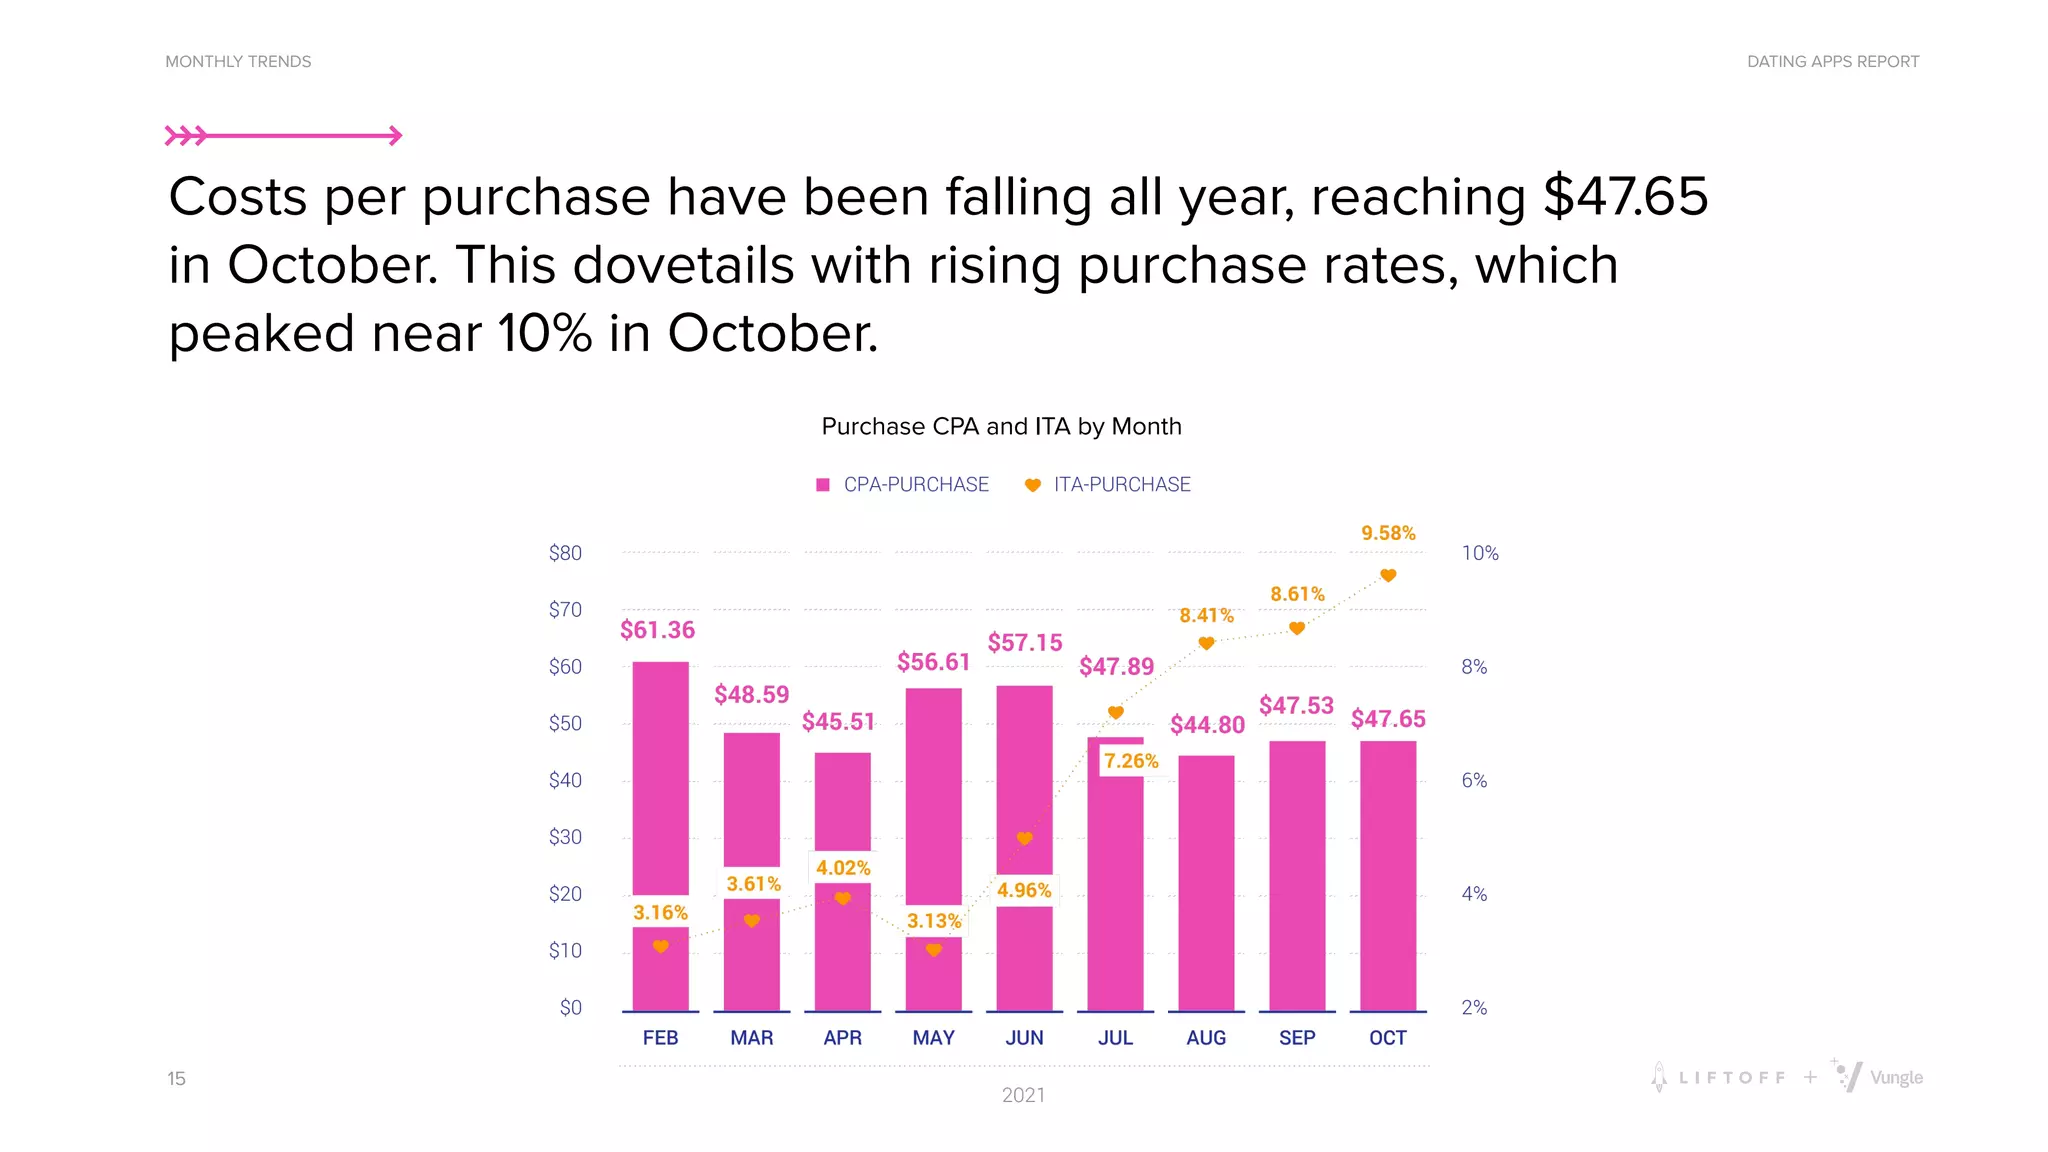
- Between November 2020 and October 2021, cost-per-install more than doubled from $2.21 to $4.57. In-app purchase rates dipped to 3.13% in May 2021 but steadily increased to 9.58% by October 2021.
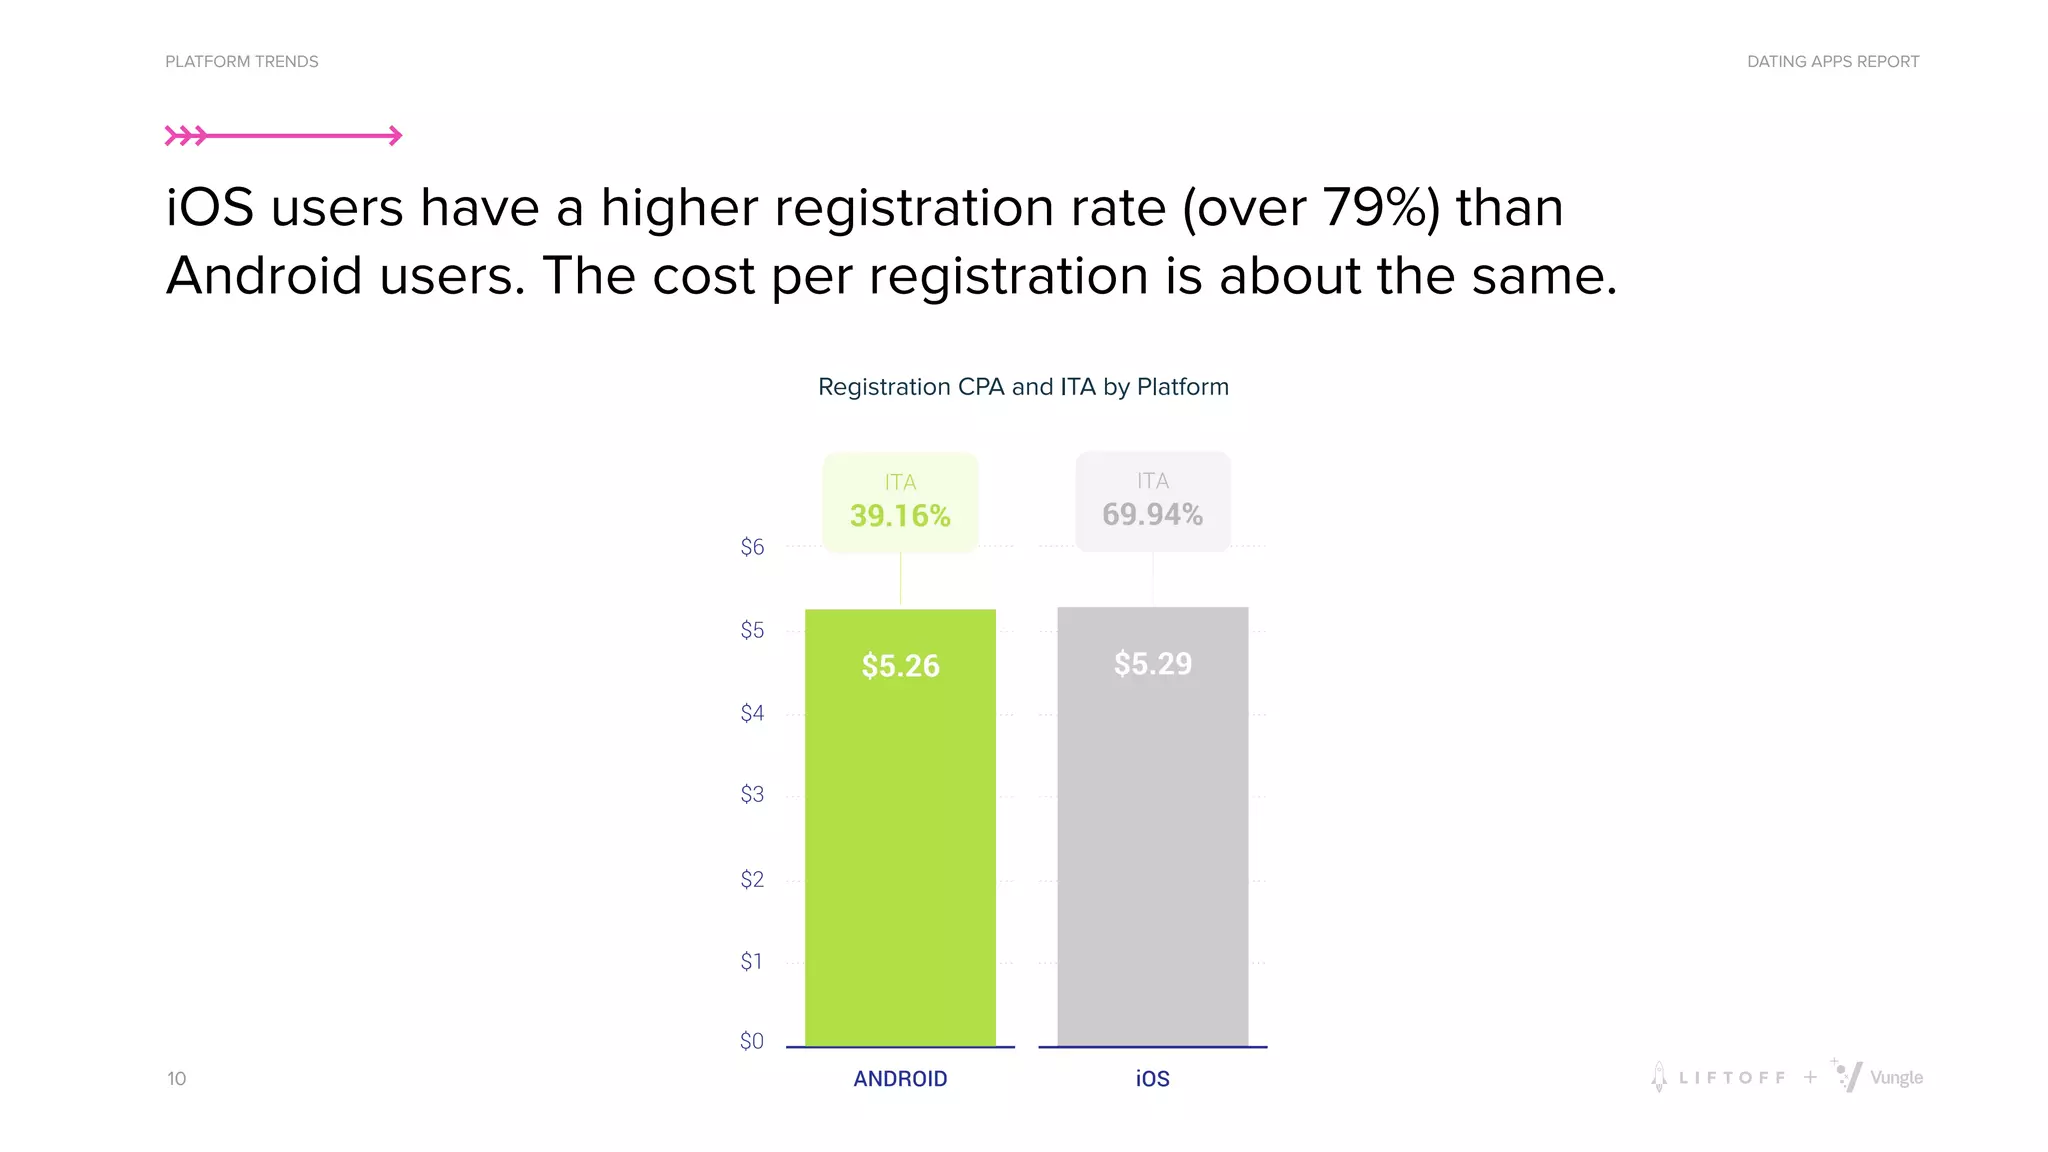
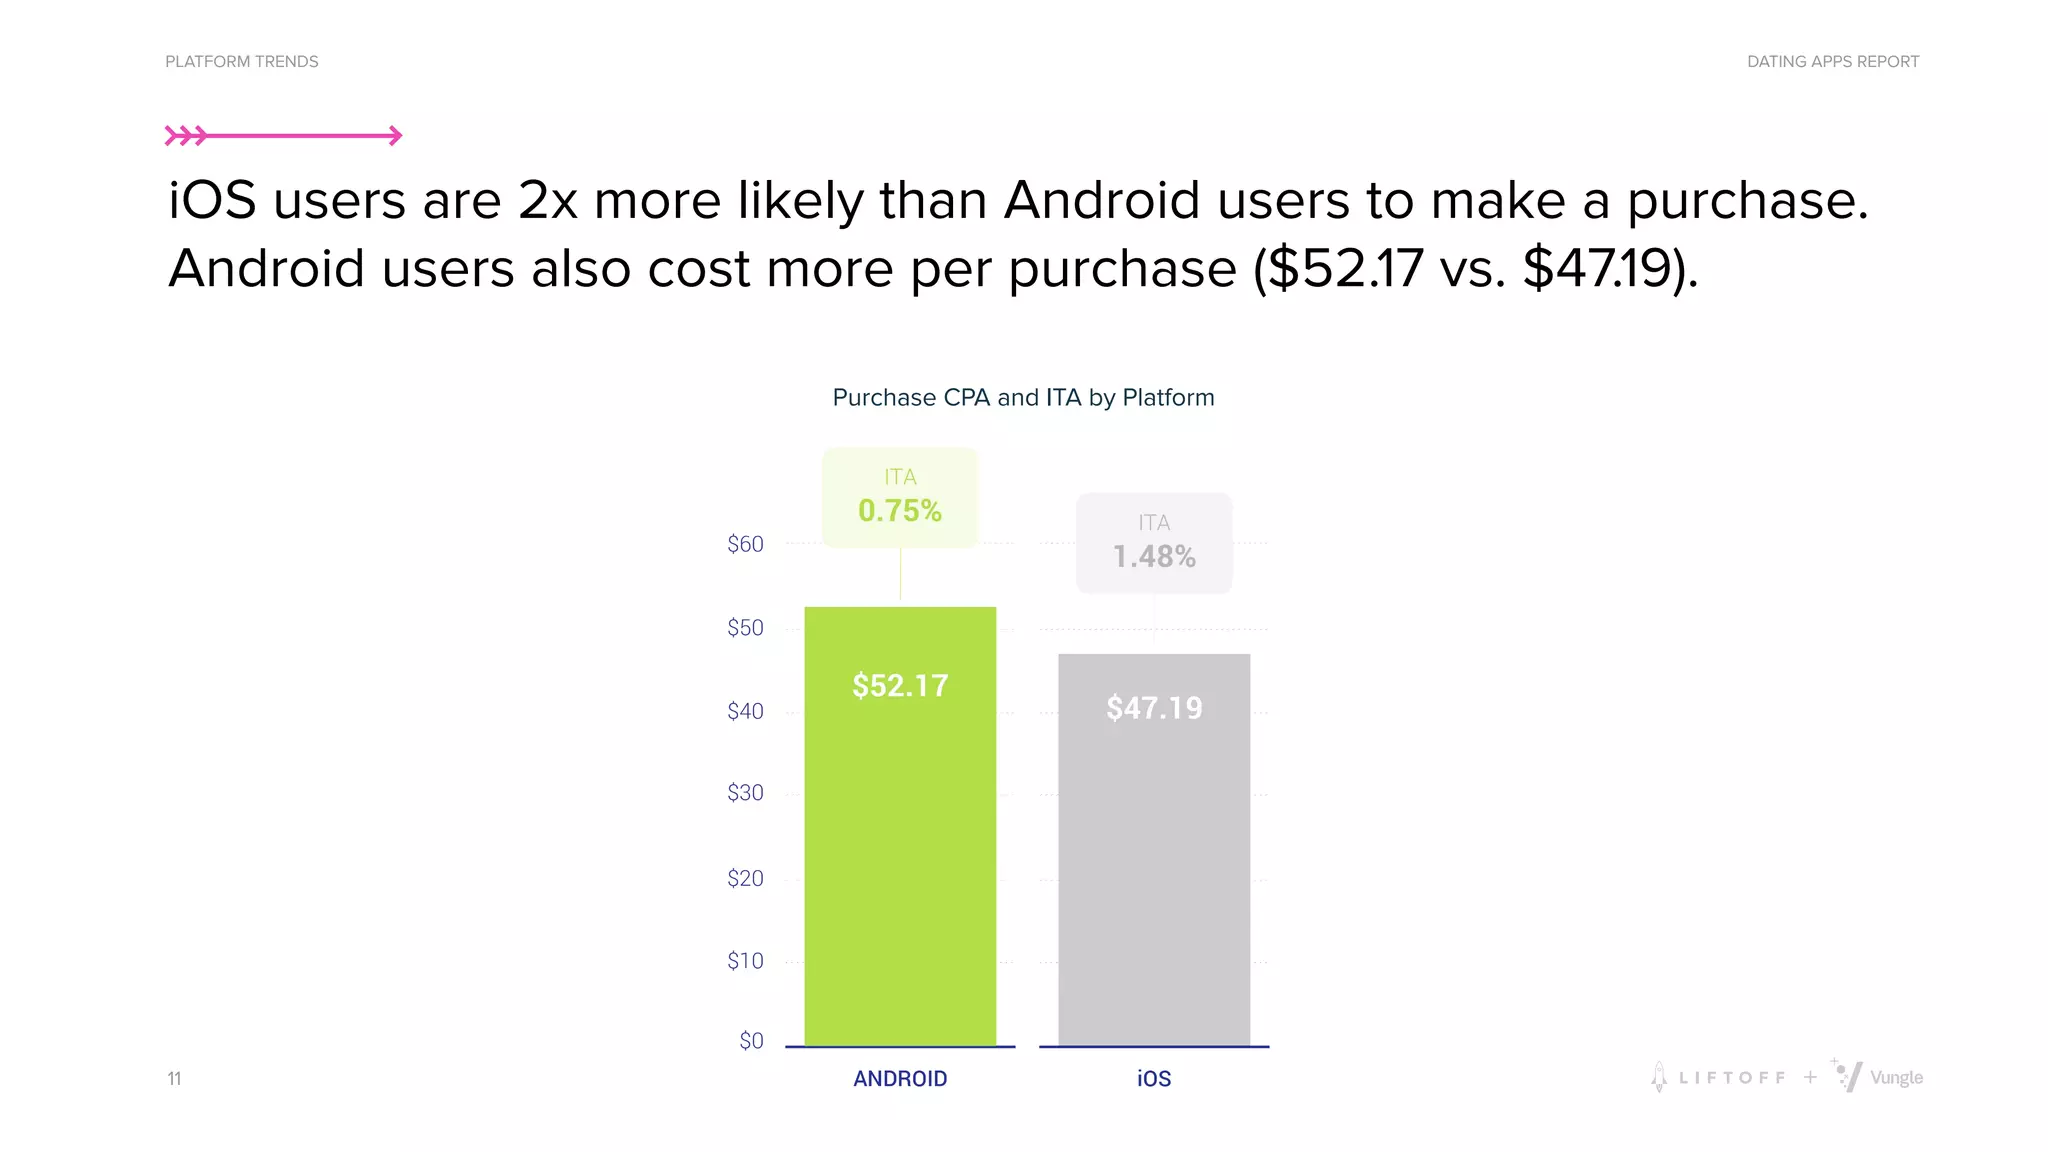
- iOS users cost more to acquire but were twice as likely to make purchases


![MAMA London [Research] - The State of App Marketing in Europe - Paul Wright, ...](https://cdn.slidesharecdn.com/ss_thumbnails/kenlvwer2gshfrd0olwl-signature-ee712d6f2814e7f3609146655f0783b5a1e814eb1884269fe5b287049bed4e82-poli-180712103259-thumbnail.jpg?width=640&height=640&fit=bounds)


