
Recommended
Recommended
More Related Content
What's hot
What's hot (20)
Similar to 2018 EY-Parthenon Price Perception Airlines
Similar to 2018 EY-Parthenon Price Perception Airlines (20)
Recently uploaded
Recently uploaded (20)
2018 EY-Parthenon Price Perception Airlines
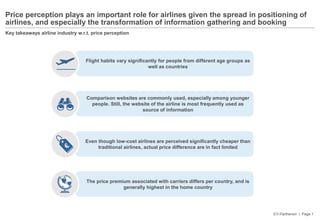
- 1. EY-Parthenon | Page 1 Comparison websites are commonly used, especially among younger people. Still, the website of the airline is most frequently used as source of information Even though low-cost airlines are perceived significantly cheaper than traditional airlines, actual price difference are in fact limited The price premium associated with carriers differs per country, and is generally highest in the home country Price perception plays an important role for airlines given the spread in positioning of airlines, and especially the transformation of information gathering and booking Flight habits vary significantly for people from different age groups as well as countries Key takeaways airline industry w.r.t. price perception
- 2. EY-Parthenon | Page 2 Average flights per person show strong differences, driven by participation, frequency and demographics; with the Netherlands scoring relatively low 0.85 1.02 1.67 1.00 0.87 0.85 Market volume of flights per year for the population of 18 – 65 years by country1,2 Source: Consumer survey; EY-Parthenon analysis 1. Based on the following question: Have you travelled by plane in the last 3 years (either private or for business)? 2. Based on the following question: How often did you travel somewhere by plane in the past 3 years? 13% 16% 17% 21% 32% 45-54 years 18-24 years 25-34 years >55 years 34-44 years Average number of flights per year # of flights Flight distribution by age category % Result of absolute population and both participation as well as flight frequency per person
- 3. EY-Parthenon | Page 3 Younger people use more sources of information to book a ticket, with more focus on online as well as comparison platforms compared to older people 18 – 24 years 35 – 44 years >55 years Search Engine (e.g. Google) Online comparison website or travel agent (e.g. Expedia, Skyscanner) Website airline Travel agent office or by phone 68% 54% 56% 19% 28% 49% 54% 18% 18% 35% 39% 21% 1 1 1 Source: Consumer survey; EY-Parthenon analysis 1. Based on the following question: Which sources have you used to find your flights? Average # of sources used 2.2 1.7 1.5 Search for information by age with respect to an airline ticket1, Dutch consumers % of respondents by age bracket, multiple responses possible
- 4. EY-Parthenon | Page 4 -40% -20% 0% 20% 40% 60% -40% -20% 0% 20% 40% Air France Norwegian Lufthansa KLM Brussels Airlines Alitalia Iberia British Airways SAS Swiss Airlines Austrian Airlines Turkish Airlines Polish Airlines EasyJet Ryanair Transavia Vueling Eurowings Flybe Even though low-cost airlines are perceived significantly cheaper than traditional airlines, actual price differences are often limited Price perception Deviation from average perception in %2,3 Realprice Deviationfromaveragepricein% Source: Consumer survey; Desk research; EY-Parthenon analysis 1. Departure from survey country’s main airport; respondents were either asked for a return trip to London or Barcelona 2. N ~= 100 per airline carrier per country 3. “What do you think a continental economy class return flight with check-in luggage would cost with the following airlines?” ± 5% Continental flightsPrice perception vs. actual price by airline, average of survey countries1 % deviation from average Traditional carrier Low-cost
- 5. EY-Parthenon | Page 5 Traditional carriers are perceived as more premium in their home countries, whereas low-cost carriers are perceived as cheap irrespective of country 23% 22% 30% 17% -12% -21% -19% 12% 9% 10% 12% -8% -23% -14% Eurowings EasyJet Lufthansa KLM British Airways Air France Transavia Home market Other Traditional carriers Low-cost carriers Price perception Deviation from average perception1,2,3 More expensiveCheaper Source: Consumer survey; Desk research; EY-Parthenon analysis 1. Departure from Amsterdam; respondents were either asked for a return trip to London or Barcelona 2. N ~= 100 per airline carrier per country 3. “What do you think a continental economy class return flight with check-in luggage would cost with the following airlines?” Consumers in a carrier’s home country perceive a much stronger price premium Continental flightsPrice perception of airline carriers in home market versus other countries % deviation from average
- 6. EY-Parthenon | Page 6 EY-Parthenon has ample experience with managing price perception, it is key to understand the influencers of price perception Price perception – influencing factors Influencers on price perception Importance of levers to leisure market Price Architecture ► Price point development over time ► Pricing differences for contract length ► Range architecture (good – better – best) ► … Actual Prices ► Key Value Items (and Categories) ► Difference with competitor prices ► Price point policies (e.g. psychological prices) ► … Promotions ► Discounts and multi-buy incentives ► Temporary offer (op=op) ► Loyalty rewards ► … Communication ► Out-of-home advertising ► Phrasing of price or product offering (e.g. always low) ► Digital signage of prices ► … Shopping Experience ► Total basket value ► Customer services / website look and feel ► Product presentation ► … …. … … Unimportant lever in leisure market Important lever in leisure market Source: EY-Parthenon experience
- 7. EY-Parthenon | Page 7 EY-Parthenon has performed this study into a variety of leisure categories in multiple W-European countries to assess both price perception and other travel/leisure habits Additional data gathered: ► Travel frequency (also by leisure / business ► Booking journey ► General demographics, such as age, gender and household income Consumer country of origin TTLsub-segment Airlines For every of these [TTL players you know], what do you think the price is for a specified activity? Hotels Holiday parks Cruise operators Tour operators Car rental Casual dining (only UK) Sample size (N) ~800 ~800 ~800 ~800 ~800 ~800 Scope of consumer survey
- 8. Contacts www.parthenon.ey.com Bram Kuijpers +31 621238 008 bram.kuijpers@parthenon.ey.com Rotterdam Wouter Vincken +31 621238 014 wouter.vincken@parthenon.ey.com Rotterdam
- 9. EY | Assurance | Tax | Transactions | Advisory About EY EY is a global leader in assurance, tax, transaction and advisory services. The insights and quality services we deliver help build trust and confidence in the capital markets and in economies the world over. We develop outstanding leaders who team to deliver on our promises to all of our stakeholders. In so doing, we play a critical role in building a better working world for our people, for our clients and for our communities. EY refers to the global organization, and may refer to one or more, of the member firms of Ernst & Young Global Limited, each of which is a separate legal entity. Ernst & Young Global Limited, a UK company limited by guarantee, does not provide services to clients. For more information about our organization, please visit ey.com. About EY-Parthenon EY-Parthenon B.V. is a member firm of Ernst & Young Global Limited and part of EY Transaction Advisory Services. About EY Transaction Advisory Services. How you manage your Capital Agenda today will define your competitive position tomorrow. We work with clients to create social and economic value by helping them make better, more informed decisions about strategically managing capital and transactions in fast-changing markets. Whether you’re preserving, optimizing, raising or investing capital, EY’s Transaction Advisory Services combine a unique set of skills, insight and experience to deliver focused advice. We help you drive competitive advantage and increased returns through improved decisions across all aspects of your Capital Agenda. © 2018 EYGM Limited. All Rights Reserved.