
Recommended
Recommended
More Related Content
Similar to 190225 ey parthenon price perception holiday parks
Similar to 190225 ey parthenon price perception holiday parks (20)
Recently uploaded
Recently uploaded (20)
190225 ey parthenon price perception holiday parks
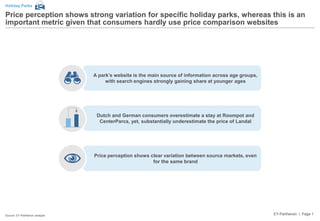
- 1. EY-Parthenon | Page 1 Price perception shows strong variation for specific holiday parks, whereas this is an important metric given that consumers hardly use price comparison websites A park’s website is the main source of information across age groups, with search engines strongly gaining share at younger ages Price perception shows clear variation between source markets, even for the same brand Dutch and German consumers overestimate a stay at Roompot and CenterParcs, yet, substantially underestimate the price of Landal Holiday Parks Source: EY-Parthenon analysis
- 2. EY-Parthenon | Page 2 The own website is a leading source of information, with search engines gaining popularity among younger consumers Search for holiday park information, by age1 % of respondents by age bracket, multiple responses possible Source: Consumer survey; EY-Parthenon analysis 1. Based on the following question: Which of the following sources have you used to find your holiday park? 18 – 24 years 35 – 44 years >55 years Website of holiday park Search engine (e.g. Google) Online comparison website or travel agent (e.g. Expedia) 42% 37% 17% 66% 31% 21% 67% 12% 9% 1 2 3 Average # of sources used 1.5 1.5 1.3 Holiday Parks
- 3. EY-Parthenon | Page 3 Holiday parks are most often booked directly, even when people use online comparison websites to source information Holiday Parks 85% 77% 74% 72% 68% 67% 57% 15% 23% 26% 28% 32% 33% 43% Travel agent office or by phone Website holiday park Advertisement (poster, magazine etc.) Search Engine (e.g. Google) Holiday park office or by phone Third party 9 Online advertisement or email Online comparison website or travel agent (e.g. Expedia, Booking.com, Trip Advisor) 31 79% Directly 227 31 43 105 61 Booking method in relation to the source used in information search1,2 %, N Source: Consumer survey; EY-Parthenon analysis 1. Based on the following question: Which of the following sources have you used to find your holiday park? 2. Based on the following question: Where did you book your holiday park? Of consumers booked directly
- 4. EY-Parthenon | Page 4 Consumers overestimate the price of a stay at Roompot and CenterParcs, yet, substantially underestimate the price of a holiday at a Landal park 484 579 539 453 690 466 381 537 701 -21% -22% +50% Perception versus actual price for consumers from the Netherlands and Germany1,2 € Source: Consumer survey; EY-Parthenon analysis 1. Based on the following question: What do you think renting a standard 4 person accommodation for a week would cost at the following holiday park? 2. N ~= 200 per brand per country Holiday Parks Actual Actual Actual
- 5. EY-Parthenon | Page 5 There is a significant price spread for parks by brand, yet, consumers appear anchored at higher priced parks for RP and CP, and the lower for Landal 800 400 0 200 600 1,000 218 – 481Actual price spread 426 – 658 397 – 1,035 381Average price 537 701 Actual Perception Perception versus actual price for consumers from the Netherlands and Germany1,2,3 € Source: Consumer survey; EY-Parthenon analysis 1. Based on the following question: What do you think renting a standard 4 person accommodation for a week would cost at the following holiday park? 2. Actual prices based on a weekend in August ’18 for a 4p bungalow, sampled December 2017 3. N ~= 200 per brand per country Holiday Parks
- 6. EY-Parthenon | Page 6 Price perception for consumers from different source markets show significant differences 483 507 484 453 381 +12% 678 597 579 690 537 +19% 488 466 539 701 Label Actual +16% 1. Based on the following question: What do you think renting a standard 4 person accommodation for a week would cost at the following holiday park? 2. N ~= 200 per brand per country Source: Consumer survey; EY-Parthenon analysis Holiday Parks Perception versus actual price for consumers from selected countries1,2 €
- 7. EY-Parthenon | Page 7 EY-Parthenon has ample experience with managing price perception, it is key to understand the influencers of price perception Influencers on price perception Importance of levers to leisure market Price Architecture ► Price point development over time ► Pricing differences for contract length ► Range architecture (good – better – best) ► … Actual Prices ► Key Value Items (and Categories) ► Difference with competitor prices ► Price point policies (e.g. psychological prices) ► … Promotions ► Discounts and multi-buy incentives ► Temporary offer (op=op) ► Loyalty rewards ► … Communication ► Out-of-home advertising ► Phrasing of price or product offering (e.g. always low) ► Digital signage of prices ► … Shopping Experience ► Total basket value ► Customer services / website look and feel ► Product presentation ► … …. … … Unimportant lever in leisure market Important lever in leisure market Source: EY-Parthenon experience Price perception – influencing factors
- 8. EY-Parthenon | Page 8 EY-Parthenon has performed this study into a variety of leisure categories in multiple W-European countries to assess both price perception and other travel/leisure habits Additional data gathered: ► Travel frequency (also by leisure / business ► Booking journey ► General demographics, such as age, gender and household income Consumer country of origin TTLsub-segment Airlines For every of these [TTL players you know], what do you think the price is for a specified activity? Hotels Holiday parks Cruise operators Tour operators Car rental Casual dining (only UK) Sample size (N) ~800 ~800 ~800 ~800 ~800 ~800 Scope of consumer survey
- 9. Contacts www.parthenon.ey.com Bram Kuijpers +31 621238 008 bram.kuijpers@parthenon.ey.com Rotterdam Wouter Vincken +31 621238 014 wouter.vincken@parthenon.ey.com Rotterdam Arjan van der Pal +31 621238 033 arjan.van.der.pal@parthenon.ey.com Rotterdam Olle Tielrooij +31 629084 326 olle.tielrooij@parthenon.ey.com Rotterdam
- 10. EY | Assurance | Tax | Transactions | Advisory About EY EY is a global leader in assurance, tax, transaction and advisory services. The insights and quality services we deliver help build trust and confidence in the capital markets and in economies the world over. We develop outstanding leaders who team to deliver on our promises to all of our stakeholders. In so doing, we play a critical role in building a better working world for our people, for our clients and for our communities. EY refers to the global organization, and may refer to one or more, of the member firms of Ernst & Young Global Limited, each of which is a separate legal entity. Ernst & Young Global Limited, a UK company limited by guarantee, does not provide services to clients. For more information about our organization, please visit ey.com. About EY-Parthenon EY-Parthenon B.V. is a member firm of Ernst & Young Global Limited and part of EY Transaction Advisory Services. About EY Transaction Advisory Services. How you manage your Capital Agenda today will define your competitive position tomorrow. We work with clients to create social and economic value by helping them make better, more informed decisions about strategically managing capital and transactions in fast-changing markets. Whether you’re preserving, optimizing, raising or investing capital, EY’s Transaction Advisory Services combine a unique set of skills, insight and experience to deliver focused advice. We help you drive competitive advantage and increased returns through improved decisions across all aspects of your Capital Agenda. © 2019 EYGM Limited. All Rights Reserved.