Download as ODP, PPTX

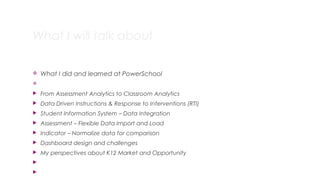
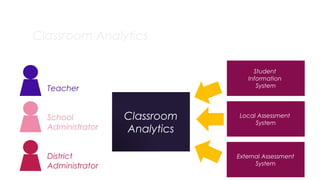
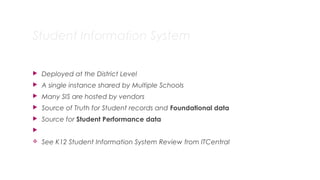
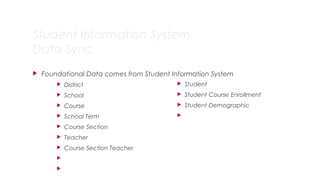
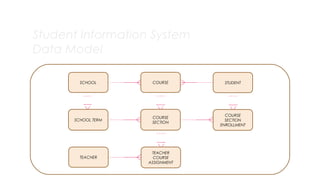
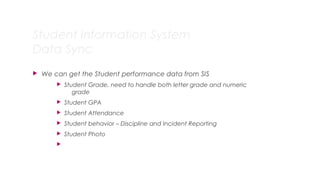

This document discusses developing classroom analytics using data from student information systems and assessment systems. It describes integrating student performance data, including grades, GPA, attendance and behavior records from SIS. It also covers importing assessment scores from test vendors and normalizing the data to allow for comparison using indicators and rubrics. The goal is to provide teachers, schools and districts analytics on student performance to support data-driven instruction and interventions.


![Data driven ppt_presentation[1]](https://cdn.slidesharecdn.com/ss_thumbnails/datadrivenpptpresentation1-100710102551-phpapp02-thumbnail.jpg?width=640&height=640&fit=bounds)


