Download to read offline


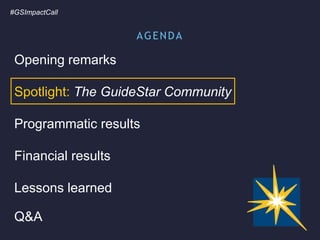
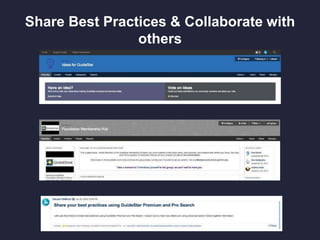
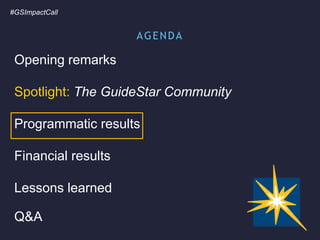
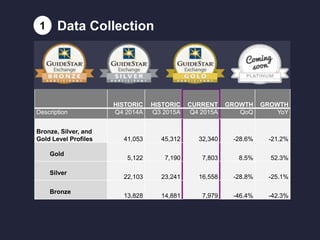
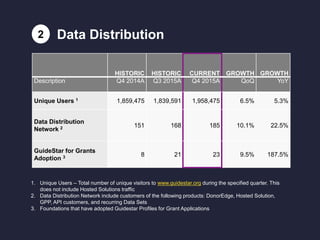
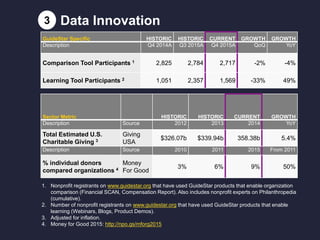
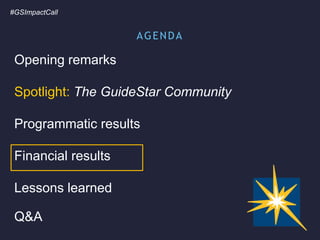
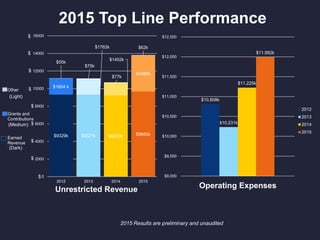
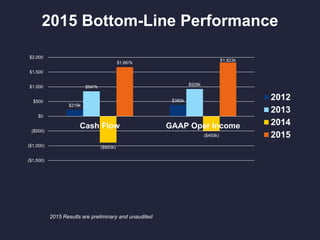
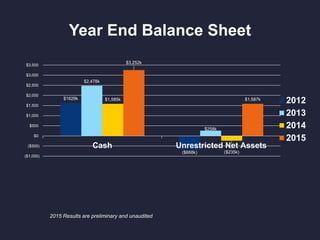
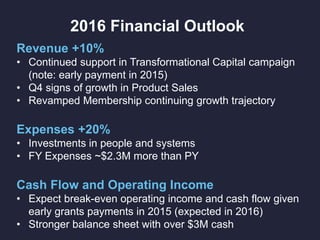
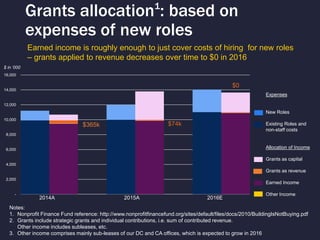
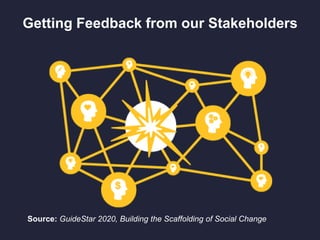


GuideStar held its quarterly Impact Call on February 9, 2016 to report on fourth quarter results and provide an outlook for 2016. Key highlights included: - Programmatic results showed declines in profile updates but growth in higher-level Gold profiles and GuideStar for Grants adoption. Unique users and the data distribution network also grew. - Preliminary financial results for 2015 showed revenue growth of 10% and expenses growth of 20%, with a break-even operating income expected given investments in staffing. The balance sheet remained strong. - Lessons from stakeholder feedback will inform GuideStar's 2020 strategic plan to build the "scaffolding of social change." The call concluded with a Q&A session.


