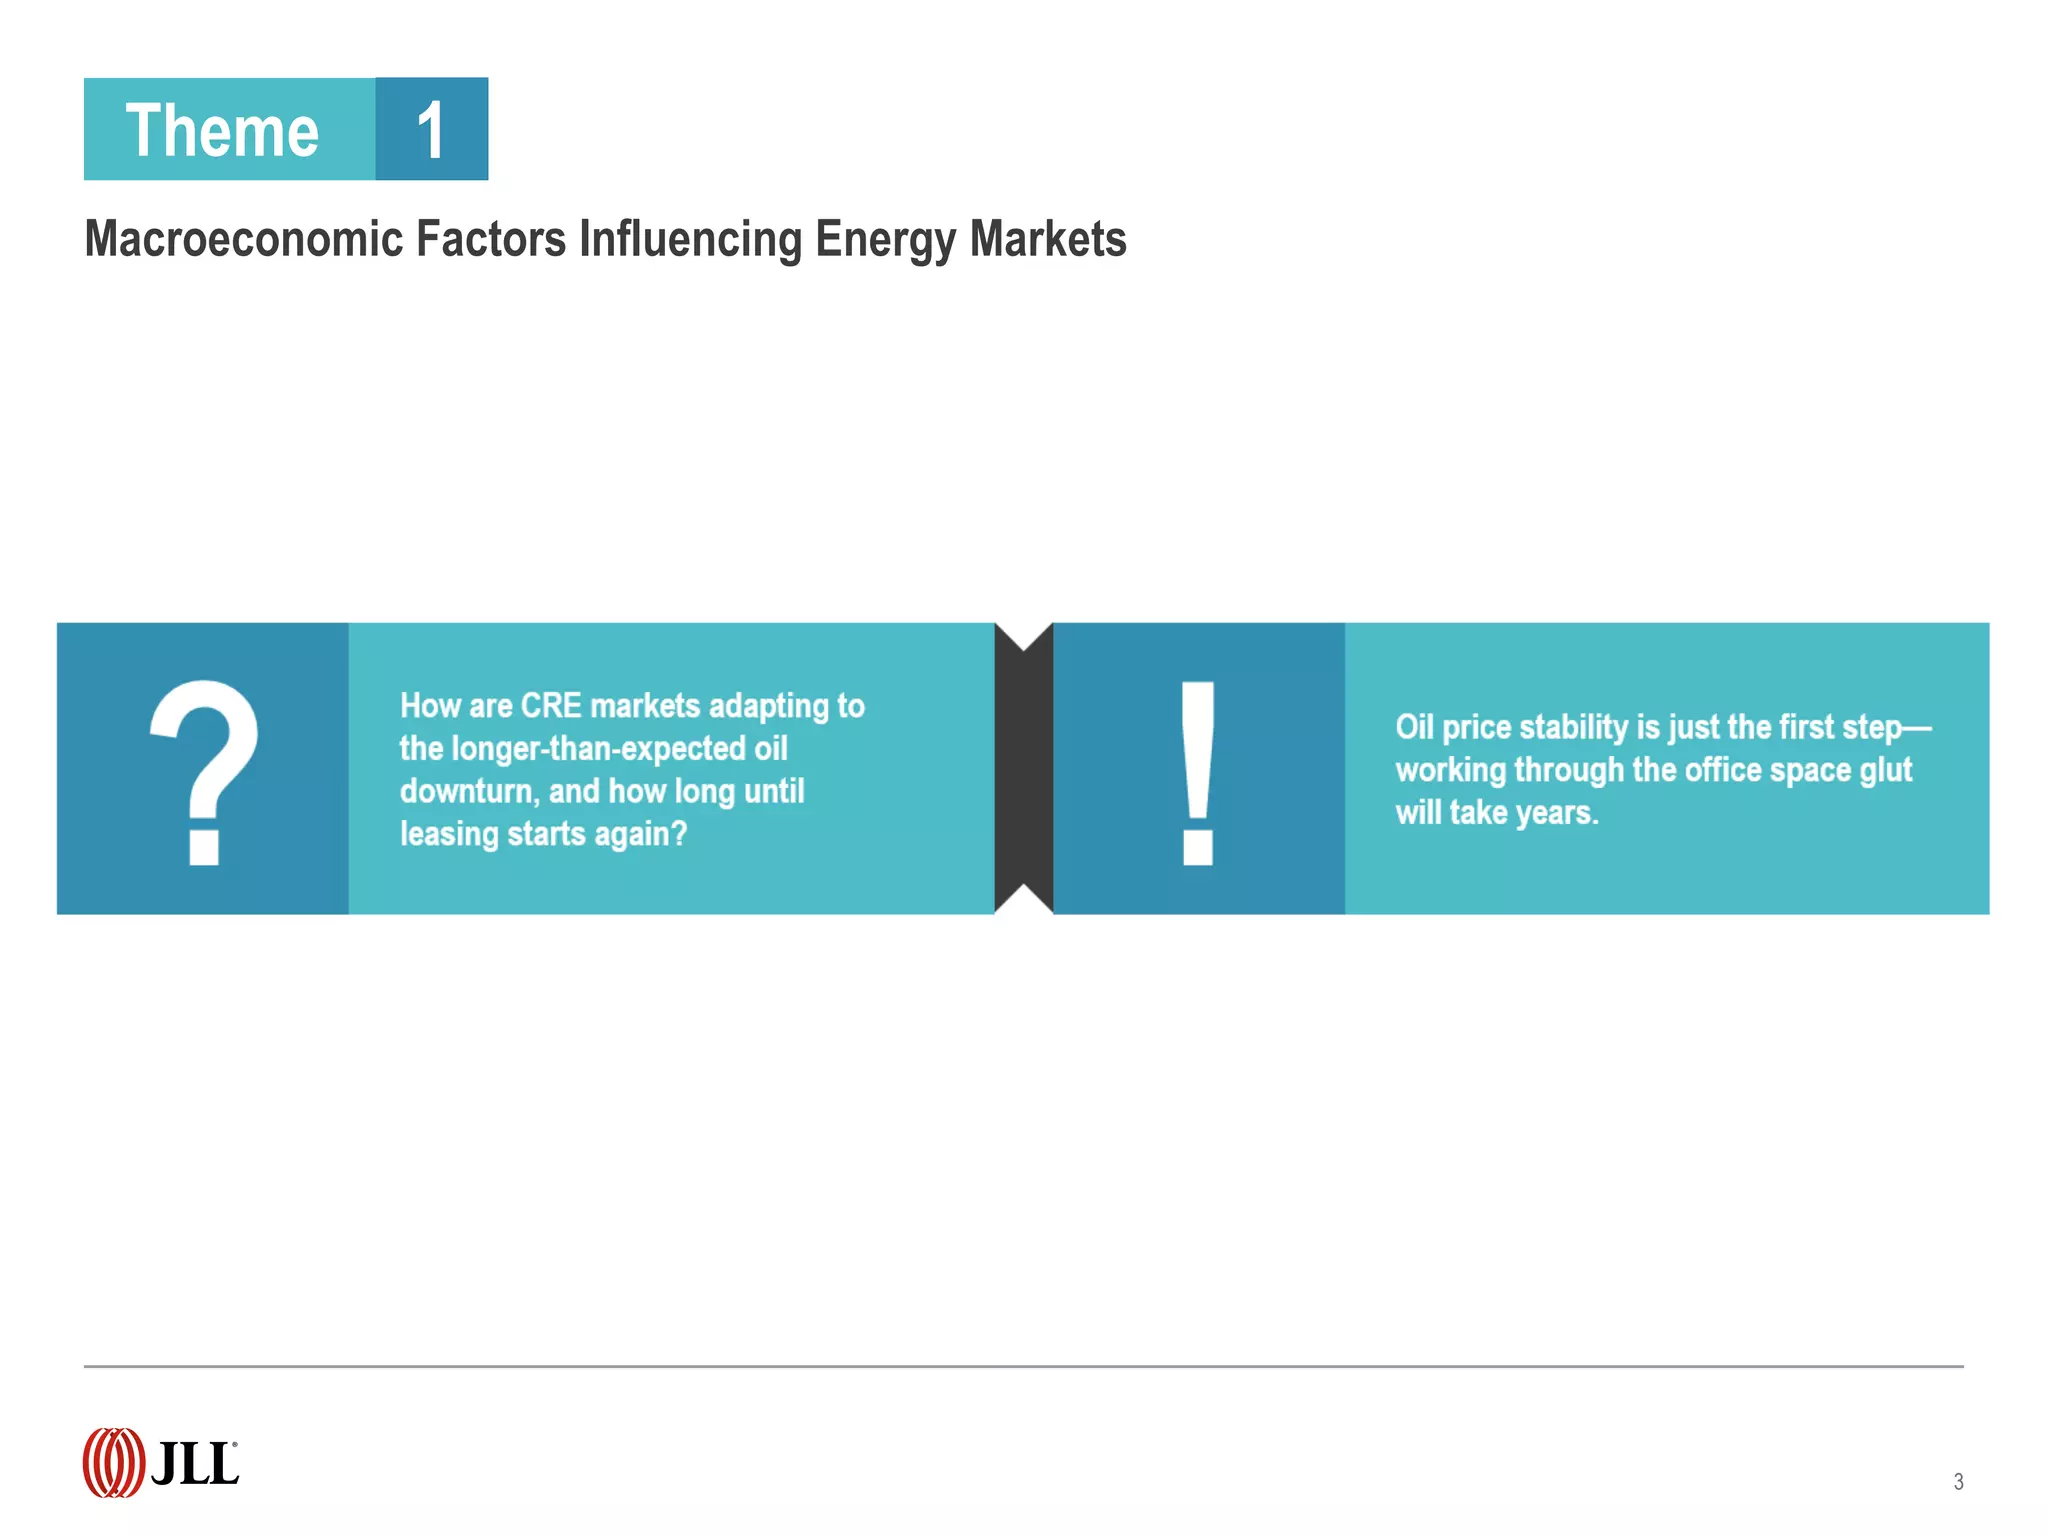
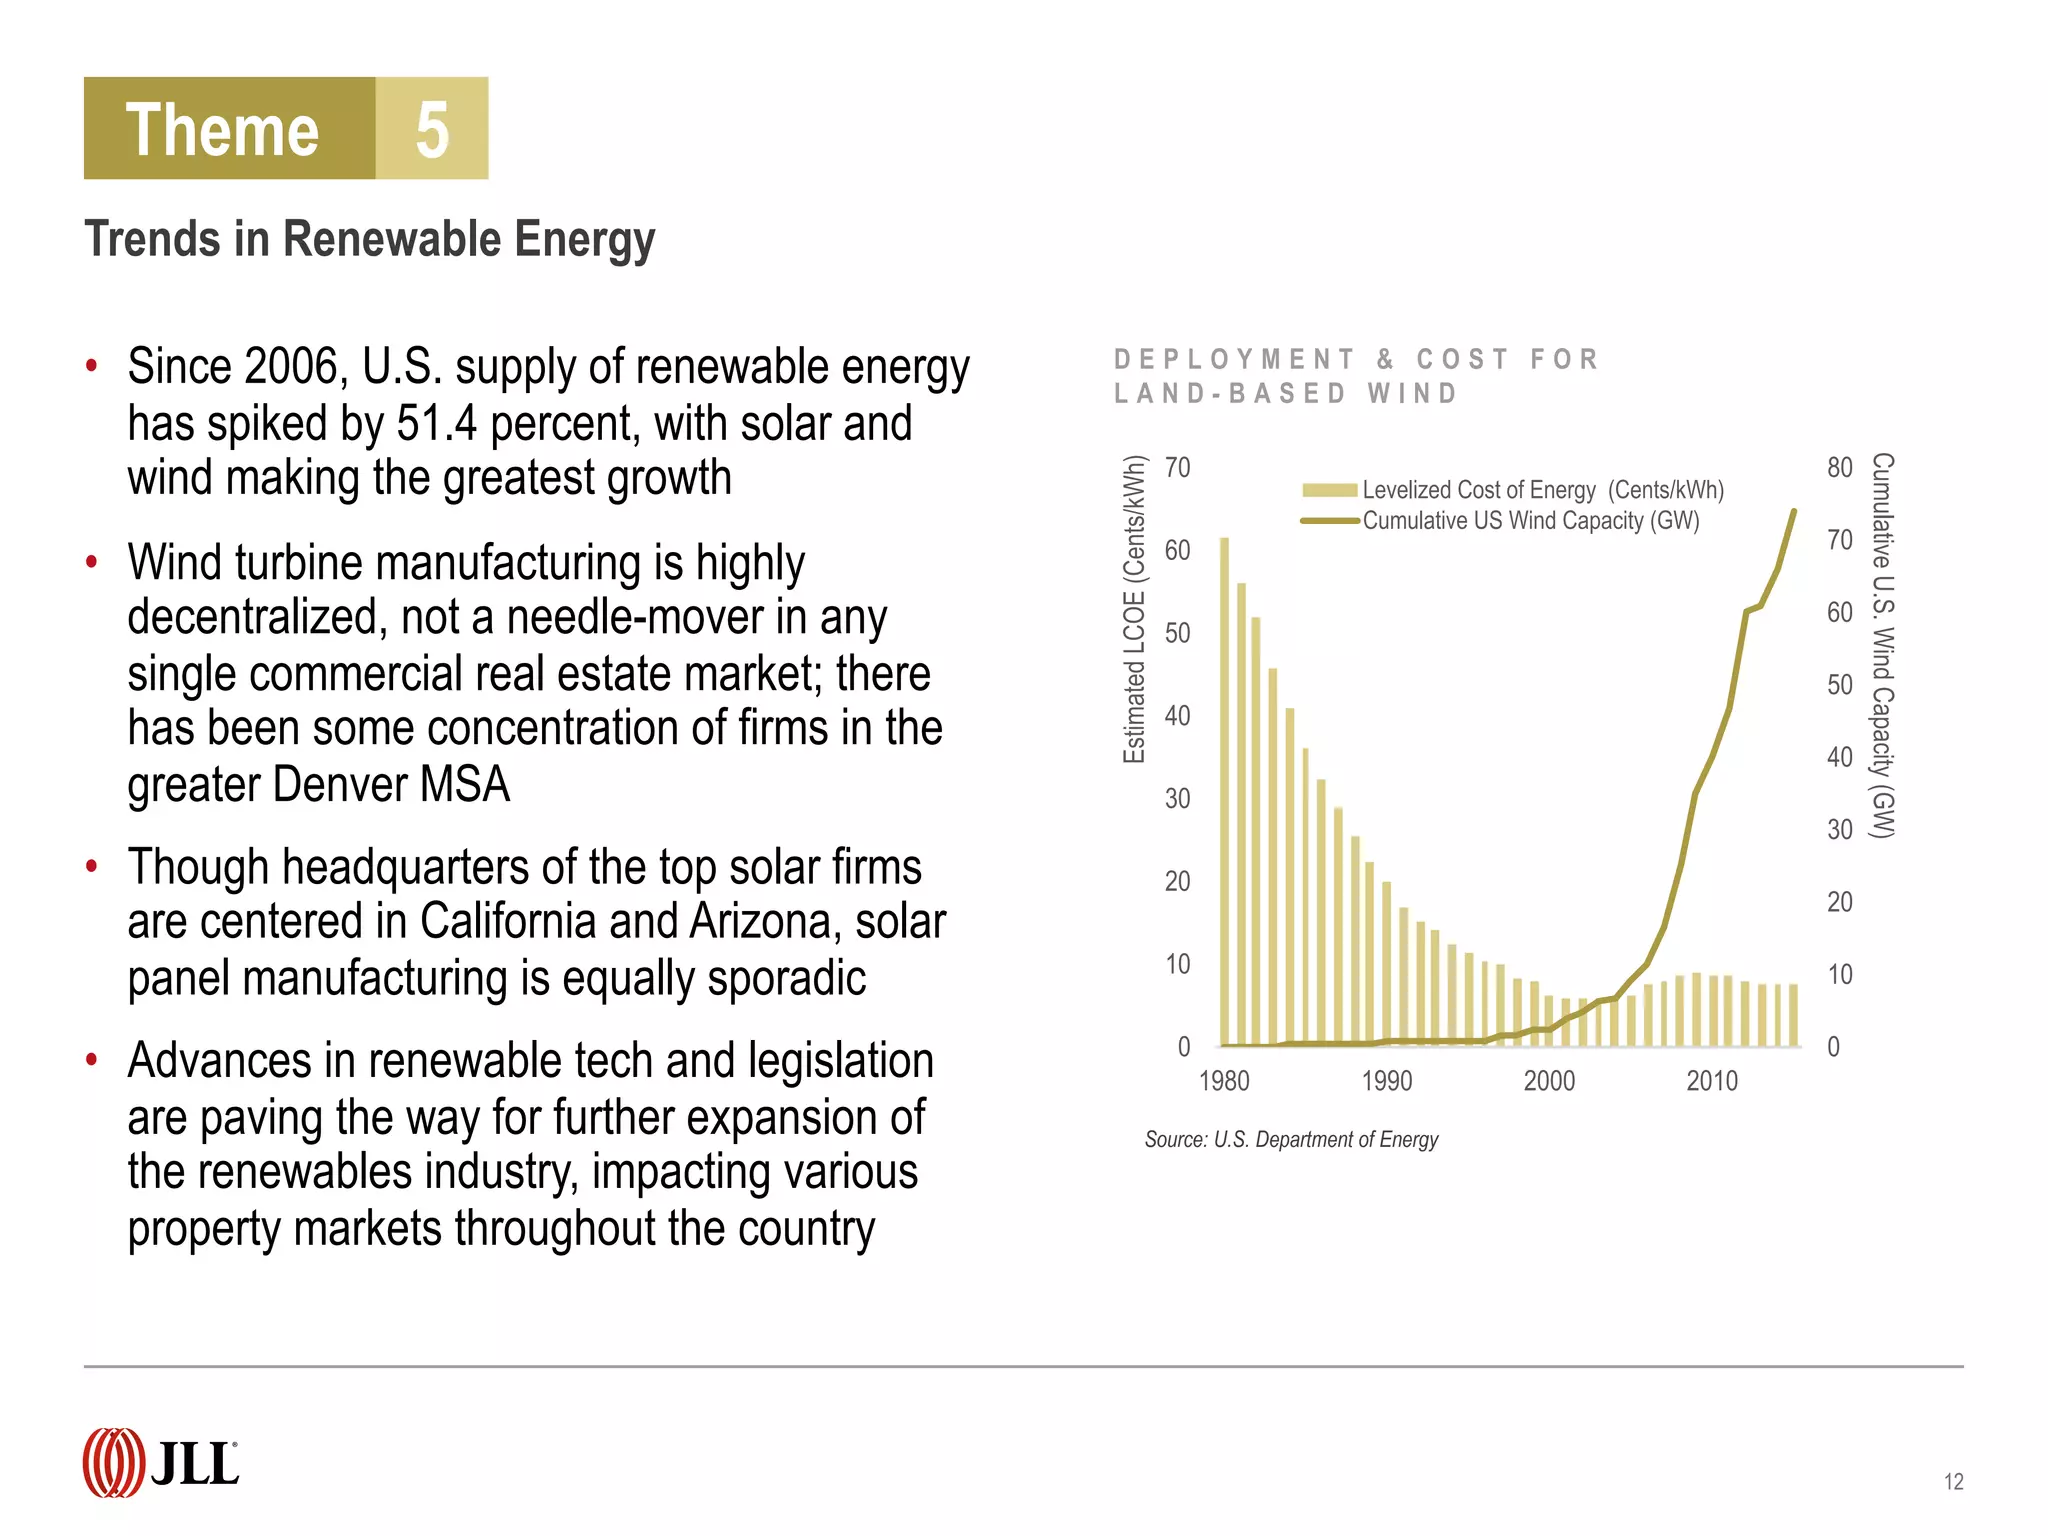
2016 Energy Outlook
Commercial real estate markets adapt amid volatile energy market
conditions North America | 2016
5 Key Themes
Exploring:
• Macroeconomic Factors Influencing Energy Markets
• State of Oil and Gas Companies
• The Impact to Upstream, Midstream and Downstream
• Regulations and Legislation
• Trends in Renewable Energy
2
3
Macroeconomic Factors Influencing Energy Markets
Theme 1
60
50
40
30
20
10
0
30
25
20
15
10
5
0
• OPEC’s stance has allowed the U.S. to transition into a swing-producer of oil
- U.S. crude oil production has grown substantially year-over-year, though still behind Saudi Arabia
and Russia
• The U.S. has marked its fourth year as the world’s top producer of petroleum and natural gas in
2015
• There will be a substantial lag in response time as companies stem the losses of the downturn
4
Macroeconomic Factors Influencing Energy Markets
0
5
10
15
20
25
30
35
40
45
50
1 2 3 4 5 6 7 8 9 10 11 12 13 14 15 16 17 18 19 20 21 22 23 24 25 26 27 28 29 30 31 32
M A J O R C O U N T R I E S ' P E T R O L E U M A N D N A T U R A L G A S P R O D U C T I O N
United States
Russia
Saudi Arabia
natural gas
petroleum
Source: U.S. Energy Information Administration (EIA). Note: Oil production reflects average annual barrels per day of crude oil including condensate
Quadrillion British thermal units Million barrels per day of oil equivalent
2009 2010 2011 2012 2013 2014 20152008
Theme 1
5
State of Oil and Gas Companies
Theme 2
• 102 North American oil and gas producers
have filed for bankruptcy since 2015,
accounting for over $67 billion in debt
• Modest amount of M&A activity, though
Enbridge did buy Spectra Energy in $28
billion dollar deal
• More than 72,000 jobs are expected to be
lost globally by year’s end by 12 major
energy companies alone
• Look for energy tenants to seek flexibility
and efficiency when addressing their office
needs moving forward:
- Subleasing or ‘chalk-lining’ (less formal
sublease arrangements
- Co-working space an emerging trend
- Fewer enormous campuses
6
State of Oil and Gas Companies
T O T A L B A N K R U P T C Y D E B T ( b i l l i o n U . S . d o l l a r s )
Source: Haynes and Boone’s Oil Patch Bankruptcy Monitor
$0.00
$10.00
$20.00
$30.00
$40.00
$50.00
$60.00
Jan
Feb
Mar
Apr
May
June
July
Aug
Sept
Oct
Nov
Dec
2015
2016
Bankruptcy filings (2015-2016)
Texas 46 Oklahoma 2
Canada 17 Alabama 1
Delaware 17 Arizona 1
Colorado 5 Massachusetts 1
Louisiana 4 Utah 1
New York 4 Virginia 1
Alaska 2
Theme 2
7
The Impact to Upstream, Midstream and Downstream
Theme 3
Upstream
• Sector primarily focused on
exploration and production of oil
• Hardest hit sector of the recent
downturn, especially the oilfield
services
• Record amounts of sublease
space has been flooding various
markets, largely due to upstream
energy companies
8
The Impact to Upstream, Midstream and Downstream
Midstream
• Operations surrounding energy
transportation and storage
• Fewer barrels flowing through the
pipelines results in distressed
companies – but midstream by and
large healthier than upstream
• Several midstream companies,
such as Enterprise Products
Partners and Magellan Midstream,
have posted earning gains
Downstream
• Includes the refining and
processing of oil and gas into
chemicals, plastics and other
products
• Has seen a boom in the
petrochemical industry thanks to
cheap feedstock (raw materials)
• 268 projects reported across the
U.S. with $170.0 billion currently
planned or underway
Theme 3
Office
market
Total energy
occupancy (m.s.f.)
Percent of
market inventory
Houston 61.5 30.0%
Calgary 31.7 46.8%
Denver 7.9 28.1%
Dallas 6.4 3.9%
Pittsburgh 2.1 4.2%
Fort Worth 1.9 4.7%
Edmonton 1.9 7.9%
E N E R G Y T E N A N T O F F I C E O C C U P A N C Y
B Y M A R K E T
Source: JLL Research
Company
Value
(billions)
Location Project
Cheniere Energy $9.5 Texas LNG Terminal
Sasol $8.9 Louisiana Ethane Cracker
Shell Chemical $6.0 Pennsylvania Ethane Cracker
Chevron Phillips
Chemical
$6.0 Texas
Low Viscosity Polyalphaolefins
(PAO)
PTT Global $5.0 Ohio Ethane Cracker
LyondellBasell $4.0 Texas Polyethylene
M A J O R P L A Y E R S – S L I C E S O F T H E P I E
Source: JLL Research
9
Regulations and Legislation
Theme 4
• Fracking continues to drive growth in
energy-linked office markets as it continues
to face opposition from local and state
legislatures
• The Colorado Supreme Court recently
ruled against a local government’s ability to
impede fracking, a major win for the
fracking industry there
• Keystone XL Pipeline successor, Dakota
Access Pipeline, has temporarily been
forced to come to a halt over environmental
concerns
• Investment and expansion in non-
renewable energy will be hindered as
companies face an increasingly regulated
market
10
Regulations and Legislation
S T A T E S W I T H F R A C K I N G B A N S I N P L A C E
Source: JLL Research
Theme 4
11
Trends in Renewable Energy
Theme 5
• Since 2006, U.S. supply of renewable energy
has spiked by 51.4 percent, with solar and
wind making the greatest growth
• Wind turbine manufacturing is highly
decentralized, not a needle-mover in any
single commercial real estate market; there
has been some concentration of firms in the
greater Denver MSA
• Though headquarters of the top solar firms
are centered in California and Arizona, solar
panel manufacturing is equally sporadic
• Advances in renewable tech and legislation
are paving the way for further expansion of
the renewables industry, impacting various
property markets throughout the country
12
Trends in Renewable Energy
D E P L O Y M E N T & C O S T F O R
L A N D - B A S E D W I N D
0
10
20
30
40
50
60
70
80
1980 1990 2000 2010
0
10
20
30
40
50
60
70
CumulativeU.S.WindCapacity(GW)
EstimatedLCOE(Cents/kWh)
Levelized Cost of Energy (Cents/kWh)
Cumulative US Wind Capacity (GW)
Source: U.S. Department of Energy
Theme 5
COPYRIGHT © JONES LANG LASALLE IP, INC. 2016
For more information, please contact:
Bruce Rutherford
International Director
Energy Practice Group
+1 (713) 888-4071
Bruce.Rutherford@am.jll.com
Eli Gilbert
Director of Energy Research
Americas Research
+1 (713) 425-5903
Eli.Gilbert@am.jll.com
Lindsay Brown
Senior Vice President
Energy Practice Group
+1 (303) 390-5215
Lindsay.Brown@am.jll.com
Rachel Alexander
Research Manager
Americas Research
+1 (713) 888-4044
Rachel.Alexander@am.jll.com
Like what you saw here?
>>> Get more from our 2016 Energy Outlook.

2016 Energy Outlook: Markets adapt amid volatile conditions

  • 1.
    2016 Energy Outlook Commercialreal estate markets adapt amid volatile energy market conditions North America | 2016
  • 2.
    5 Key Themes Exploring: •Macroeconomic Factors Influencing Energy Markets • State of Oil and Gas Companies • The Impact to Upstream, Midstream and Downstream • Regulations and Legislation • Trends in Renewable Energy 2
  • 3.
  • 4.
    60 50 40 30 20 10 0 30 25 20 15 10 5 0 • OPEC’s stancehas allowed the U.S. to transition into a swing-producer of oil - U.S. crude oil production has grown substantially year-over-year, though still behind Saudi Arabia and Russia • The U.S. has marked its fourth year as the world’s top producer of petroleum and natural gas in 2015 • There will be a substantial lag in response time as companies stem the losses of the downturn 4 Macroeconomic Factors Influencing Energy Markets 0 5 10 15 20 25 30 35 40 45 50 1 2 3 4 5 6 7 8 9 10 11 12 13 14 15 16 17 18 19 20 21 22 23 24 25 26 27 28 29 30 31 32 M A J O R C O U N T R I E S ' P E T R O L E U M A N D N A T U R A L G A S P R O D U C T I O N United States Russia Saudi Arabia natural gas petroleum Source: U.S. Energy Information Administration (EIA). Note: Oil production reflects average annual barrels per day of crude oil including condensate Quadrillion British thermal units Million barrels per day of oil equivalent 2009 2010 2011 2012 2013 2014 20152008 Theme 1
  • 5.
    5 State of Oiland Gas Companies Theme 2
  • 6.
    • 102 NorthAmerican oil and gas producers have filed for bankruptcy since 2015, accounting for over $67 billion in debt • Modest amount of M&A activity, though Enbridge did buy Spectra Energy in $28 billion dollar deal • More than 72,000 jobs are expected to be lost globally by year’s end by 12 major energy companies alone • Look for energy tenants to seek flexibility and efficiency when addressing their office needs moving forward: - Subleasing or ‘chalk-lining’ (less formal sublease arrangements - Co-working space an emerging trend - Fewer enormous campuses 6 State of Oil and Gas Companies T O T A L B A N K R U P T C Y D E B T ( b i l l i o n U . S . d o l l a r s ) Source: Haynes and Boone’s Oil Patch Bankruptcy Monitor $0.00 $10.00 $20.00 $30.00 $40.00 $50.00 $60.00 Jan Feb Mar Apr May June July Aug Sept Oct Nov Dec 2015 2016 Bankruptcy filings (2015-2016) Texas 46 Oklahoma 2 Canada 17 Alabama 1 Delaware 17 Arizona 1 Colorado 5 Massachusetts 1 Louisiana 4 Utah 1 New York 4 Virginia 1 Alaska 2 Theme 2
  • 7.
    7 The Impact toUpstream, Midstream and Downstream Theme 3
  • 8.
    Upstream • Sector primarilyfocused on exploration and production of oil • Hardest hit sector of the recent downturn, especially the oilfield services • Record amounts of sublease space has been flooding various markets, largely due to upstream energy companies 8 The Impact to Upstream, Midstream and Downstream Midstream • Operations surrounding energy transportation and storage • Fewer barrels flowing through the pipelines results in distressed companies – but midstream by and large healthier than upstream • Several midstream companies, such as Enterprise Products Partners and Magellan Midstream, have posted earning gains Downstream • Includes the refining and processing of oil and gas into chemicals, plastics and other products • Has seen a boom in the petrochemical industry thanks to cheap feedstock (raw materials) • 268 projects reported across the U.S. with $170.0 billion currently planned or underway Theme 3 Office market Total energy occupancy (m.s.f.) Percent of market inventory Houston 61.5 30.0% Calgary 31.7 46.8% Denver 7.9 28.1% Dallas 6.4 3.9% Pittsburgh 2.1 4.2% Fort Worth 1.9 4.7% Edmonton 1.9 7.9% E N E R G Y T E N A N T O F F I C E O C C U P A N C Y B Y M A R K E T Source: JLL Research Company Value (billions) Location Project Cheniere Energy $9.5 Texas LNG Terminal Sasol $8.9 Louisiana Ethane Cracker Shell Chemical $6.0 Pennsylvania Ethane Cracker Chevron Phillips Chemical $6.0 Texas Low Viscosity Polyalphaolefins (PAO) PTT Global $5.0 Ohio Ethane Cracker LyondellBasell $4.0 Texas Polyethylene M A J O R P L A Y E R S – S L I C E S O F T H E P I E Source: JLL Research
  • 9.
  • 10.
    • Fracking continuesto drive growth in energy-linked office markets as it continues to face opposition from local and state legislatures • The Colorado Supreme Court recently ruled against a local government’s ability to impede fracking, a major win for the fracking industry there • Keystone XL Pipeline successor, Dakota Access Pipeline, has temporarily been forced to come to a halt over environmental concerns • Investment and expansion in non- renewable energy will be hindered as companies face an increasingly regulated market 10 Regulations and Legislation S T A T E S W I T H F R A C K I N G B A N S I N P L A C E Source: JLL Research Theme 4
  • 11.
    11 Trends in RenewableEnergy Theme 5
  • 12.
    • Since 2006,U.S. supply of renewable energy has spiked by 51.4 percent, with solar and wind making the greatest growth • Wind turbine manufacturing is highly decentralized, not a needle-mover in any single commercial real estate market; there has been some concentration of firms in the greater Denver MSA • Though headquarters of the top solar firms are centered in California and Arizona, solar panel manufacturing is equally sporadic • Advances in renewable tech and legislation are paving the way for further expansion of the renewables industry, impacting various property markets throughout the country 12 Trends in Renewable Energy D E P L O Y M E N T & C O S T F O R L A N D - B A S E D W I N D 0 10 20 30 40 50 60 70 80 1980 1990 2000 2010 0 10 20 30 40 50 60 70 CumulativeU.S.WindCapacity(GW) EstimatedLCOE(Cents/kWh) Levelized Cost of Energy (Cents/kWh) Cumulative US Wind Capacity (GW) Source: U.S. Department of Energy Theme 5
  • 13.
    COPYRIGHT © JONESLANG LASALLE IP, INC. 2016 For more information, please contact: Bruce Rutherford International Director Energy Practice Group +1 (713) 888-4071 Bruce.Rutherford@am.jll.com Eli Gilbert Director of Energy Research Americas Research +1 (713) 425-5903 Eli.Gilbert@am.jll.com Lindsay Brown Senior Vice President Energy Practice Group +1 (303) 390-5215 Lindsay.Brown@am.jll.com Rachel Alexander Research Manager Americas Research +1 (713) 888-4044 Rachel.Alexander@am.jll.com Like what you saw here? >>> Get more from our 2016 Energy Outlook.